DOI:
10.1039/C7RA05965E
(Paper)
RSC Adv., 2017,
7, 37689-37698
Catalytic effect of MoS2 on hydrogen storage thermodynamics and kinetics of an as-milled YMg11Ni alloy
Received
28th May 2017
, Accepted 25th July 2017
First published on 31st July 2017
Abstract
In this study, YMg11Ni and YMg11Ni + 5 wt% MoS2 (named YMg11Ni–5MoS2) alloys were prepared by mechanical milling to examine the effect of adding MoS2 on the hydrogen storage performance of a Y–Mg–Ni-based alloy. The as-cast and milled alloys were tested to identify their structures by X-ray diffraction and transmission electron microscopy. The isothermal hydrogen storage thermodynamics and dynamics were identified through an automatic Sieverts apparatus, and the non-isothermal dehydrogenation performance was investigated by thermogravimetry and differential scanning calorimetry. The dehydrogenation activation energy was calculated by both Arrhenius and Kissinger methods. Results revealed that adding MoS2 produces a very slight effect on hydrogen storage thermodynamics but causes an obvious reduction in the hydrogen sorption and desorption capacities because of the deadweight of MoS2. The addition of MoS2 significantly enhances the dehydrogenation performance of the alloy, such as lowering dehydrogenation temperature and enhancing dehydrogenation rate. Specifically, the initial desorption temperature of the alloy hydride lowers from 549.8 K to 525.8 K. The time required to desorb hydrogen at 3 wt% H2 is 1106, 456, 363, and 180 s corresponding to hydrogen desorption temperatures at 593, 613, 633, and 653 K for the YMg11Ni alloy, and 507, 208, 125, and 86 s at identical conditions for the YMg11Ni–5MoS2 alloy. The dehydrogenation activation energy (Ea) values with and without added MoS2 are 85.32 and 98.01 kJ mol−1. Thus, a decrease in Ea value by 12.69 kJ mol−1 occurs and is responsible for the amelioration of the hydrogen desorption dynamics by adding a MoS2 catalyst.
Introduction
The wide application of hydrogen as a clean fuel is believed to largely offset environmental problems that result from the mass consumption of fossil fuels. The rapid development and extensive application of hydrogen fuel cell vehicles are expected to fundamentally alleviate accelerating global warming and the increasingly serious air pollution because the combustion of fossil fuels is related to the consumption of approximately a quarter of the energy of the whole world1 and the emission of approximately 23% of global CO2.2 However, the application of hydrogen as vehicle fuel is seriously limited, because hydrogen storage systems are not safe and are inefficient.3 In other words, whether the hydrogen fuel cell vehicle will be widely applied in this century depends on its safety, economics, and practical hydrogen storage capacity.4 Storing hydrogen in metal hydrides is the preferred candidate among the known hydrogen storage methods and is expected to make mobile application possible.5 Many hydrogen storage materials have been established, and some of them even have been commercialized on a large scale. These materials are rare earth-based AB5 and Laves-phase AB2 alloys. However, selecting which material could satisfy the performance requirements for vehicular application presented by the U.S. Department of Energy is difficult.6 Concerning hydrogen storage capacity, Mg and Mg-based alloys show their preponderances for on-board hydrogen fuel cell.7 However, the practical application of Mg and Mg-based alloys is restricted severely by some inherent disadvantages, including the high thermodynamic stability and slow hydrogen absorption/desorption dynamics. Therefore, the researchers must exert considerable effort to further improve these hydrogen storage properties of the Mg-based alloys.
Based on the summary of numerous literatures, the two major approaches to improve the Mg and Mg-based alloys in hydrogen storage performances are reducing the particle size and adding catalysts (elements or compounds) to form Mg-based composites or solid solution. Ouyang et al.8–10 found the P-milling technique can tune thermodynamic and kinetic properties of Mg-based hydrogen storage materials. The structures of Mg and Mg-based alloys have obvious effects on their hydrogen absorption/desorption thermodynamics and dynamics.11 The formation of composite microstructures can substantially improve the hydrogen storage properties of Mg-based alloys.12 In particular, when the grain sizes of Mg-based alloys are far below micrometer scale, their hydriding/dehydriding performances will be improved dramatically.13,14 Kumar et al.15 found that ultrafine microstructure (sub 100 nm range) decreases Mg2Ni alloy by 100 K in the hydrogen absorption/desorption temperature, that is, from 573 K to 473 K. This result was also affirmed by Cheung et al.16 that the stability of MgH2 drops quickly when its particle size reduces to nanoscale. The hydrogen atom diffusion distance for traversing the hydride is shortened relatively as a result of the small scales and high surface area-to-volume ratio belonging to the nanostructured powders, thereby improving the hydrogenation dynamics by several times and even more.17 Some synthetic methods, such as arc plasma,18 equal channel angular pressing (ECAP),19 inert gas condensation (IGC),20 hydriding combustion synthesis,21 mechanical milling,22,23 and rapid solidification (RS),24,25 have been widely used in the syntheses of different amorphous and nanocrystalline Mg-based alloys with various ingredients. Among all of the techniques, mechanical milling and melt spinning are considered to be fairly effective by which the amorphous and/or nanocrystalline alloys can be obtained with homogeneous element distributions. Poletaev et al.26 prepared the LaMg11Ni alloy using rapid solidification technology and found that LaMg11Ni alloy that solidified at the highest cooling rate exhibited the best hydriding dynamics and reached the maximal hydrogen absorption capacity of 5.02 wt% H2. Jeon et al.27 prepared a composite, of which the Mg nanoparticle was more than 60 wt% and dispersed in a dissolved polymer. They also found that the hydrogen absorption and desorption could occur in this composite with a fast dynamics below 473 K.
In general, rare earth elements,18 transition metallic elements28 and their oxides,29–31 fluorides,32,33 halides,34 hydrides,35 and intermetallic compounds,36 are good catalysts that can destabilize MgH2 and enhance the hydriding and dehydriding rate of the alloy hydrides. The dissociation of hydrogen molecules on the Mg surface is considered a rate-controlling factor for dehydrogenation because of the high energy (1.15 eV) required. This dissociation energy can be reduced by adding catalysts. For example, the presence of transition metals, such as Pd, Cu, Ni, and Co, can reduce dissociation energy to 0.39, 0.56, 0.06, and 0.03 eV, respectively.37 Theoretically, the substitutional atoms in MgH2 can cause an interaction between the valence electron of H and the unsaturated d/f electron shells of transition metals, which will weaken the Mg–H bond. Thus, the hydrogen desorption behavior of MgH2 is ameliorated significantly.38 In addition, some catalysts with high hardness also play the role of cracking agent during ball milling so that the size of alloy particles can be reduced dramatically.39 The advantageous effect of reducing particle size on hydrogen sorption and desorption properties has been described. Sadhasivam et al.13 investigated the effect of adding Mm (the major ingredients are Ce and La) oxide on the dehydrogenation dynamics of MgH2 and found that it improved hydrogenation behavior. The initial dehydrogenation temperature for MgH2 catalyzed by 5 wt% Mm oxide obtained a decrease of 349 K, that is, from 654 K (ball-milled) to 578 K. Daryani et al.40 reported that adding TiO2 catalysts can significantly enhance the milling efficiency and accelerate the size reduction of MgH2 during ball milling. Moreover, the addition of 6 mol% TiO2 markedly improved the hydrogen absorption dynamics and decreased the decomposition temperature of as-milled MgH2 by 373 K.
Our previous work has investigated the thermodynamics and dynamics of the REMg11Ni (RE = La, Nd, Pr) + x wt% Ni (x = 100, 200) alloys and found that Ni addition exhibits an effective catalytic action on ameliorating the hydrogen storage properties of REMg11Ni (RE = La, Nd, Pr) alloys.41–43 However, the hydrogenation thermodynamics and dynamics ameliorated by adding Ni negatively affected capacity. Han et al.44,45 found MoS2 has superior properties on catalyzing the hydriding/dehydriding kinetics of MgH2 and markedly decreases the decomposition temperature of LiBH4. To avoid the lowering of hydrogen adsorption capacity because of excessive Ni, a trace of MoS2 is added in YMg11Ni as catalyst. In the present work, YMg11Ni alloy is investigated for its phase composition, microstructure, catalytic hydrogen desorption temperature, and activation energy to study the effects of MoS2 on hydrogen storage thermodynamics and kinetics of as-milled YMg11Ni alloy.
Experimental
YMg11Ni alloy was prepared in a vacuum induction furnace with 0.04 MPa protective gas of helium for preventing the volatilization of Mg. The liquid alloy was cast into ingots with a cooled copper mould. Portions of the ingots were severed and crushed into powders with diameters of approximately 50 μm. After crushing, 5 wt% MoS2 (particle size ≤ 30 nm, Sinopharm Chemical Reagent Co., Ltd) was added and a planetary-type mill was used for milling this mixed powder. During ball milling, the argon atmosphere was selected to fill up the mill to prevent the oxidation of mixed powders. In this experiment, the ball-to-powder weight ratio was 35![[thin space (1/6-em)]](https://www.rsc.org/images/entities/char_2009.gif) :
:![[thin space (1/6-em)]](https://www.rsc.org/images/entities/char_2009.gif) 1, in which the balls and powders were placed into Cr–Ni stainless steel vials and ran at 135 rpm for 20 h. During the whole process, the mill had a 10 min rest after every 60 min milling to prevent overheating.
1, in which the balls and powders were placed into Cr–Ni stainless steel vials and ran at 135 rpm for 20 h. During the whole process, the mill had a 10 min rest after every 60 min milling to prevent overheating.
The X-ray diffraction (XRD) (D/max/2400) equipped with CuKα1 radiation filtered by graphite was used to test the as-cast and milled alloys of their phase structures. The experimental parameters of XRD were set at 160 mA, 40 kV, and 10° min−1. High-resolution transmission electron microscope (HRTEM) (JEM-2100F) was used to observe the powder samples at 200 kV. Electron diffraction (ED) was used to ascertain their crystalline states.
An automatically controlled Sieverts apparatus was used to measure the isothermal hydriding and dehydriding dynamics with the temperature error controlled within ±2 K. The weight of samples for each measurement was 300 mg. The hydrogenation reaction proceeded in 3 MPa hydrogen (initial pressure for hydrogenation reaction) at 593, 613, 633, and 653 K, at similar temperatures at which the dehydrogenation process proceeded with the hydrogen pressure setting at 1 × 10⁻⁴ MPa. Thermogravimetry and differential scanning calorimetry (DSC) (SDT-Q600) were used to investigate the non-isothermal dehydrogenation performance with heating rates setting at 5, 10, 15, and 20 K min−1. The temperature programmed desorption (TDP) performance of the hydrogenation saturated alloys was test by thermogravimetry measurement under dynamic heating condition (5 K min−1) and 35.1 mL min−1 high-purity argon (99.999%) flow rate.
Results and discussion
Structure characteristics
Fig. 1 shows the XRD curves of the as-cast and milled YMg11Ni and YMg11Ni + 5 wt% MoS2 alloys before and after hydrogenation and dehydrogenation. The hydrogenation reaction occurred at 593 K and 3 MPa, whereas dehydrogenation reaction occurred at 593 K and 1 × 10⁻⁴ MPa. The XRD pattern of alloys were identified by ICDD, and the results revealed that two phases appear inside the as-cast alloy, including Mg24Y5 and Mg2Ni as the major and secondary phases, respectively. Mechanical milling causes diffraction peaks to merge and dramatically broaden, as well as show a typical nanocrystalline and amorphous structure. After adding MoS2, the diffraction peaks become more broaden, which means the more serious refinement of grains, as Fig. 1(b) shows. After hydrogenation, the alloy exhibits an obvious crystalline reaction, and three hydrides can be found in the YMg11Ni alloy. The hydrides are MgH2, Mg2NiH4, and YH3. Based on XRD analysis, possible formation pathways of the hydrides can be inferred as follows:46
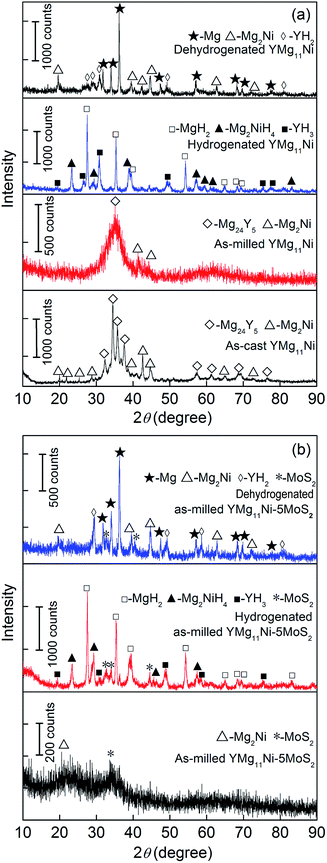 |
| | Fig. 1 XRD profiles of the as-cast and milled alloys before and after hydrogen absorption and desorption: (a) YMg11Ni, (b) YMg11Ni–5MoS2. | |
Three phases appear in the dehydrogenated YMg11Ni alloy, including YH2, Mg, and Mg2Ni. The path of the dehydrogenation reaction can be inferred as follows:
YH2 phase remains undecomposed, which is due to its high thermal stability. Fig. 1(b) shows that adding MoS2 catalyst does not create any new phase in the pattern, suggesting no reaction between the MoS2 and any element in the alloy. From the above-mentioned results, the reversible reactions during the hydrogenation and dehydrogenation processes include the following reactions:
The HRTEM images and ED patterns of the as-milled YMg11Ni and YMg11Ni–5MoS2 alloys before and after hydrogenation and dehydrogenation are shown in Fig. 2. The as-milled YMg11Ni alloy has a nanocrystalline and amorphous structure with particle size of approximately 15 nm in average. The mechanical milling does not change the alloy of its phase composition, containing the Mg24Y and Mg2Ni phases, which are also affirmed by the ED patterns analysis. After hydrogenation, the as-milled YMg11Ni alloy still shows a nanocrystalline and amorphous structure (Fig. 2(b)), but the amorphous phase obviously decreases, suggesting that hydrogen absorption facilitates the crystalline reaction. Three hydrides, namely, MgH2, Mg2NiH4, and YH3, appear in the hydrogenated alloy, which is supported by ED patterns. Fig. 2(c) shows that the dehydrogenated YMg11Ni alloy shows a completely crystalline structure, and the grain sizes visibly grow. Pukazhselvan et al.22 have noticed a similar phenomenon. The structural analysis and ED rings index revealed that three phases appear in the dehydrogenated YMg11Ni alloy, namely, Mg, Mg2Ni, and YH2. Apparently, YH2 maintains undecomposed in the process of hydrogen desorbed, which is consistent with XRD detection. Fig. 2(d) shows that the as-milled YMg11Ni–5MoS2 alloy has a nanocrystalline structure, but compared with the undoped MoS2 alloy, the grain size is obviously diminished (Fig. 2(a)), suggesting that adding MoS2 catalyst can enhance the ball milling efficiency. The soft MoS2 particles are excellent lubrication, which can inhibit the agglomeration and cold welding of alloy particles during milling.
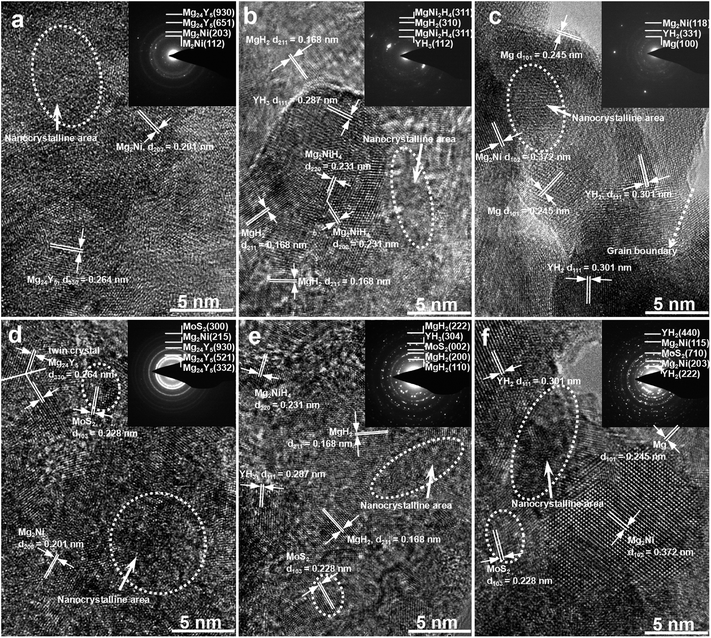 |
| | Fig. 2 HRTEM micrographs and SAD patterns of the as-milled alloys at different states: (a) as-milled YMg11Ni, (b) hydrogenated YMg11Ni, (c) dehydrogenated YMg11Ni, (d) as-milled YMg11Ni–5MoS2, (e) hydrogenated YMg11Ni–5MoS2, (f) dehydrogenated YMg11Ni–5MoS2. | |
P–C–T curves and hydrogen storage thermodynamics
Fig. 3 shows the P–C–T curves of the as-milled YMg11Ni and YMg11Ni–5MoS2 alloys at 593, 613, 633, and 653 K by which the effect of adding MoS2 on the hydrogenation/dehydrogenation thermodynamics can be examined. The absorbing and desorbing pressure plateaus of the alloys are fairly flat, and the hysteresis (Hf = ln(Pa/Pd)) is relatively small. The addition of MoS2 catalyst has an insignificant effect on the plateau features of the P–C–T curves. Two pressure plateaus appear in each P–C–T curve. The higher pressure plateau corresponds to the Mg2NiH4, the lower one is MgH2 that is according to the reported results,47 which is demonstrated in Mg–10Ni–xMm alloy.48 Based on the plateau pressures (Pa and Pd) in Fig. 3, the Van't Hoff equation can be used to calculate the thermodynamic parameters, such as enthalpy change (ΔH) and entropy change (ΔS), as follows:49| | |
ln[P(H2)/P0] = ΔH/(RT) − ΔS/R
| (1) |
where P(H2) represents the equilibrium hydrogen gas pressure (due to having two pressure plateaus, the pressure corresponding to MgH2 as P(H2) was selected in this report), P0 represents the standard atmospheric pressure, T and R represent the sample temperature and gas constant, respectively. The Van't Hoff graphs of ln[P(H2)/P0] versus 1/T for the YMg11Ni and YMg11Ni–5MoS2 alloys can be plotted using the logarithmic transform of eqn (1), as inserted in Fig. 3. With the aid of Van't Hoff plots, the thermodynamic parameters can be calculated conveniently, as listed in Table 1.
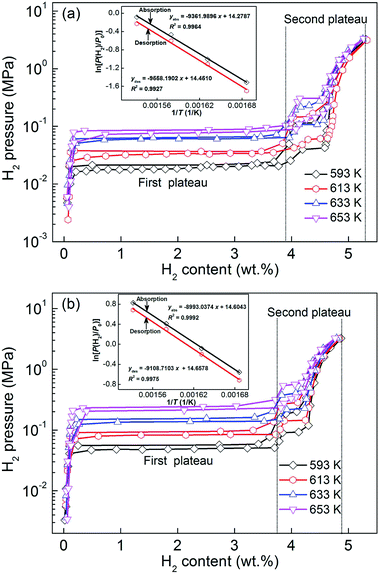 |
| | Fig. 3 P–C–T curves and Van't Hoff plots of the as-milled (20 h) alloys in the temperature range of 593–653 K: (a) YMg11Ni alloy, (b) YMg11Ni–5MoS2 alloy. | |
Table 1 Enthalpy change (ΔH) and entropy change (ΔS) of the hydrogenation/dehydrogenation reaction of alloys
| Samples |
Plateau |
ΔHab (kJ mol−1) |
ΔSab (J mol−1 K−1) |
ΔHde (kJ mol−1) |
ΔSde (J mol−1 K−1) |
| As-cast YMg11Ni |
First plateau (0–4.170 wt% H) |
−82.60 |
−117.78 |
86.27 |
118.60 |
| Second plateau (4.170–5.428 wt% H) |
−62.41 |
−89.67 |
63.32 |
94.89 |
| As-milled YMg11Ni |
First plateau (0–3.907 wt% H) |
−77.83 |
−118.71 |
79.46 |
120.15 |
| Second plateau (3.907–5.311 wt% H) |
−54.09 |
−91.92 |
58.433 |
107.87 |
| YMg11Ni–5MoS2 |
First plateau (0–3.749 wt% H) |
−74.76 |
−121.42 |
75.73 |
121.86 |
| Second plateau (3.749–4.881 wt% H) |
−50.746 |
−107.36 |
54.74 |
113.43 |
These findings indicate that ball milling can reduce the absolute value of hydrogen desorption thermodynamic parameters, and the addition of MoS2 catalyst into YMg11Ni alloy incurs a further reduction. In addition, the obtained dehydrogenation enthalpies (ΔHde) and entropies (ΔSde) of the second phase are consistent with the reported values of Mg2NiH4 in the range of 53.23–72.9 kJ mol−1.50 The dehydrogenation enthalpies (ΔHde) and entropies (ΔSde) of Mg2NiH4 in YMg11Ni–5MoS2 are 54.74 kJ mol−1 and 113.43 J (K−1 mol−1), respectively, which are much lower than those of Mg2NiH4 in as-milled YMg11Ni alloy (64.5 kJ mol−1, 122.3 J (K−1 mol−1)),50 let alone in as-cast YMg11Ni alloy (63.32 kJ mol−1, 94.89 J (K−1 mol−1)). As considered by Agarwal et al.,36 the obvious thermodynamic improvement, that is, the destabilization of MgH2, can be achieved only by reducing the grain size to less than 5 nm, which is difficult to realize by mechanical milling. Cheung et al.16 concluded through theoretical calculation that when the grain size of MgH2 reduces to approximately 1 nm, its stability will drop drastically. Further study revealed that the thermodynamic change could hardly occur unless its grain size is less than 2 nm. However, Paskevicius et al.51 concluded that MgH2 has lesser stability when the particle size is approximately 7 nm than the bulk material, whereas Anik et al.5 considered that the addition of transition metals into Mg or alloying with Mg will considerably ameliorate magnesium hydride in its thermodynamics.
Hydrogenation and dehydrogenation dynamics
For investigating the effect of adding MoS2 on hydrogenation dynamics, the variations of hydrogenation capacity of the as-milled YMg11Ni and YMg11Ni–5MoS2 alloys with hydriding reaction time were measured at 3 MPa and different temperatures at 593, 613, 633, and 653 K, as presented in Fig. 4. In the initial stage, the as-milled alloys showed a high hydrogen-absorbing rate. Subsequently, the hydrogen content took a long time to reach saturation. The circumstance that determines the hydrogenation curve characteristics is probably that at which the alloy obtains a hydride layer on its surface in the initial few minutes that may prevent hydrogen from further diffusion and limit the reaction rate. The addition of MoS2 catalyst engenders a positive contribution to the enhancement of the hydrogen absorption rate of YMg11Ni alloy. From Fig. 4, the hydrogenation capacities within 60 s at 593, 613, 633, and 653 K are 4.076, 4.399, 4.559, and 4.714 wt%, respectively, for the YMg11Ni alloy and 4.364, 4.422, 4.616, and 4.828 wt%, respectively, for the YMg11Ni–5MoS2 alloy. The addition of MoS2 compound incurs an obvious catalytic effect on the hydrogenation properties of the alloy. The hydrogenation process of MgH2 is governed by three critical steps, namely, (a) the dissociation of H2 from molecule to atom on Mg surface, (b) the diffusion of H atoms along the crystal boundary, and (c) the hydrogenation/dehydrogenation of catalyst and Mg atoms and the transformation of MgH2 at catalyst/Mg interface. Among all of these steps, step (a) is considered as the rate-controlling factor because of the high energy it requires.52 Chen et al.53 have reported that atomic Fe can catalyze the dehydrogenation of MgH2 most because of its polyvalency and moderate strength of electron attraction. Similar to Fe, Mo also has polyvalency. Moreover, Jia et al.54 have demonstrated that Mo is able to facilitate the dissociation of hydrogen. Barkhordarian et al.55 proved that the addition of some catalysts, such as transition metal oxides or sulfide, incurs a decline in this dissociation energy. Therefore, adding MoS2 particles is speculated to accelerate step (a), that is, facilitate hydrogen dissociation from molecules into atoms. MoS2 covered on fine alloy grains provides many channels to penetrate hydrogen and active nucleation sites to form MgH2. Moreover, the added MoS2 can work as lubricant, which inhibits the agglomeration and cold welding, and improve the effects of ball milling, including the decrease in particle size and increase in surface area-to-volume ratio, consequently facilitating H atoms passing through the hydride and significantly improving the hydrogenation and dehydrogenation dynamics.56
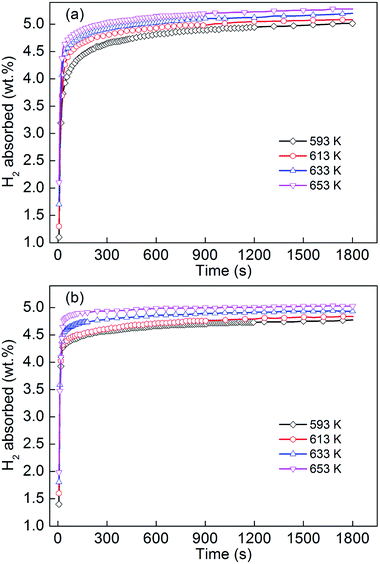 |
| | Fig. 4 Hydrogen absorption kinetic curves of the as-milled alloys at different temperatures: (a) YMg11Ni, (b) YMg11Ni–5MoS2. | |
At a heating rate of 5 K min−1 in a closed chamber, the temperature programmed desorption curve of the as-milled YMg11Ni and YMg11Ni–5MoS2 alloys, which are hydrogenation saturated at 593 K and 3 MPa, were tested as shown in Fig. 5. As the increased pressure can affect the desorption temperature, equal weights of samples were prepared for comparison to avoid this error. Fig. 5 shows that the initial desorption temperature of the as-milled YMg11Ni alloy is approximately 549.8 K, and the total dehydrogenation capacity is 5.286 wt% H2 by 696 K. The addition of MoS2 can reduce the initial desorption temperature to approximately 525.8 K. It supports the view of Rafi-ud-din et al.39 that adding catalyst can affect the MgH2 in initial desorption temperature. The improved desorption behavior, such as the decreased initial dehydrogenation temperature of the alloy, caused by adding MoS2 might be ascribed to the weakened Mg–H bond that is caused by the electronic exchange reaction between the catalyst and MgH2, and the similar results have been demonstrated in MgH2 coated by multi-valence Ti.57
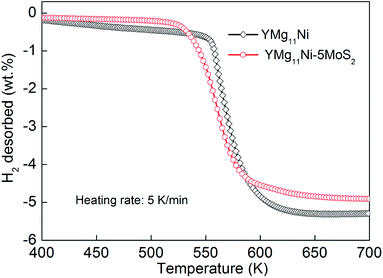 |
| | Fig. 5 Temperature programmed desorption curve of the as-milled (20 h) YMg11Ni and YMg11Ni–5MoS2 alloys hydrogenated at a heating rate of 5 K min−1. | |
To examine the effect of adding MoS2 on the as-milled YMg11Ni alloy in hydrogen desorption dynamics, isothermal dehydrogenation measurements of the YMg11Ni and YMg11Ni–5MoS2 alloys were conducted at different temperatures, as depicted in Fig. 6. The different temperatures for the isothermal dehydrogenation curves are 593, 613, 633, and 653 K. The temperature variation incurs a significant influence on dehydrogenation dynamics. The increase in temperature dramatically enhances the hydrogen desorption rate of alloys. Fig. 6 shows that the time required by desorbing 3 wt% H2 at 593, 613, 633, and 653 K are 1106, 456, 363, and 180 s, respectively, for the YMg11Ni alloy, and 507, 208, 125, and 86 s for the YMg11Ni–5MoS2 alloy. YMg11Ni alloy shows better isothermal desorption dynamics than the no-MoS2-added YMg11Ni alloy. Thus, MoS2 is beneficial for the improvement of the dehydrogenation dynamics of YMg11Ni alloy.
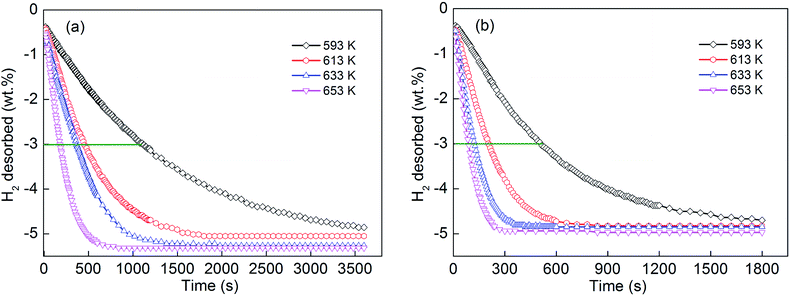 |
| | Fig. 6 Hydrogen desorption kinetic curves of the as-milled (20 h) alloys at different temperatures: (a) YMg11Ni, (b) YMg11Ni–5MoS2. | |
Dehydrogenation activation energy
Adding MoS2 generates a positive contribution to the hydrogen desorption rate of YMg11Ni alloy. To explore the mechanism of this contribution, Arrhenius and Kissinger methods were incurred for estimating the dehydrogenation activation energy of YMg11Ni and YMg11Ni–5MoS2 alloys. The dehydrogenation dynamics is assumed to be connected with the energy barrier for MgH2 releasing H2. In general, the total energy barrier that the reaction requires to conquer is signified by activation energy. As for dehydrogenation reaction, the activation energy of which is considered to be related to the whole energy barriers concerning dehydrogenation processes. Therefore, the driving force of a dehydrogenation reaction can be determined by calculating activation energy. The hydrogen desorption reaction is performed through a nucleation and growth processes, which can be simulated by Johnson–Mehle–Avramie (JMA) model and described by the following formula:58| |
ln[−ln(1 − α)] = η![[thin space (1/6-em)]](https://www.rsc.org/images/entities/char_2009.gif) ln ln![[thin space (1/6-em)]](https://www.rsc.org/images/entities/char_2009.gif) k + η k + η![[thin space (1/6-em)]](https://www.rsc.org/images/entities/char_2009.gif) ln ln![[thin space (1/6-em)]](https://www.rsc.org/images/entities/char_2009.gif) t t
| (2) |
where α stands for the phase fraction transformed at time t, η stands for the Avrami exponent, and k stands for an effective dynamic parameter. The JMA graphs of ln[−ln(1 − α)] versus ln![[thin space (1/6-em)]](https://www.rsc.org/images/entities/char_2009.gif) t at 593, 613, 633, and 653 K can be constructed using the logarithmic transformation of eqn (2), as illustrated in Fig. 7. The JMA plots are nearly linear, implying that the dehydriding reaction of alloys includes instantaneous nucleation and interface-controlled three-dimensional growth process.59 Thus, the η and η
t at 593, 613, 633, and 653 K can be constructed using the logarithmic transformation of eqn (2), as illustrated in Fig. 7. The JMA plots are nearly linear, implying that the dehydriding reaction of alloys includes instantaneous nucleation and interface-controlled three-dimensional growth process.59 Thus, the η and η![[thin space (1/6-em)]](https://www.rsc.org/images/entities/char_2009.gif) ln
ln![[thin space (1/6-em)]](https://www.rsc.org/images/entities/char_2009.gif) k values at different temperatures can be derived from the slope and intercept of the JMA plots, from which the rate constant (k) could be calculated expediently. According to the Arrhenius equation, the activation energy Ea(de) for the dehydrogenation process can be computed as follows:60
k values at different temperatures can be derived from the slope and intercept of the JMA plots, from which the rate constant (k) could be calculated expediently. According to the Arrhenius equation, the activation energy Ea(de) for the dehydrogenation process can be computed as follows:60| |
k = A![[thin space (1/6-em)]](https://www.rsc.org/images/entities/char_2009.gif) exp[−Ea(de)/RT] exp[−Ea(de)/RT]
| (3) |
where k stands for rate constant that has been defined previously, A stands for a temperature-independent coefficient, R stands for the universal gas constant, and T stands for the absolute temperature. The Arrhenius plots of ln![[thin space (1/6-em)]](https://www.rsc.org/images/entities/char_2009.gif) k versus 1/T for the dehydrogenation dynamics of the alloys are described in Fig. 7. Therefore, the activation energy Ea(de) can be derived from the slopes of the Arrhenius plots. The Ea(de) values of the as-milled YMg11Ni and YMg11Ni–5MoS2 alloys are 98.01 and 85.32 kJ mol−1, respectively. The reduction of 12.7 kJ mol−1 occurs in the activation energy, and the similar result has been obtained in CeH2.73–MgH2–Ni composites, which displays about 41.4 kJ mol−1 reduction.61 This is thought to be the result of the high-density interfacial energy between Mg phase and MoS2 phase in the YMg11Ni alloy embedded by MoS2 nanoparticles, which is beneficial for cutting down the distance for H atoms diffusing through the alloys and improving the kinetics. In some other RE–Mg–Ni system alloys, the decrease of activation energy caused by high-density interface required for effective catalysis has been found as well.57,62–64
k versus 1/T for the dehydrogenation dynamics of the alloys are described in Fig. 7. Therefore, the activation energy Ea(de) can be derived from the slopes of the Arrhenius plots. The Ea(de) values of the as-milled YMg11Ni and YMg11Ni–5MoS2 alloys are 98.01 and 85.32 kJ mol−1, respectively. The reduction of 12.7 kJ mol−1 occurs in the activation energy, and the similar result has been obtained in CeH2.73–MgH2–Ni composites, which displays about 41.4 kJ mol−1 reduction.61 This is thought to be the result of the high-density interfacial energy between Mg phase and MoS2 phase in the YMg11Ni alloy embedded by MoS2 nanoparticles, which is beneficial for cutting down the distance for H atoms diffusing through the alloys and improving the kinetics. In some other RE–Mg–Ni system alloys, the decrease of activation energy caused by high-density interface required for effective catalysis has been found as well.57,62–64
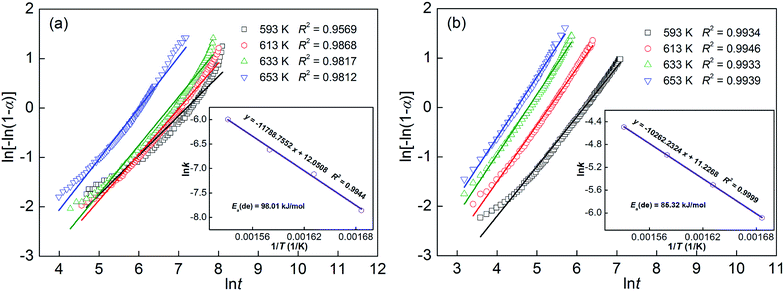 |
| | Fig. 7 JMA graphs and Arrhenius plots of the as-milled (20 h) alloys: (a) YMg11Ni, (b) YMg11Ni–5MoS2. | |
Simultaneously, the hydrogen desorption activation energy is also calculated in Kissinger method for comparison with the following equation:65
| | |
d[ln(β/TP/TP)]/d(1/TP) = −Ek(de)/R
| (4) |
where
β stands for the heating rate,
Tp stands for the absolute temperature at which the DSC curve reaches the top desorption rate,
Ek(de) stands for activation energy, and
R stands for the ideal gas constant. The DSC measurement is indispensable in the Kissinger method, thus the non-isothermal dehydrogenation reactions of as-milled YMg
11Ni and YMg
11Ni–5MoS
2 alloys that hydrogenated at 593 K and 3 MPa were measured by DSC with heating rates at 5, 10, 15, and 20 K min
−1, respectively. Results are presented in
Fig. 8. During the hydrogenation process, there exists a clear endothermic peak, which is attributed to the dehydrogenation of MgH
2 phase.
66 The endothermic peaks of Mg
2NiH
4/Mg
2Ni and YH
3/YH
2 phase transition can not be verified, which is most likely due to low content of Mg
2NiH
4 and YH
3 in the sample, as well as their endothermic peaks cover the same temperature range. Moreover, the shapes of all endothermic peaks are similar, which indicates that the reaction processes of hydrogenation for all alloys are similar. In addition, the endothermic peak of MoS
2-added alloy drifts to low temperature compared with the no-MoS
2-added alloy at each heating rate, which reflects the improvement of adding MoS
2 in the reaction rate of dehydrogenation. Based on the data of
Fig. 8, the graphs of ln(
β/
TP/
TP)
versus 1/
TP can be constructed using the logarithmic transformation of
eqn (4), which is termed as Kissinger plots as inserted in
Fig. 8. The Kissinger plots are nearly linear, from the slopes of which the activation energy
Ek(de) can be easily calculated. The
Ek(de) values of as-cast YMg
11Ni and as-milled YMg
11Ni and YMg
11Ni–5MoS
2 alloys are 125.70, 91.53 and 77.58 kJ mol
−1, respectively. Considering the above-mentioned results, ball milling can decrease the dehydrogenation activation energy and the addition of MoS
2 can result in a further decrease, which is assumed to be the real driving force of the improvement of dehydrogenation dynamics. Sun
et al.67 considered that the activation energy (
Ea) of dehydrogenation is an important indicator in which the dehydrogenation performances and catalytic effects of catalysts can be evaluated. From the reduction of activation energy
Ea, we can deduce the reduction of energy barriers for systems releasing hydrogen.
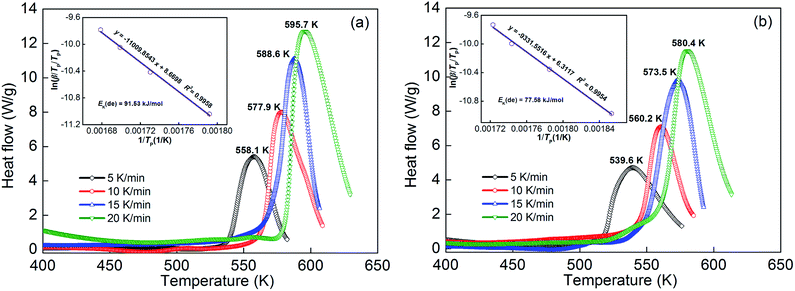 |
| | Fig. 8 DSC curves and Kissinger plots of the as-milled (20 h) alloys at various heating rates: (a) YMg11Ni, (b) YMg11Ni–5MoS2. | |
Conclusions
(1) The addition of MoS2 can reduce the as-milled YMg11Ni alloy in thermodynamic parameters (ΔH and ΔS). Furthermore, it weakens the stability of the alloy hydride. As can be observed from the experiment, the initial dehydrogenation temperature of the YMg11Ni hydrogenated is declined from 549.8 K to 525.8 K by adding MoS2.
(2) The addition of MoS2 significantly enhances the alloy in the hydrogen absorbing and desorbing rates, which are connected with the diminished particle sizes and the declined dehydrogenation activation energy generated by adding MoS2.
(3) The dehydrogenation activation energies of the as-milled YMg11Ni and YMg11Ni–5MoS2 alloys have been evaluated in both Arrhenius and Kissinger methods. Results revealed that the addition of MoS2 can decrease the alloys in dehydrogenation activation energy, which is considered as the real driver for improving the dehydrogenation dynamics of the alloys by adding MoS2.
Acknowledgements
This work is financially supported by the National Natural Science Foundations of China (51371094 and 51471054) and Natural Science Foundation of Inner Mongolia, China (2015MS0558).
References
- D. Mori and K. Hirose, Int. J. Hydrogen Energy, 2009, 34, 4569–4574 CrossRef CAS.
- R. Lan, J. T. S. Irvine and S. Tao, Int. J. Hydrogen Energy, 2012, 37, 1482–1494 CrossRef CAS.
- L. Zhou, Renewable Sustainable Energy Rev., 2005, 9, 395–408 CrossRef CAS.
- V. Bhat, A. Rougier, L. Aymard, G. A. Nazri and J. M. Tarascon, Int. J. Hydrogen Energy, 2007, 32, 4900–4906 CrossRef CAS.
- M. Anik, F. Karanfil and N. Küçükdeveci, Int. J. Hydrogen Energy, 2012, 37, 299–308 CrossRef CAS.
- T. Umegaki, J. M. Yan, X. B. Zhang, H. Shioyama, N. Kuriyama and Q. Xu, Int. J. Hydrogen Energy, 2009, 34, 2303–2311 CrossRef CAS.
- L. Z. Ouyang, J. J. Tang, Y. J. Zhao, H. Wang, X. D. Yao, J. W. Liu, J. Zou and M. Zhu, Sci. Rep., 2015, 5, 10776 CrossRef CAS PubMed.
- L. Z. Ouyang, Z. J. Cao, H. Wang, R. Z. Hu and M. Zhu, J. Alloys Compd., 2017, 691, 422–435 CrossRef CAS.
- L. Z. Ouyang, Z. J. Cao, H. Wang, J. W. Liu, D. L. Sun, Q. A. Zhang and M. Zhu, J. Alloys Compd., 2014, 586, 113–117 CrossRef CAS.
- L. Z. Ouyang, Z. J. Cao, H. Wang, J. W. Liu, D. L. Sun, Q. A. Zhang and M. Zhu, Int. J. Hydrogen Energy, 2013, 38, 8881–8887 CrossRef CAS.
- A. Teresiak, A. Gebert, M. Savyak, M. Uhlemann, C. Mickel and N. Mattern, J. Alloys Compd., 2005, 398, 156–164 CrossRef CAS.
- M. Zhu, H. Wang, L. Z. Ouyang and M. Q. Zeng, Int. J. Hydrogen Energy, 2006, 31, 251–257 CrossRef CAS.
- T. Sadhasivam, M. S. L. Hudso, S. K. Pandey, A. Bhatnagar, M. K. Singh, K. Gurunathan and O. N. Srivastava, Int. J. Hydrogen Energy, 2013, 38, 7353–7362 CrossRef CAS.
- S. Kalinichenka, L. Röntzsch, T. Riedl, T. Gemming, T. Weißgärber and B. Kieback, Int. J. Hydrogen Energy, 2011, 36, 1592–1600 CrossRef CAS.
- L. H. Kumar, B. Viswanathan and S. S. Murthy, J. Alloys Compd., 2008, 461, 72–76 CrossRef CAS.
- S. Cheung, W. Q. Deng, A. C. T. Duin and W. A. Goddard, J. Phys. Chem. A, 2005, 109, 851–859 CrossRef CAS PubMed.
- J. Huot, G. Liang, S. Boily, A. V. Neste and R. Schulz, J. Alloys Compd., 1999, 293–295, 495–500 CrossRef CAS.
- J. X. Zou, X. Q. Zeng, Y. J. Ying, X. Chen, H. Guo, S. Zhou and W. J. Ding, Int. J. Hydrogen Energy, 2013, 38, 2337–2346 CrossRef CAS.
- M. Jorge Jr, E. Prokofiev, G. F. Lima, E. Rauch, M. Veron, W. J. Botta, M. Kawasaki and T. G. Langdon, Int. J. Hydrogen Energy, 2013, 38, 8306–8312 CrossRef.
- M. Calizzi, D. Chericoni, L. H. Jepsen, T. R. Jensen and L. Pasquini, Int. J. Hydrogen Energy, 2016, 41, 14447–14454 CrossRef CAS.
- H. Gu, Y. Zhu and L. Li, Int. J. Hydrogen Energy, 2008, 33, 2970–2974 CrossRef CAS.
- D. Pukazhselvan, G. Capurso, A. Maddalena, S. L. Russo and D. P. Fagg, Int. J. Hydrogen Energy, 2014, 39, 20045–20053 CrossRef CAS.
- Y. H. Zhang, X. Y. Han, B. W. Li, H. P. Ren, X. P. Dong and X. L. Wang, Mater. Charact., 2008, 59, 390–396 CrossRef CAS.
- S. Kalinichenka, L. Röntzsch, T. Riedl, T. Weißgärber and B. Kieback, Int. J. Hydrogen Energy, 2011, 36, 10808–10815 CrossRef CAS.
- Y. H. Zhang, Rafi-ud-din, B. W. Li, H. P. Ren, S. H. Guo and X. L. Wang, Mater. Charact., 2010, 61, 305–311 CrossRef CAS.
- A. A. Poletaev, R. V. Denys, J. P. Maehlen, J. K. Solberg, B. P. Tarasov and V. A. Yartys, Int. J. Hydrogen Energy, 2012, 37, 3548–3557 CrossRef CAS.
- K. J. Jeon, H. R. Moon, A. M. Ruminski, B. Jiang, C. Kisielowski and R. Bardhan, Nat. Mater., 2011, 10, 286–290 CrossRef CAS PubMed.
- M. Tanniru and F. Ebrahimi, Int. J. Hydrogen Energy, 2009, 34, 7714–7723 CrossRef CAS.
- S. Long, J. X. Zou, X. Chen, X. Q. Zeng and W. J. Ding, J. Alloys Compd., 2014, 615, S684–S688 CrossRef CAS.
- Rafi-ud-din, X. H. Qu, P. Li, Z. Lin, A. Mashkoor, I. M. Zubair, M. Yasir Rafique and F. M. Hassan, RSC Adv., 2012, 2, 4891–4903 RSC.
- N. Juahir, N. S. Mustafa, A. M. Sinin and M. Ismail, RSC Adv., 2015, 5, 60983–60989 RSC.
- H. Z. Liu, C. Wu, H. Zhou, T. Chen, Y. G. Liu, X. H. Wang, Z. H. Dong, H. W. Ge, S. Q. Li and M. Yan, RSC Adv., 2015, 5, 22091–22096 RSC.
- X. J. Hou, R. Hu, T. B. Zhang, H. C. Kou, W. J. Song and J. S. Li, Int. J. Hydrogen Energy, 2014, 39, 19672–19681 CrossRef CAS.
- E. Malka, T. Czujko and J. Bystrzycki, Int. J. Hydrogen Energy, 2010, 35, 1706–1712 CrossRef.
- F. P. Luo, H. Wang, L. Z. Ouyang, M. Q. Zeng, J. W. Liu and M. Zhu, Int. J. Hydrogen Energy, 2013, 38, 10912–10918 CrossRef CAS.
- S. Agarwal, A. Jain, P. Jain, M. Jangir, D. Vyas and I. P. Jain, J. Alloys Compd., 2015, 645, S518–S523 CrossRef CAS.
- M. Pozzo and D. Alfe, Int. J. Hydrogen Energy, 2009, 34, 1922–1930 CrossRef CAS.
- T. Liu, T. W. Zhang, X. Z. Zhang and X. G. Li, Int. J. Hydrogen Energy, 2011, 36, 3515–3520 CrossRef CAS.
- Rafi-ud-din, H. Qu, G. H. Zahid, Z. Asghar, M. Shahzad, M. Iqbal and E. Ahmad, J. Alloys Compd., 2014, 604, 317–324 CrossRef CAS.
- M. Daryani, A. Simchi, M. Sadati, H. M. Hosseini, H. Targholizadeh and M. Khakbiz, Int. J. Hydrogen Energy, 2014, 39, 21007–21014 CrossRef CAS.
- Y. H. Zhang, Z. M. Yuan, W. G. Bu, F. Hu, Y. Cai and D. L. Zhao, Acta Metall. Sin., 2016, 29, 577–586 CrossRef CAS.
- Y. H. Zhang, B. W. Li, H. P. Ren, T. Yang, S. H. Guo, Y. Qi and D. L. Zhao, J. Mater. Sci. Technol., 2016, 32, 218–225 Search PubMed.
- Y. H. Zhang, Z. M. Yuan, T. Yang, D. C. Feng, Y. Cai and D. L. Zhao, J. Alloys Compd., 2016, 688, 585–593 CrossRef CAS.
- Y. H. Jia, S. M. Han, W. Zhang, X. Zhao, P. F. Sun, Y. Q. Liu, H. Shi and J. S. Wang, Int. J. Hydrogen Energy, 2013, 38, 2352–2356 CrossRef CAS.
- D. Liang, S. M. Han, J. S. Wang, W. Zhang, X. Zhao and Z. Y. Zhao, J. Solid State Chem., 2014, 211, 21–24 CrossRef CAS.
- T. Yang, Z. M. Yuan, W. G. Bu, Z. C. Jia, Y. Qi and Y. H. Zhang, Int. J. Hydrogen Energy, 2016, 41, 2689–2699 CrossRef CAS.
- Q. Luo, Q. F. Gu, J. Y. Zhang, S. L. Chen, K. C. Chou and Q. Li, Sci. Rep., 2015, 5, 15385 CrossRef CAS PubMed.
- J. G. Yuan, N. Xing and Y. Wu, Int. J. Hydrogen Energy, 2017, 42, 6118–6126 CrossRef CAS.
- H. Falahati and P. J. B. Dominik, Int. J. Hydrogen Energy, 2013, 38, 8838–8851 CrossRef CAS.
- L. Z. Ouyang, Z. J. Cao, H. Wang, J. W. Liu, D. L. Sun, Q. A. Zhang and M. Zhu, Int. J. Hydrogen Energy, 2013, 38, 8881–8887 CrossRef CAS.
- M. Paskevicius, D. A. Sheppard and C. E. Buckley, J. Am. Chem. Soc., 2010, 13, 25077–25083 Search PubMed.
- P. Jain, Int. J. Hydrogen Energy, 2009, 34, 7368–7378 CrossRef.
- H. P. Chen, H. Yu, Q. Q. Zhang, B. G. Liu, P. Liu, X. P. Zhou, Z. Y. Han and S. X. Zhou, J. Power Sources, 2016, 322, 179–186 CrossRef CAS.
- Y. H. Jia, S. M. Han, W. Zhang, X. Zhao, P. F. Sun, Y. Q. Liu, H. Shi and J. S. Wang, Int. J. Hydrogen Energy, 2013, 38, 2352–2356 CrossRef CAS.
- G. Barkhordarian, T. Klassen and R. Bormann, J. Alloys Compd., 2004, 364, 242–246 CrossRef CAS.
- E. A. Lass, Int. J. Hydrogen Energy, 2011, 36, 10787–10796 CrossRef CAS.
- J. Cui, H. Wang, J. W. Liu, L. Z. Ouyang, Q. G. Zhang, D. L. Sun, X. D. Yao and M. Zhu, J. Mater. Chem. A, 2013, 1, 5603–5611 CAS.
- M. Pourabdoli, S. Raygan, H. Abdizadeh and D. Uner, Int. J. Hydrogen Energy, 2013, 38, 11910–11919 CrossRef CAS.
- T. Czujko, R. A. Varin, C. Chiu and Z. Wronski, J. Alloys Compd., 2006, 414, 240–247 CrossRef CAS.
- T. Kimura, H. Miyaoka, T. Ichikawa and Y. Kojima, Int. J. Hydrogen Energy, 2013, 38, 13728–13733 CrossRef CAS.
- L. Z. Ouyang, X. S. Yang, M. Zhu, J. W. Liu, H. W. Dong, D. L. Sun, J. Zou and X. D. Yao, J. Phys. Chem. C, 2014, 118, 7808–7820 CAS.
- L. Z. Ouyang, F. X. Qin and M. Zhu, Scr. Mater., 2006, 55, 1075–1078 CrossRef CAS.
- L. Z. Ouyang, F. X. Qin and M. Zhu, Scr. Mater., 2009, 61, 339–342 CrossRef CAS.
- L. Z. Ouyang, S. Y. Ye, H. W. Dong and M. Zhu, Appl. Phys. Lett., 2007, 90, 021917 CrossRef.
- H. E. Kissinger, Anal. Chem., 1957, 29, 1702–1706 CrossRef CAS.
- H. J. Lin, C. Zhang, H. Wang, L. Z. Ouyang, Y. F. Zhu, L. Q. Li, W. H. Wang and M. Zhu, J. Alloys Compd., 2016, 685, 272–277 CrossRef CAS.
- M. Q. Fan, S. S. Liu, Y. Zhang, J. Zhang, L. X. Sun and F. Xu, Energy, 2010, 35, 3417–3421 CrossRef CAS.
|
| This journal is © The Royal Society of Chemistry 2017 |
Click here to see how this site uses Cookies. View our privacy policy here.  Open Access Article
 *ab,
Meng Jiab,
Zeming Yuanab,
Wengang Bub,
Yan Qib and
Shihai Guob
![[thin space (1/6-em)]](https://www.rsc.org/images/entities/char_2009.gif) :
:![[thin space (1/6-em)]](https://www.rsc.org/images/entities/char_2009.gif) 1, in which the balls and powders were placed into Cr–Ni stainless steel vials and ran at 135 rpm for 20 h. During the whole process, the mill had a 10 min rest after every 60 min milling to prevent overheating.
1, in which the balls and powders were placed into Cr–Ni stainless steel vials and ran at 135 rpm for 20 h. During the whole process, the mill had a 10 min rest after every 60 min milling to prevent overheating.


![[thin space (1/6-em)]](https://www.rsc.org/images/entities/char_2009.gif) ln
ln![[thin space (1/6-em)]](https://www.rsc.org/images/entities/char_2009.gif) k + η
k + η![[thin space (1/6-em)]](https://www.rsc.org/images/entities/char_2009.gif) ln
ln![[thin space (1/6-em)]](https://www.rsc.org/images/entities/char_2009.gif) t
t
![[thin space (1/6-em)]](https://www.rsc.org/images/entities/char_2009.gif) t at 593, 613, 633, and 653 K can be constructed using the logarithmic transformation of eqn (2), as illustrated in Fig. 7. The JMA plots are nearly linear, implying that the dehydriding reaction of alloys includes instantaneous nucleation and interface-controlled three-dimensional growth process.59 Thus, the η and η
t at 593, 613, 633, and 653 K can be constructed using the logarithmic transformation of eqn (2), as illustrated in Fig. 7. The JMA plots are nearly linear, implying that the dehydriding reaction of alloys includes instantaneous nucleation and interface-controlled three-dimensional growth process.59 Thus, the η and η![[thin space (1/6-em)]](https://www.rsc.org/images/entities/char_2009.gif) ln
ln![[thin space (1/6-em)]](https://www.rsc.org/images/entities/char_2009.gif) k values at different temperatures can be derived from the slope and intercept of the JMA plots, from which the rate constant (k) could be calculated expediently. According to the Arrhenius equation, the activation energy Ea(de) for the dehydrogenation process can be computed as follows:60
k values at different temperatures can be derived from the slope and intercept of the JMA plots, from which the rate constant (k) could be calculated expediently. According to the Arrhenius equation, the activation energy Ea(de) for the dehydrogenation process can be computed as follows:60![[thin space (1/6-em)]](https://www.rsc.org/images/entities/char_2009.gif) exp[−Ea(de)/RT]
exp[−Ea(de)/RT]
![[thin space (1/6-em)]](https://www.rsc.org/images/entities/char_2009.gif) k versus 1/T for the dehydrogenation dynamics of the alloys are described in Fig. 7. Therefore, the activation energy Ea(de) can be derived from the slopes of the Arrhenius plots. The Ea(de) values of the as-milled YMg11Ni and YMg11Ni–5MoS2 alloys are 98.01 and 85.32 kJ mol−1, respectively. The reduction of 12.7 kJ mol−1 occurs in the activation energy, and the similar result has been obtained in CeH2.73–MgH2–Ni composites, which displays about 41.4 kJ mol−1 reduction.61 This is thought to be the result of the high-density interfacial energy between Mg phase and MoS2 phase in the YMg11Ni alloy embedded by MoS2 nanoparticles, which is beneficial for cutting down the distance for H atoms diffusing through the alloys and improving the kinetics. In some other RE–Mg–Ni system alloys, the decrease of activation energy caused by high-density interface required for effective catalysis has been found as well.57,62–64
k versus 1/T for the dehydrogenation dynamics of the alloys are described in Fig. 7. Therefore, the activation energy Ea(de) can be derived from the slopes of the Arrhenius plots. The Ea(de) values of the as-milled YMg11Ni and YMg11Ni–5MoS2 alloys are 98.01 and 85.32 kJ mol−1, respectively. The reduction of 12.7 kJ mol−1 occurs in the activation energy, and the similar result has been obtained in CeH2.73–MgH2–Ni composites, which displays about 41.4 kJ mol−1 reduction.61 This is thought to be the result of the high-density interfacial energy between Mg phase and MoS2 phase in the YMg11Ni alloy embedded by MoS2 nanoparticles, which is beneficial for cutting down the distance for H atoms diffusing through the alloys and improving the kinetics. In some other RE–Mg–Ni system alloys, the decrease of activation energy caused by high-density interface required for effective catalysis has been found as well.57,62–64


