 Open Access Article
Flower-shaped TiO2 clusters for highly efficient photocatalysis†
Xiao-Hui Ning,
Qing-Ling Meng,
Yong-Lu Han,
Dong-Yang Zhou,
Li Li,
Liang Cao,
Zhan-Kun Weng,
Ran Ding * and
Zuo-Bin Wang*
International Research Centre for Nano Handling and Manufacturing of China, Changchun University of Science and Technology, Changchun, China 130022. E-mail: dingran@cust.edu.cn; WangZ@cust.edu.cn
First published on 12th July 2017
Abstract
Titanium dioxide (TiO2) is one of the most widely used semiconductors, with a variety of applications such as water purification, photovoltaic cells, cancer treatment, gas sensors and photocatalysis. Flower-shaped TiO2 clusters can be obtained on patterned fluorine-doped tin oxide (FTO) substrates with one- and two-dimensional (1D and 2D) grating patterns through a two-step process combining laser interference ablation technology with a hydrothermal method. The patterned TiO2 clusters exhibit enhanced photocatalytic degradation of rhodamine B (RhB) and good durability. This work provides a facile route toward the applications of TiO2 clusters in solar-driven clean energy and environmental technologies.
Titanium dioxide (TiO2), as one of the most promising wide bandgap semiconductors, has aroused increasing interest due to its unique physical and chemical properties in many prospective applications such as photocatalytic degradation, biological sensors, water splitting cells and dye-sensitized solar cells.1–7 Nanostructured TiO2 materials with a high ratio of surface to volume and that can facilitate a fast rate of surface reactions have become a topic of intensive study in these few years. The properties and operational performance of nanostructured TiO2 materials significantly rely on their crystal phase, crystallinity, surface area, porosity, morphology and architecture. In this regard, orientated single-crystalline TiO2 nanowire arrays that possess large surface areas and provide a convenient way for transferring photo-generated carriers to the reaction surfaces, are promising candidates for a wide range of applications.
Recently, there have been numerous efforts devoted to the synthesis of TiO2 nanowire arrays including sol–gel, physical vapor deposition, hydrothermal reaction, AAO template and electrochemical anodization methods.8–16 Among these strategies, the hydrothermal synthetic route is the most convenient method that can be controlled easily by changing the heating-up temperature, reaction time and the concentration of precursor solution. With the advantages of the hydrothermal method, pure, dispersed and crystalline TiO2 nanowire arrays can be realized. Liu et al. developed a facile hydrothermal method to grow oriented, single-crystalline rutile TiO2 nanowire films on a transparent conductive fluorine-doped tin oxide (FTO) substrate.17 Since then, the hydrothermal method for orientated TiO2 nanowire arrays has been extended to various research groups. In order to achieve great photocatalytic activity, anatase phase TiO2 arrays are needed which have been successfully synthesized by Zhao et al. using sulphuric acid (H2SO4) as both a phase-inducer for the formation of the anatase phase and a capping agent to promote the oriented growth.18 However, the photocatalytic efficiency of the orientated TiO2 nanowire arrays is still quite low which renders them impractical for applications.19
In this work, a simple two-step process combining laser interference ablation technology and hydrothermal method is employed to further enhance the photocatalytic activity. One- and two-dimensional (1D and 2D) grating patterns are fabricated on FTO substrates using laser interference ablation. Then 1D and 2D grating patterned TiO2 nanowire arrays are obtained on the patterned FTO substrates through hydrothermal reaction. The TiO2 nanowire arrays are shaped like flower clusters, which exhibit enhanced photocatalytic degradation of rhodamine B (RhB). The improved photocatalytic efficiency can be ascribed to the higher ratio of surface to volume and the increased proportion of exposed high reactive {001} facets on the surface of TiO2 clusters. The results demonstrate the great potential of the TiO2 clusters for use in a wide variety of solar-driven clean energy and environmental technologies.
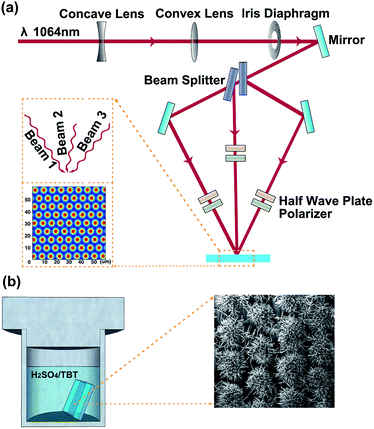
Based on the simple two-step process, a high-power pulsed laser is firstly used as the coherent light source for the interference ablation to fabricate 1D and 2D grating patterns on FTO substrates. The experimental setup for three-beam interference ablation has been shown in Fig. 1a. The primary laser beam is split into three coherent light beams 1, 2 and 3, and the interference beams can form a 2D grating pattern on the FTO substrate.20 The period (d) of the grating pattern can be determined by the relationship d = λ/2![[thin space (1/6-em)]](https://www.rsc.org/images/entities/char_2009.gif) sin(θ), where λ is the wavelength of the light and the incident angle θ is the half angle between the incident beams. The inset of Fig. 1a (similar as Fig. S1a†) shows the simulated laser intensity distribution in the laser interference region. Regions of highest laser intensity are shown in bright red while those with the lowest intensity are shown in dark blue. In Fig. S1a,† it is a regular triangle distribution of holes in an interference pattern, and the distance of two holes in the pattern is 4d/3. During laser interference patterning, the high-energy nanosecond laser selectively ablates the FTO substrate surface. The FTO materials located at the bright red region of the interference pattern is removed, while the materials at the dark blue region remain unchanged, forming arrays of holes on the FTO substrate which are corresponding to the 2D grating patterns.21,22 Experiments show that the pulse energy must exceed a certain threshold value to realize the removal of the FTO materials at the bright interference regions. In case of the two-beam interference ablation, the two interference beams (beams 1 and 2) are in the same incident angles of θ. Fig. S1b† shows the schematic diagram and simulated laser intensity distribution of the two-beam laser interference ablation. The two-beam interference pattern shows equi-spaced straight fringes, and the period is also determined by the relationship between the laser wavelength λ and the incident angle θ (d = λ/2
sin(θ), where λ is the wavelength of the light and the incident angle θ is the half angle between the incident beams. The inset of Fig. 1a (similar as Fig. S1a†) shows the simulated laser intensity distribution in the laser interference region. Regions of highest laser intensity are shown in bright red while those with the lowest intensity are shown in dark blue. In Fig. S1a,† it is a regular triangle distribution of holes in an interference pattern, and the distance of two holes in the pattern is 4d/3. During laser interference patterning, the high-energy nanosecond laser selectively ablates the FTO substrate surface. The FTO materials located at the bright red region of the interference pattern is removed, while the materials at the dark blue region remain unchanged, forming arrays of holes on the FTO substrate which are corresponding to the 2D grating patterns.21,22 Experiments show that the pulse energy must exceed a certain threshold value to realize the removal of the FTO materials at the bright interference regions. In case of the two-beam interference ablation, the two interference beams (beams 1 and 2) are in the same incident angles of θ. Fig. S1b† shows the schematic diagram and simulated laser intensity distribution of the two-beam laser interference ablation. The two-beam interference pattern shows equi-spaced straight fringes, and the period is also determined by the relationship between the laser wavelength λ and the incident angle θ (d = λ/2![[thin space (1/6-em)]](https://www.rsc.org/images/entities/char_2009.gif) sin(θ)). And the pulse laser will remove the FTO materials located at the bright red fringes. The remained FTO generates a pattern of lines which corresponds to the 1D grating pattern. The scanning electron microscope (SEM) images of the 1D and 2D grating patterned FTO substrates with the grating period of about 7 μm are shown in Fig. S2† after direct laser interference ablation.
sin(θ)). And the pulse laser will remove the FTO materials located at the bright red fringes. The remained FTO generates a pattern of lines which corresponds to the 1D grating pattern. The scanning electron microscope (SEM) images of the 1D and 2D grating patterned FTO substrates with the grating period of about 7 μm are shown in Fig. S2† after direct laser interference ablation.
Then the 1D and 2D grating patterned FTO substrates are used in the hydrothermal reaction for the patterned TiO2 nanowire arrays, as illustrated in Fig. 1b.23 The materials and reagents used for the synthesis are described in the ESI.† The top view SEM images at different magnifications (Fig. 2a and b) reveal that uniform TiO2 nanowire arrays are formed in a pattern of lines which are consistent with the 1D grating patterned FTO substrate. And the TiO2 nanowire arrays are shaped like flower clusters, observed from the cross-sectional SEM image in Fig. 2c. Thus, the obtained TiO2 nanowire arrays are described as 1D grating patterned TiO2 clusters (1D TiO2 clusters for short). The nanowires are nearly perpendicular to the FTO substrate with an average diameter of 80 nm and length of 2 μm. The X-ray diffraction (XRD) pattern shows significant (101) and (004) diffraction peaks, which match well with the crystalline anatase phase of TiO2. The anatase phase TiO2 nanowire arrays are synthesized according to the work reported by Zhao et al., where H2SO4 was used as a phase-inducer for formation of the anatase phase.25 In order to further confirm the function of H2SO4 in the formation of the anatase phase, they have performed the same hydrothermal reactions in which H2SO4 was replaced by hydrochloric acid (HCl) or nitric acid (HNO3). The XRD patterns of resulting TiO2 crystals showed only the rutile phase in final TiO2 materials, indicating that the crystal phase of TiO2 in hydrothermal treatment can be determined by the controlling solvent composition and additives.
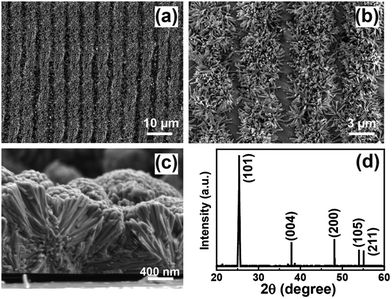 | ||
| Fig. 2 (a) and (b) Top-view and (c) cross-sectional SEM images of 1D TiO2 clusters. (d) XRD pattern of 1D TiO2 clusters on the FTO substrate. | ||
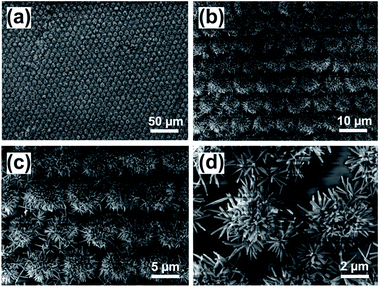
After that, 2D grating patterned TiO2 clusters (2D TiO2 clusters) also can be achieved according to this two-step process. Fig. 3 shows the SEM images of 2D TiO2 clusters with different magnifications after the hydrothermal reaction. It can be observed from Fig. 3a–c that the TiO2 nanowire arrays uniformly grow on the 2D grating patterned FTO substrate and fill in the spaces with remained FTO. And the high-magnification SEM image (Fig. 3d) exhibits the fabricated TiO2 nanowires form in arrays of dots and possess aggregated flower-shaped TiO2 clusters, which are coincident with the 2D grating patterns. The unpatterned TiO2 nanowire arrays are also fabricated on unpatterned FTO substrate through only hydrothermal reaction which are shown in Fig. S3.†
Fig. 4a shows the transmissions of four different substrates, including a bare FTO substrate, unpatterned TiO2 nanowire arrays, 1D and 2D TiO2 clusters. The bare FTO substrate shows nearly 80% transmission. In the case of the unpatterned TiO2 nanowire arrays, the transmission decreases about 20% to 60%. Compared to the unpatterned TiO2 nanowire arrays, the TiO2 clusters in 1D and 2D structures exhibit enhanced transmission up to 65% and 62%, respectively. The more transmission of 1D TiO2 clusters than that of 2D can be ascribed to the different duty cycle of the grating patterns, which is defined as the ratio of the linewidth to the spatial period, L/p, as illustrated in Fig. S4.† The duty cycle is evaluated from both the simulated laser intensity distribution of the laser interference ablation and obtained grating patterned FTO substrates where 1D and 2D grating patterns are in the same period of 7 μm, as shown in Fig. S1 and S2.† 1D grating pattern shows equi-spaced straight fringes with a duty cycle value of almost 50%, whereas the 2D grating pattern forms arrays of holes in which the duty cycle value is less than 50%. This result indicates that there are more spaces on the 2D patterned FTO substrate to grow TiO2 nanowires than that on 1D substrate. Therefore, the 2D TiO2 clusters may absorb more light with lower transmission, which will benefit the photocatalytic activity.
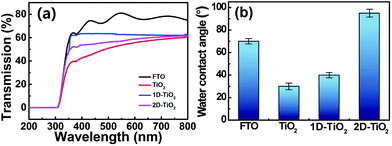 | ||
| Fig. 4 (a) Transmissions of the bare FTO substrate, unpatterned TiO2 nanowire arrays, (b) contact angles of the bare FTO substrate, unpatterned TiO2 nanowire arrays, 1D and 2D TiO2 clusters. | ||
Wettability is also tested for the potential application of self-cleaning coating. Fig. 4b shows the contact angles of the FTO substrate, unpatterned TiO2 nanowire arrays, 1D and 2D TiO2 clusters. The contact angle is about 70° for the bare FTO substrate. After grown with the TiO2 nanowire arrays, the contact angle decreases to 30°. Then, the contact angle gradually increases to 40° and 95° for 1D and 2D TiO2 clusters. The reason for this phenomenon is that the 1D and 2D grating nanostructures trap more air leading to higher contact angles. When the TiO2 nanowire films are exposed to UV light for several minutes, the contact angle decreased to 10° in all cases, indicating that the surface of TiO2 nanowire arrays transferred to be super hydrophilic. All the contact angle optical images are shown in Fig. S5.†
Then we study the photocatalytic property of obtained TiO2 nanowire films. The photocatalytic activity of the TiO2 nanowire arrays is evaluated through the decolorization of RhB spin coating on the sample surface under the UV light of a 150 W high voltage mercury lamp (mercury vapour lamp with the central wavelength of 360 nm) at a 20 cm distance. Furthermore, the P25 TiO2 film is used as a reference for comparison. A 50 mg amount of P25 is dispersed in 100 mL water, and stirred for 5 min. The P25 TiO2 film is formed by drop-casting the mixed solution onto glass substrate with drying at 40 °C for 1 h. Before measurements, the pretreatment is carried out in which the substrate is exposed under the UV light for 30 min to clean the surface of TiO2 nanowire arrays.18,24 It is known that the unavoidable adsorption of molecules (such as O2 and H2O) on the surface of TiO2 when exposed to the atmosphere may make it hard for the RhB to approach the surface of TiO2. Moreover, the photocatalytic degradation of RhB on TiO2 samples is generally accepted via ˙OH radical oxidation. However, the residual organic solvent with hydroxyl radical will result in extensive inhibitions in RhB degradation. Therefore, the pretreatment is essential to eliminate the effects of air molecules and the residual organic solvent on the photocatalytic activity of the TiO2 nanowire arrays.
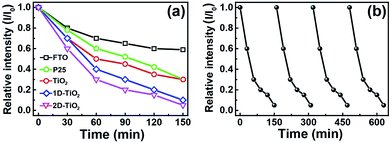
After that, RhB ethanol solution (0.5 g L−1) is spin-coated on the surface of FTO glass, P25 TiO2 film and TiO2 nanowire arrays substrates at 1000 rpm for 60 s. The degradation of RhB is monitored by the absorbance intensity at the maximum peak (520 nm). The degradation efficiency (Eff) is evaluated according to Eff (%) = (1 − I/I0) × 100%, where I0 and I represent the absorbance of the dye before and after irradiation, respectively. Fig. 5a shows the degradation rate (I/I0) of the TiO2 nanowire film in comparison with FTO substrate and P25 TiO2 film at different degradation times, where I is the absorption intensity of RhB at the irradiation time t, and I0 is the initial concentration.18
After irradiation for 150 min, the photocatalytic efficiencies of the FTO substrate, P25 TiO2 film and unpatterned TiO2 nanowire arrays are about 37%, 69% and 70%, respectively. The unpatterned TiO2 nanowire arrays have almost a similar photocatalytic activity to P25 after 150 min. The photocatalytic efficiencies of the 1D and 2D TiO2 clusters are 93% and 98%, respectively, which are significantly higher than that of bare FTO substrate, P25 TiO2 film and unpatterned TiO2 nanowire arrays. FTO contains some degree of degradation because of the semiconductor SnO2. As it is known, the photocatalytic property of anatase TiO2 crystals has significantly relied on the access of high-energy facets such as {001} and {100}. Thus, controlled synthesis of anatase TiO2 with exposed high-energy facets and high surface area is technologically very important. Previous studies have revealed that the high surface energy {001} facet exhibits the most active photocatalytic properties.18,25 In this work, the synthesis of anatase TiO2 nanowires is based on the hydrothermal route reported by Zhao et al., which expose {001} facets on the surface. The additive of acidic solution (H2SO4) is used as both a phase-inducer for formation of the anatase phase and a capping agent to promote oriented growth and formation of the {001} facet.18,25 With TiO2 nanowire arrays, photocatalytic capability is significantly enhanced due to the exposed high reactive {001} facets on TiO2 surface. Furthermore, the 1D and 2D grating patterned TiO2 clusters will increase the ratio of surface to volume which can facilitate a fast rate of surface reactions. Thus, the enhancement in photocatalytic activity of the patterned TiO2 clusters can be ascribed to several aspects including the higher ratio of surface to volume and the increased proportion of exposed high reactive {001} facets on TiO2 surface, which provide a more convenient way for photo-generated carriers to transfer to the reaction surfaces.26,27 This work provides the route for structure induced enhancement of photocatalytic efficiency by designing a desirable structure. Fig. 5b shows the durability of 2D TiO2 clusters for photocatalytic degradation of RhB. After the recycled experiments of photocatalytic degradation, the activity remains unchanged.
In summary, a simple two-step process is developed to synthesize 1D and 2D TiO2 clusters through the laser interference ablation and hydrothermal reaction. The flower-shaped TiO2 clusters display good photocatalytic degradation of dye molecules and durability. The prominent advantages of TiO2 clusters make them promising materials in the applications of solar-driven clean energy and environmental technologies.
Experimental section
Device fabrication by laser interference ablation and hydrothermal reaction
Before the experiment, the FTO substrates were ultrasonically cleaned for 5 min in a mixed solution of acetone, alcohol and deionized water with volume ratios of 1![[thin space (1/6-em)]](https://www.rsc.org/images/entities/char_2009.gif) :
:![[thin space (1/6-em)]](https://www.rsc.org/images/entities/char_2009.gif) 1
1![[thin space (1/6-em)]](https://www.rsc.org/images/entities/char_2009.gif) :
:![[thin space (1/6-em)]](https://www.rsc.org/images/entities/char_2009.gif) 1. The high-power laser was a pulsed Nd:YAG laser with a wavelength of 1064 nm. The laser power can be controlled by the laser controller with monitoring by a power meter. During the experiment, we used an electromechanical shutter to control the exposure time. The FTO substrates were loaded on the stage and exposed to the pulsed interference pattern. All the experiments were carried out in an ambient atmosphere environment.
1. The high-power laser was a pulsed Nd:YAG laser with a wavelength of 1064 nm. The laser power can be controlled by the laser controller with monitoring by a power meter. During the experiment, we used an electromechanical shutter to control the exposure time. The FTO substrates were loaded on the stage and exposed to the pulsed interference pattern. All the experiments were carried out in an ambient atmosphere environment.
In the hydrothermal reaction, 20 mL of deionized water was mixed with 20 mL of 2 mol L−1 H2SO4 aqueous solution to reach a total volume of 40 mL. The mixture was stirred for 5 min before the addition of 0.67 mL of tetrabutyl titanate (TBT). After stirring for another 10 min, pieces of FTO substrates were placed inside a Teflon-lined stainless steel autoclave. Then the hydrothermal synthesis was conducted at 150 °C for 8 h in an electric oven. After synthesis, the autoclave was cooled to room temperature. At last, the samples were taken out from the autoclave, rinsed extensively with deionized water and allowed to dry in an ambient atmosphere environment.
Measurement and characterization
Optical absorption and transparency spectra were measured with a Shimadzu UV-3600 spectrophotometer. Scanning electron microscope (SEM) images were obtained from a FEI QUANT-250 FEG microscope at the 10 kV accelerated voltage for the morphologies and microstructures of the sample surface and cross section. And X-ray diffraction (XRD) was used to characterize the crystal phase of samples by a Rigaku D/Max2500 using Cu-Kα (λ = 0.154 nm). The contact angle (CA) was measured using a Contact Angle System OCA 20 instrument (Data Physics Instruments GmbH, Germany) with a high purity water droplet (≈5 mL) deposited on the sample surface.Acknowledgements
The authors gratefully acknowledge the financial support from the 973 Project (2013CBA01700), National Natural Science Foundation Program of China (Grant No. 61322402, 61604018, 11504030 and 61505065), EU FP7 (BioRA No. 612641), China-EU H2020 (FabSurfWAR No. 2016YFE0112100 and 644971), EU H2020 (MNR4SCell No. 734174), Jilin Provincial Science and Technology Program (No. 20140414009GH, 20140622009JC, 20160520101JH and 20160623002TC), and China Postdoctoral Science Foundation (2015M581377).References
- Y. Luan, Y. Feng, M. Xie, J. Wu and L. Jing, RSC Adv., 2014, 4, 29964–29967 RSC.
- S. J. Bao, C. M. Li, J. F. Zang, X. Q. Cui, Y. Qiao and J. Guo, Adv. Funct. Mater., 2008, 18, 591–599 CrossRef CAS.
- Z. Zhang, L. Zhang, M. N. Hedhili, H. Zhang and P. Wang, Nano Lett., 2013, 13, 14–20 CrossRef CAS PubMed.
- M. Murdoch, G. I. N. Waterhouse, M. A. Nadeem, J. B. Metson, M. A. Keane, R. F. Howe, J. Llorca and H. Idriss, Nat. Chem., 2011, 3, 489–492 CAS.
- Z. Lou, F. Li, J. N. Deng, L. L. Wang and T. Zhang, ACS Appl. Mater. Interfaces, 2013, 5, 12310–12316 CAS.
- H. Chang, C. H. Chen, M. J. Kao, S. H. Chien and C. Y. Chou, Appl. Surf. Sci., 2013, 275, 252–257 CrossRef CAS.
- G. K. Mor, K. Shankar, M. Paulose, O. K. Varghese and C. A. Grimes, Nano Lett., 2006, 6, 215–218 CrossRef CAS PubMed.
- W. Li and D. Y. Zhao, Adv. Mater., 2013, 25, 142–149 CrossRef CAS PubMed.
- B. I. Stefanov, G. A. Niklasson, C. G. Granqvist and L. Österlund, J. Catal., 2016, 335, 187–196 CrossRef CAS.
- Y. B. Li, J. K. Cooper, W. J. Liu, C. M. Sutter-Fella, M. Amani, J. W. Beeman, A. Javey, J. W. Ager, Y. Liu, F. M. Toma and I. D. Sharp, Nat. Commun., 2016, 7, 12446–12452 CrossRef CAS PubMed.
- J. F. Ye, W. Liu, J. G. Cai, S. Chen, X. W. Zhao, H. H. Zhou and L. M. Qi, J. Am. Chem. Soc., 2011, 133, 933–940 CrossRef CAS PubMed.
- L. X. Yuan, S. Q. Meng, Y. Y. Zhou and Z. X. Yue, J. Mater. Chem. A, 2013, 1, 2552–2557 CAS.
- B. S. Shaheen, H. G. Salem, M. A. Elsayed and N. K. Allam, J. Phys. Chem. C, 2013, 117, 18502–18509 CAS.
- P. Roy, S. Berger and P. Schmuki, Angew. Chem., Int. Ed., 2011, 50, 2904–2939 CrossRef CAS PubMed.
- L. Pan, S. Wang, J. Xie, L. Wang, X. Zhang and J. Zou, Nano Energy, 2016, 28, 296–303 CrossRef CAS.
- L. Pan, S. Wang, J. Zou, Z. Huang, L. Wang and X. Zhang, Chem. Commun., 2014, 50, 988–990 RSC.
- B. Liu and E. S. Aydil, J. Am. Chem. Soc., 2009, 131, 3985–3990 CrossRef CAS PubMed.
- Z. Zhao, H. Q. Tan, H. F. Zhao, D. Li, M. Zheng, P. Du, G. Q. Zhang, D. Qu, Z. C. Sun and H. Y. Fan, Chem. Commun., 2013, 49, 8958–8960 RSC.
- H. Hussain, G. Tocci, T. Woolcot, X. Torrelles, C. L. Pang, D. S. Humphrey, C. M. Yim, D. C. Grinter, G. Cabailh, O. Bikondoa, R. Lindsay, J. Zegenhagen, A. Michaelides and G. Thornton, Nat. Mater., 2016, 16, 461–467 CrossRef PubMed.
- H. H. Fang, R. Ding, S. Y. Lu, J. Yang, X. L. Zhang, R. Yang, J. Feng, Q. D. Chen, J. F. Song and H. B. Sun, Adv. Funct. Mater., 2012, 22, 33–38 CrossRef CAS.
- L. Li, Z. B. Wang, W. J. Li, K. Q. Peng, Z. Zhang, M. Yu, Z. X. Song, Z. K. Weng, D. P. Wang and L. Zhao, Appl. Phys. Lett., 2015, 107, 133104 CrossRef.
- H. H. Fang, R. Ding, S. Y. Lu, L. Wang, J. Feng, Q. D. Chen and H. B. Sun, Opt. Lett., 2012, 37, 686–688 CrossRef CAS PubMed.
- B. Liu and E. S. Aydil, J. Am. Chem. Soc., 2009, 131, 3985–3990 CrossRef CAS PubMed.
- J. Zhuang, W. Dai, Q. Tian, Z. Li, L. Xie, J. Wang and P. Liu, Langmuir, 2010, 26, 9686–9694 CrossRef CAS PubMed.
- Z. Zhao, Z. Sun, H. Zhao, M. Zheng, P. Du, J. Zhao and H. Fan, J. Mater. Chem., 2012, 22, 21965–21971 RSC.
- L. Guo, H. B. Jiang, R. Q. Shao, Y. L. Zhang, S. Y. Xie, J. N. Wang, X. B. Li, F. Jiang, Q. D. Chen, T. Zhang and H. B. Sun, Carbon, 2012, 50, 1667–1673 CrossRef CAS.
- M. R. Alenezi, S. J. Henley, N. G. Emerson and S. R. P. Silva, Nanoscale, 2014, 6, 235–247 RSC.
Footnote |
| † Electronic supplementary information (ESI) available. See DOI: 10.1039/c7ra05949c |
| This journal is © The Royal Society of Chemistry 2017 |

