 Open Access Article
Creative Commons Attribution 3.0 Unported Licence
Directional bouncing of droplets on oblique two-tier conical structures†
Dan Li,
Shile Feng,
Yan Xing,
Siyan Deng,
Hu Zhou and
Yongmei Zheng *
*
Key Laboratory of Bio-Inspired Smart Interfacial Science and Technology of Ministry of Education, School of Chemistry, Beihang University, Beijing, 100191, P. R. China. E-mail: zhengym@buaa.edu.cn
First published on 19th July 2017
Abstract
Via a soft lithography method under an external magnetic field and using a nanocrystalline growth technique, oblique two-tier conical structures with different oblique angles of the cones are fabricated successfully. Compared to a previous study, the directional bouncing of droplets with the lowest energy loss can be realized on the OTCSs and the transport distance can be controlled by changing the OAs of the cones.
Anisotropic structures of surfaces to control water transportation1–3 have been of interest for application in the fields of heat-transfer,4,5 fog-harvesting,6–8 digital microfluidic devices9–11 and so on. In recent years, many studies have been focused on designing anisotropic structures (oriented,12 tilted pillars,13 ratchets,14 overlapping scales,15 etc.) to control the directional transportation of droplets,16–18 due to the introduction of differences in the solid–liquid–gas three phase contact lines (TCLs) along different orientations of the surfaces. There are many functional biological models in nature, such as rice leaves with anisotropic stripes,19,20 butterfly wings21 with oriented overlapping scales, and lotus leaves22 with wettable or adhesive gradients. Similar surfaces can be fabricated using some techniques, including the ferrofluid-moulding method,23,24 chemical deposition25,26 and reactive ion etching.27,28 However, it is still challenging to raise the droplet bouncing ability on anisotropic structures without any extra driving force. Here we present oblique two-tier conical structures (OTCSs) with different oblique angles (OAs) of the cones, which can be fabricated using a polydimethylsiloxane–Co particle composite (PDMS + Co) via soft lithography by controlling the direction of the external magnetic field and covering the surface with ZnO nano-hairs using a nanocrystalline growth technique. Due to the doping of Co particles as a ferromagnetic metal, the vertical conical structures can be reshaped into oblique conical structures under an external magnetic field. It is found that the OTCSs exhibit anisotropic wettability due to the difference in the TCLs. The directional bouncing of droplets along the oblique direction (OD) can be realized on the OTCSs. In particular, the phenomenon of directional bouncing of droplets results from the cooperative effect of unbalanced surface tension, capillary force and structure elasticity. This study offers insight into the design of surfaces, which can be expanded to the fields of engineering for controlling microfluidics, heat transfer, anti-icing,29 etc.
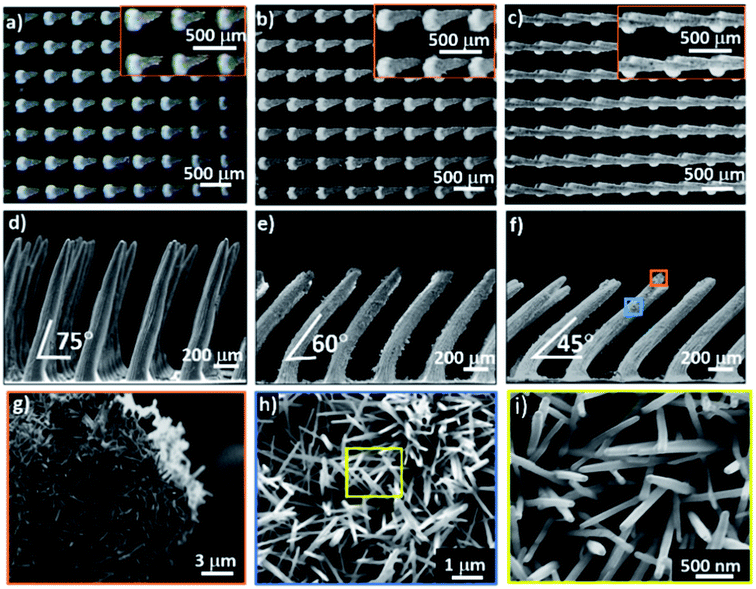
The OTCSs are fabricated using a PDMS + Co composite via soft lithography under an external magnetic field followed by coverage of the surface with ZnO nano-hairs using a nanocrystalline growth technique, as shown in Fig. S1 (the details can be found in the Experimental section of the ESI†). The template for soft lithography was first obtained using a needle-printing method by controlling the periodicity of the pattern. After the soft lithography and nanocrystalline growth techniques, vertical two-tier conical structures (VTCSs) with different periodicities (e.g., 350 μm, 400 μm, 450 μm and 500 μm, Fig. S3†) are initially obtained. It is demonstrated that the periodicity of 400 μm is highly desirable as a candidate for the synthesis of OTCSs due to its maximum contact angle of more than 150° (see Fig. S4†). The optical images (top view) and scanning electron microscopy (SEM) images (side view) of the OTCSs with different OAs (75°, 60° and 45°) are shown in Fig. 1a–f, respectively. The periodicities of their arrays are 400 μm, and the base diameter of the cones is 200 μm. Images of the ZnO nano-hairs are obtained using high-resolution SEM (Fig. 1g–i). The diameter of the ZnO nano-hairs is about 100 nm and the lengths are about 1 μm. Energy dispersive X-ray spectroscopy (EDX) was used to investigate the components and distribution of elements in the OTCSs (Fig. S5a†). The EDX results confirm that the OTCSs are composed of PDMS micro-cones and ZnO nano-hairs (i.e., PDMS: Si, O and C; ZnO: Zn and O). The X-ray diffraction (XRD) analysis in Fig. S5b† confirms the formation of ZnO nano-hairs as hexagonal wurtzite structures. The wettability of the OTCSs with different OAs was investigated using the sessile drop (volume: 3 μL) method, as shown in Fig. S6.† The CA of flat PDMS is 119° ± 1.2°, which shows hydrophobicity. Compared to flat PDMS, the CA of the cone-shaped PDMS is larger and it shows a greater hydrophobicity. For the conical PDMS, air can be trapped in the microstructures; therefore, the contact surface between the solid and the liquid is discrete.30 The liquid–solid contact surface is reduced and thus the hydrophobicity is improved.30 The micro-cone-shaped structures transfer droplets from the Wenzel31 state to the Wenzel–Cassie32 compounded state. In addition, the CAs of the oblique conical structures are lower than those of the vertical structures. Besides, the CA decreases with a decrease in the OA. For the droplets on the oblique cones, the contact part between the solid and the liquid is larger than that for the droplets on the vertical cones, and the TCLs increase with a decrease in the OA. When flat PDMS is covered with ZnO nano-hairs, the CA increases to 126.1° ± 1.3° and the sample is more hydrophobic. Concurrently, the CAs of the VTCS and OTCSs are larger than those of the original structures, and they accordingly show super-hydrophobicity. This indicates the importance of nanostructures in building super-hydrophobic surfaces. The surfaces of the structures covered with ZnO nano-hairs can reduce the TCLs of the droplets and maintain the droplets in the Cassie state. The micro/nano-scale two-tier structures are the key structural features which allow the surfaces to remain super-hydrophobic.30
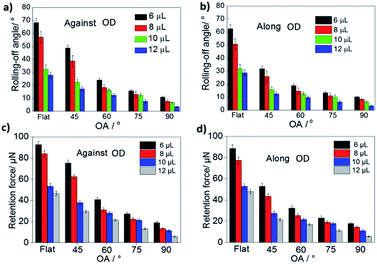
The rolling-off angles of the droplets were tested to characterize the anisotropic wettability of the OTCSs. Fig. 2a and b show the rolling-off angles of the droplets (volume: 6, 8, 10, and 12 μL) on the flat PDMS, VTCS and OTCSs with different OAs (75°, 60°, and 45°) against/along the OD. The rolling-off angles of the flat PDMS and VTCS against/along the OD are equivalent because both of these structures are symmetrical. But for the OTCSs, the rolling-off angles against the OD are larger than those along the OD, which shows anisotropic wettability. According to the reports by Kawasaki33 and Furmidge,34 the rolling-off angle of a droplet is related to a retention force. At the incipient moment of droplet motion, the droplet is in a force balanced state, and the retention force equals the component of the gravitational force parallel to the surface of the sample, which can be expressed as35
Fg = ρVg![[thin space (1/6-em)]](https://www.rsc.org/images/entities/char_2009.gif) sin sin![[thin space (1/6-em)]](https://www.rsc.org/images/entities/char_2009.gif) φ φ
| (1) |
To study deeply the difference in the retention force against/along the OD, the mechanism of droplet motion against/along the OD was analysed. When the droplet moves, the retention force (Fr) that resists the droplet motion is concomitant, and it can be estimated by36
Fr = wγ(cos![[thin space (1/6-em)]](https://www.rsc.org/images/entities/char_2009.gif) θr − cos θr − cos![[thin space (1/6-em)]](https://www.rsc.org/images/entities/char_2009.gif) θa) θa)
| (2) |
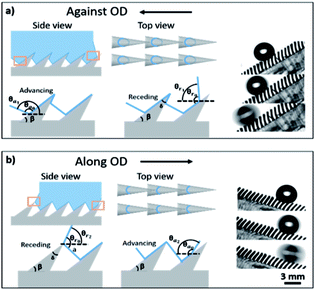
The OTCSs are composed of oblique conical pillars. The tilt angle of the micro-pillars is β and the apex angle is δ. For the anisotropic oblique conical structures, θa and θr are related to the intrinsic contact angles θa0 and θr0 of the material, the tilt angle β, and the apex angle δ of the conical structures. When a droplet moves against/along the OD, the TCLs are different. Fig. 3 illustrates the side view and top view of the liquid–solid contact lines against/along the OD. The solid–liquid contact lines against the OD are larger than those along the OD. During the droplet movement process, the TCLs of a conical pillar against the OD w1 are circular in shape, but along the OD w2 they are arc shaped, and w1/w2 > 1. The difference in the TCLs against/along the OD results in the different retention force. For the OTCS with an oblique angle of 45°, the TCLs against/along the OD are larger than those for the structures with the other OAs (from 75° to 45°), and the ratio w1/w2 is the largest. When a droplet moves against the OD (Fig. 3a), the advancing angle can be expressed as θa1 = θa0 + β, and the receding angle θr1 = θr0 − β. When the droplet moves along the OD (Fig. 3b), the TCLs are changed with the advancing angle θa2 = θa0 − β, and the receding angle θr2 = θr0 − a, a > δ + β > 50°. With increasing OA (β), the base point rises and the numerical a reduces.
Furthermore, for the OTCSs with different OAs (75°, 60° and 45°), the tilt angles (β) are 72.3°, 53.1° and 42°, respectively. The apex angle (δ) is 10°, and the intrinsic advancing angle (θa0) and the intrinsic receding angle (θr0) of the flat PDMS covered with ZnO nano-hairs is 134.6° and 112.3°, respectively. k is introduced and estimated using:
 | (3) |
For the OTCSs with different OAs (from 75° to 45°), k > 1. Thus, the ratio Faga/Falo can be presented as:
 | (4) |
Faga/Falo always remains greater than 1. Above all, the fact that the retention force against the OD is larger than that along the OD implies that the OTCSs generate a releasing direction for the droplets along the OD and the droplets would naturally move toward the OD.
To examine the dynamic directional motion of droplets on the OTCSs, a droplet was used to impact the OTCSs. The rebounding of the droplet can be modulated by changing the oblique angle of the array. Fig. 4a shows the impact and rebounding of droplets on the VTCS and OTCSs. It is observed that when a droplet strikes the surface of the VTCS, the droplet exhibits a symmetric pancake shape during the impact-rebounding process. Interestingly, when a droplet impacts the surface of the OTCSs, the left–right symmetry is broken, just as in a previous report,37 and an asymmetric pancake shape appears along the OD. This case can result from the unbalanced surface tension,37 structure elasticity,38 and upward capillary force39 related to the OAs. The cooperative effect provides a driving force for the directional motion of the droplets. Visually (Fig. 4b), a time-lapse optical image (with a long exposure time of 0.15 s) shows a continuous bouncing action (observed on the OTCSs with an OA of 60°). The heights for the second/third bounces decrease generally because of energy dissipation.
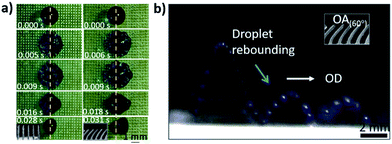 | ||
| Fig. 4 (a) A top view of droplets impacting the VTCS and an OTCS. (b) An optical time-lapse image showing a continuous self-propelled bouncing action (observed on the OTCS with an OA of 60°). | ||
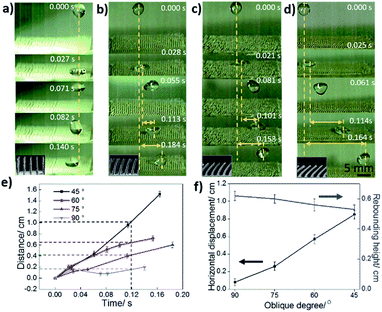
Fig. 5a–d show optical images of directional droplets (volume: 10 μL) bouncing on the VTCS and OTCSs with different OAs (OA(75°), OA(60°), and OA(45°)), respectively. It is observed that the droplet can rebound and be shed-off directionally. For example, the second rebound on the OTCS with OA(60°) along the oblique direction happens at 0.153 s. Firstly, the droplet on the VTCS only bounces in the vertical direction and has almost no displacement in the horizontal direction (Fig. 5a). In contrast, the droplet on the OTCS with an OA of 75° exhibits a horizontal displacement of 0.6 cm at 0.184 s (Fig. 5b). For the OTCS with an OA of 60°, the droplet exhibits a horizontal displacement of 0.95 cm at 0.153 s (Fig. 5c). Furthermore, the droplet on the OTCS with an OA of 45° exhibits a displacement of 1.61 cm at 0.164 s (Fig. 5d). In brief, the horizontal displacement of the droplets on the OTCSs with a smaller OA is larger. This indicates that the rebounding of the droplets can be effectively regulated by changing the oblique angle. This phenomenon occurs due to capillary force, which provides a horizontal driving force for droplet motion. With a decrease in the OA, the direction of the capillary force changes from the upward direction to the oblique direction. As shown in Fig. 5e, the horizontal displacement of the droplets (volume: 10 μL) on the VTCS and OTCSs with different OAs (75°, 60° and 45°) occurs as a function of time. The slopes of the curves indicate the velocity of droplet motion. For the bouncing of droplets on the OTCS with an OA of 45°, it is obvious that the curve is steep, which shows a large average velocity of 9.81 cm s−1. In the meantime, the velocity for the OAs of 60° and 75° is 6.20 cm s−1 and 3.26 cm s−1 on average, respectively. There is almost no displacement of the droplet on the VTCS. The horizontal displacement of the droplets on the OA(45°) and OA(60°) OTCSs is larger (e.g., more than 0.5 cm) within the same time period (e.g., 0.12 s). The relationship between the OA and the distance/height of the droplet during the second bounce is also shown in Fig. 5f. The horizontal displacement of the droplets on the OTCSs with smaller OAs is larger during the second bounce. The droplet on the VTCS has an average horizontal velocity of 0.71 cm s−1, and a horizontal displacement of 0.08 cm (0.027 s to 0.140 s). The droplet on the OTCS with an OA of 75° has an average horizontal velocity of 3.29 cm s−1, and a horizontal displacement of 0.28 cm (0.028 s to 0.113 s). For the OTCS with an OA of 60°, the second bounce of the droplet exhibits an average velocity of 6.87 cm s−1, and a displacement of 0.55 cm (0.021 s to 0.101 s). Furthermore, the droplet on the OTCS with an OA of 45° produced bounces with the fastest average velocity of 9.78 cm s−1, and a displacement of 0.87 cm (0.025 s to 0.114 s). However, there are no obvious differences in the bouncing height (the average bouncing height is 0.58 cm) during the second bounce process. The differences in both the TCLs and retention forces on the OTCSs in contrasting directions are attributed to the oblique angle gradients, and as a result, the droplet exhibits selective behaviour to move effectively.
Conclusions
In summary, OTCSs with different OAs can be controllably fabricated successfully. The bouncing of droplets along the OD can be realized on the OTCSs effectively, and the horizontal displacement is related to the oblique angle. In particular, when a droplet impacts the OTCSs, left–right asymmetry of the droplet appears. The cooperative effect of structure elasticity, unbalanced surface tension, and upward capillary force resulting from the oblique angle provides a driving force for droplet directional motion. This finding offers insight into the design of functional structures for the directional bouncing of droplets, and is considerably significant for extension into the application of fluid-control, transport, anti-icing, etc.Acknowledgements
The work was supported by the Key Program of the National Natural Science Foundation of China (21234001), the National Research Fund for Fundamental Key Projects (2013CB933001), the National Natural Science Foundation of China (21473007), and the Fundamental Research Funds for Central Universities (YWF-16-JCTD-A-01).Notes and references
- Y. Luo, J. Li, J. Zhu, Y. Zhao and X. F. Gao, Angew. Chem., Int. Ed., 2015, 54, 4876–4879 CrossRef CAS PubMed.
- W. J. Zhang, G. H. Lin, J. Li, H. Xue, Y. T. Luo and X. F. Gao, Adv. Mater. Interfaces, 2015, 2, 1500238 CrossRef.
- C. L. Hao, Y. H. Liu, X. M. Chen, J. Li, M. Zhang, Y. H. Zhao and Z. K. Wang, Small, 2016, 12, 1825–1839 CrossRef CAS PubMed.
- X. M. Chen, J. Wu, R. Y. Ma, M. Hua, N. Koratkar, S. H Yao and Z. K. Wang, Adv. Funct. Mater., 2011, 21, 4617–4623 CrossRef CAS.
- C. Dietz, K. Rykaczewski, A. G. Fedorov and Y. Joshi, Appl. Phys. Lett., 2010, 97, 033104 CrossRef.
- J. Ju, H. Bai, Y. Zheng, T. Y. Zhao, R. C. Fang and L. Jiang, Nat. Commun., 2012, 3, 1247 CrossRef PubMed.
- A. R. Parker and C. R. Lawrence, Nature, 2001, 414, 33 CrossRef CAS PubMed.
- Y. Zheng, H. Bai, Z. Huang, X. L. Tian, F. Q. Nie, Y. Zhao, J. Zhai and L. Jiang, Nature, 2010, 463, 640–643 CrossRef CAS PubMed.
- S. L. Feng, S. J. Wang, L. C. Gao, G. J. Li, Y. P. Hou and Y. Zheng, Angew. Chem., Int. Ed., 2014, 53, 6163–6167 CrossRef CAS PubMed.
- K. H. Chu, R. Xiao and E. N. Wang, Nat. Mater., 2010, 9, 413–417 CrossRef CAS PubMed.
- T. Kim and K. Y. Suh, Soft Matter, 2009, 5, 4131–4135 RSC.
- X. Yao, H. Bai, J. Ju, D. Zhou, J. Li, H. Zhang, B. Yang and L. Jiang, Soft Matter, 2012, 8, 5988 RSC.
- R. L. Agapov, J. B. Boreyko, D. P. Briggs, B. R. Srijanto, S. T. Retterer, C. P. Collier and N. V. Lavrik, Adv. Mater. Interfaces, 2014, 1, 1400337 CrossRef.
- M. J. Hancock and M. C. Demirel, MRS Bull., 2013, 38, 391–396 CrossRef CAS.
- Y. Zheng, X. Gao and L. Jiang, Soft Matter, 2007, 3, 178–182 RSC.
- R. L. Agapov, J. B. Boreyko, D. P. Briggs, B. R. Srijanto, S. T. Retterer, C. P. Collier and N. V. Lavrik, ACS Nano, 2014, 8, 860–867 CrossRef CAS PubMed.
- N. A. Malvadkar, M. J. Hancock, K. Sekeroglu, W. J. Dressick and M. C. Demirel, Nat. Mater., 2010, 9, 1023–1028 CrossRef CAS PubMed.
- L. Wang, M. X. Zhang, W. W. Shi, Y. P. Hou, C. C. Liu, S. L. Feng, Z. Y. Guo and Y. Zheng, Sci. Rep., 2015, 5, 11209 CrossRef PubMed.
- D. Wu, J. N. Wang, S. Z. Wu, Q. D. Chen, S. Zhao, H. Zhang, H. B. Sun and L. Jiang, Adv. Funct. Mater., 2011, 21, 2927–2932 CrossRef CAS.
- J. Gao, Y. L. Liu, H. P. Xu, Z. Q. Wang and X. Zhang, Langmuir, 2010, 26, 9673 CrossRef CAS PubMed.
- C. C. Liu, J. Ju, Y. Zheng and L. Jiang, ACS Nano, 2014, 8, 1321 CrossRef CAS PubMed.
- L. Feng, S. H. Li, Y. S. Li, H. J. Li, L. J. Zhang, J. Zhai, Y. L. Song, B. Q. Liu, L. Jiang and D. B. Zhu, Adv. Mater., 2002, 14, 1857 CrossRef CAS.
- C. Y. Huang, M. F. Lai, W. L. Liu and Z. H. Wei, Adv. Funct. Mater., 2015, 25, 2670 CrossRef CAS.
- M. Y. Cao, J. Ju, K. Li, S. X. Dou, K. S. Liu and L. Jiang, Adv. Funct. Mater., 2014, 24, 3235 CrossRef CAS.
- R. L. Agapov, J. B. Boreyko, D. P. Briggs, B. R. Srijanto, S. T. Retterer, C. P. Collier and N. V. Lavrik, Nanoscale, 2014, 6, 9293 RSC.
- X. Yao, L. Xu and L. Jiang, Adv. Funct. Mater., 2010, 20, 3343 CrossRef CAS.
- C. C. Liu, J. Ju, J. Ma, Y. Zheng and L. Jiang, Adv. Mater., 2014, 26, 6086 CrossRef CAS PubMed.
- X. M. Zhang, J. H. Zhang, Z. Y. Ren, X. Li, X. Zhang, D. F. Zhu, T. Q. Wang, T. Tian and B. Yang, Langmuir, 2009, 25, 7375 CrossRef CAS PubMed.
- M. X. Wen, L. Wang, M. Q. Zhang, M. Q Jiang and Y. M. Zheng, ACS Appl. Mater. Interfaces, 2014, 6, 3963 CAS.
- B. Su, Y. Tian and L. Jiang, J. Am. Chem. Soc., 2016, 138, 1727–1748 CrossRef CAS PubMed.
- R. N. Wenzel, Ind. Eng. Chem., 1936, 28, 988–994 CrossRef CAS.
- A. B. D. Cassie and S. BaxtER, Trans. Faraday Soc., 1944, 40, 546–551 RSC.
- K. Kawasaki, J. Colloid Sci., 1960, 15, 402–407 CrossRef CAS.
- C. G. L. Furmidge, J. Colloid Sci., 1962, 17, 309–324 CrossRef CAS.
- N. A. Malvadkar, M. J. Hancock, M. J. Sekeroglu, W. J. Dressick and M. C. Demirel, Nat. Mater., 2010, 9, 1023–1028 CrossRef CAS PubMed.
- M. Gleiche, L. C. Chi, E. Gedig and H. Fuchs, Chemphyschem, 2001, 2, 187–191 CrossRef CAS PubMed.
- Y. H. Liu, A. Matthew, J. Li, J. M. Yeomans and Z. K. Wang, Nat. Commun., 2015, 6, 10034 CrossRef CAS PubMed.
- M. Reyssat, F. Pardo and D. Quéré, Europhys. Lett., 2009, 87, 36003 CrossRef.
- Y. H. Liu, L. Moevius, X. P. Xu, T. Qian, J. M. Yeomans and Z. K. Wang, Nat. Phys., 2014, 10, 515 CrossRef CAS PubMed.
Footnote |
| † Electronic supplementary information (ESI) available: Fig. S1–S8. Experimental apparatus, SEM, EDX and XRD images, the change in CA and the retention force on sample-A. See DOI: 10.1039/c7ra05820a |
| This journal is © The Royal Society of Chemistry 2017 |

