
 Open Access Article
 This Open Access Article is licensed under a Creative Commons Attribution-Non Commercial 3.0 Unported Licence
Optical-signal-enhancing metasurface platforms for fluorescent molecules at water-transparent near-infrared wavelengths†
Hiroyuki Kurosawa and
Masanobu Iwanaga *
*
National Institute for Materials Science (NIMS), 1-1 Namiki, Tsukuba 305-0044, Japan. E-mail: iwanaga.masanobu@nims.go.jp
First published on 26th July 2017
Abstract
We report efficient sensing platforms to obtain artificially enhanced optical signals from near-infrared fluorescent molecules with emitting wavelengths in 1.1 μm range, which corresponds to the so-called “living-body window”. Prominent enhancement was experimentally achieved employing high-emittance metasurfaces of plasmo-photonic resonances. In addition, we show that enhanced fluorescence and Raman scattering are selectable using the metasurfaces with and without a self-assembled monolayer, which determines the contact of the molecules with outmost surface of noble metals. We also experimentally studied the effect of Au and Ag on the enhancement of optical signals, and numerically examined the conditions for attaining optimal enhancement. This paper describes a systematic study on artificially enhanced HOMO–LUMO transitions in the fluorescent molecules, explicitly suggesting an effective way to attain prominent enhancement for low-quantum-yield fluorescent molecules.
1 Introduction
Most of the existing molecular sensing techniques have been motivated to apply them for biosensing. For efficient bioimaging of living tissues, one of the most important wavelength ranges is 1.1 μm band, which is often called “living-body window”, since the light absorption by water and hemoglobin is minimal in the window. However, molecular sensing techniques based on plasmonic enhancement typically use fluorescent molecules that emit light with wavelengths shorter than 850 nm.1,2 Indeed, metallic nanoparticle-based1–8 or nanogap-based1,2,9–15 plasmonic enhancement of fluorescence intensity is mostly limited to wavelengths in the 600–800 nm range. This is partially because plasmonic structures, which are highly efficient with respect to enhancement of optical signals and simultaneously flexible with respect to their working wavelengths, have been hardly known.In contrast, there are virtually no reports to show efficient optical-signal enhancement of fluorescent molecules working in the 1.1 μm band.16 Generally, fluorescent molecules in the 1.1 μm band exhibit lower fluorescence yield than those in the visible wavelengths; therefore, it is difficult to attain prominent fluorescence enhancement using plasmonic structures composed of metallic nanostructures; to the best of our knowledge, fluorescence enhancement has not been reported for the 1.1 μm band. As for other luminescent materials, there are a few reports addressing metal-induced photoluminescence enhancement of Ag2S quantum dots17 and carbon nanotube18 at the 1.1 μm band; the maximum photoluminescence enhancement was not so large, and at most 100-fold17 and 10-fold18 for relevant references. The luminescent materials working at the 1.1 μm band are potential to optical sensing and/or imaging in aqueous circumstances including biotissues.
Thus, there is enough room to explore other platforms which show highly enhancing optical signals of fluorescent molecules or other luminescent materials in the 1.1 μm band. Considering the present status, we designed optical experiment to show prominent enhancement of optical signals such as fluorescence and Raman scattering in the 1.1 μm band. The present platform is particularly suitable to in situ sensing of molecules working in aqueous circumstances like proteins.
Stacked complementary (SC) plasmo-photonic (PlasPh) metasurfaces19,20 are considered as good optical-signal enhancement platforms, which are directly applicable to molecular sensing. This metasurface is fabricated using a silicon-on-insulator (SOI) substrate, forms a SC noble-metal structure, and exhibits a series of hybrid plasmon-photonic-guided-mode resonances. The PlasPh metasurfaces have been reported to have tunable resonances in a wide wavelength range from the visible to the near-infrared telecom ranges.20,21 The PlasPh metasurfaces have been found to be highly suitable for enhanced spectroscopy of fluorescent molecules around the visible range.20–23 For other metallic nanostructures, it is usually quite demanding to ensure tunability of the operating wavelength and, at the same time, capability for high-efficient enhancement. In this respect, photonic-crystal-based platforms24 are different, because they allow to scale the operating wavelengths, though photonic crystals tend to show weaker enhancement than plasmonic platforms.
Here, we report experimental observations of optical-signal enhancement using IR26 molecules (Exciton Inc., Ohio, USA), which work mainly in the living-body window. In addition, we compare the SC PlasPh metasurfaces incorporating Au and Ag, and address the difference. We also performed numerical analysis of the enhancement mechanism, and discuss the experimental results based on the numerical findings.
2 Results and discussion
Fig. 1 shows basic properties of the IR26 fluorescent molecules. Extinction and fluorescence spectra were first reported in 1980s,25 showing the fluorescence and lasing in the living-body window. Fig. 1a shows a photograph of an IR26 methanol solution of 70 μM; the solution is dark. IR26 molecules are partially soluble in organic solvents such as methanol, ethanol, and acetyl glycol; as a result, a fraction of the molecules remains to be in the form of powder in the solution. Fig. 1b shows the structure of an IR26 molecule, which is slightly modified from the original report25 in terms of the attendant halide. | ||
| Fig. 1 (a) Appearance of the methanol solution of IR26 molecules (70 μM). (b) The structure of an IR26 molecule. (c) Extinction spectrum (black) of the 50 μM IR26 methanol solution. Fluorescence (FL) spectrum (red) of the IR26 molecules dispersed and dried on a Si wafer. The red arrow indicates the excitation laser line at 1064.1 nm. | ||
Fig. 1c shows the measured extinction spectrum of an IR26 solution of 50 μM (black curve), measured using a quartz cuvette with the light path of 1 cm, and the fluorescence spectrum of the IR26 molecules dispersed on a Si wafer (red curve), measured after drying the methanol solution in air. Owing to the low quantum yield, the fluorescence intensity is quite weak and the signal-to-noise ratio is small. The fluorescence peaks in 1.1 μm band and decreases as the emission wavelength increases. The red arrow indicates the excitation laser line at 1064.1 nm, which is resonant to the HOMO–LUMO excitation of IR26 molecules. The fluorescence was measured using a laser-line cut filter; therefore, a sharp edge appears at 1100 nm in the fluorescence spectrum. The detailed measurement conditions are described in Section 4.1 and 4.2.
2.1 Detection of enhanced optical signals
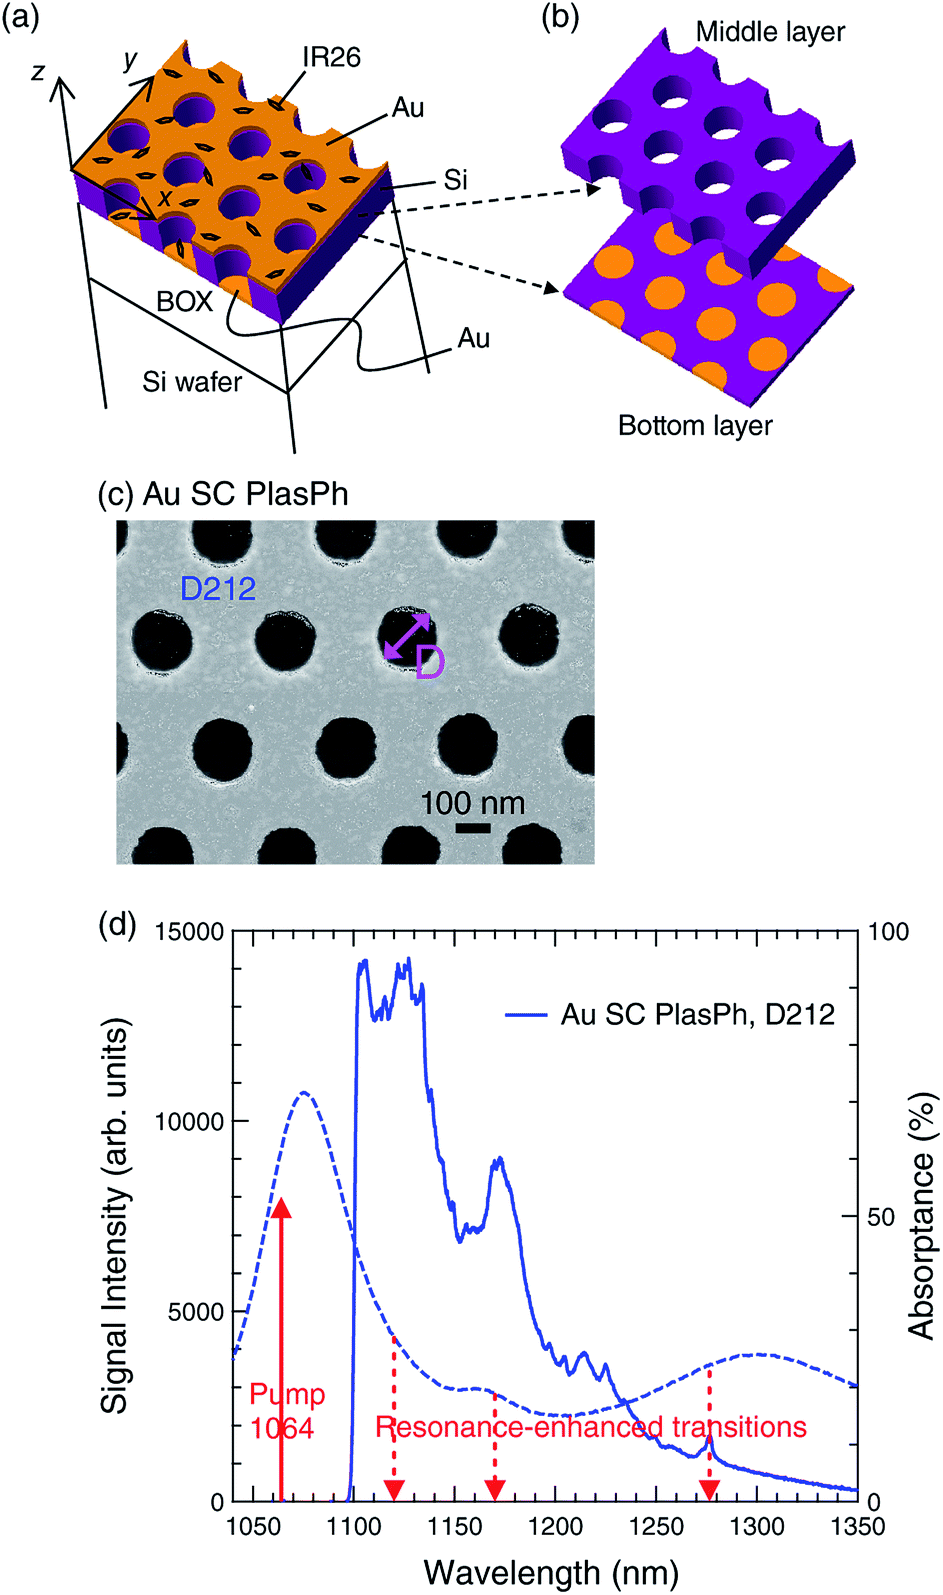 | ||
| Fig. 2 (a) 3D-view schematic of a Au SC PlasPh metasurface, on which IR26 molecules are dispersed. The coordinate xyz axes are set as shown. (b) The middle and bottom layers of the SC metasurface in (a) are illustrated in a decomposed way. (c) Top-view SEM image of a Au PlasPh metasurface of air-hole diameter D 212 nm (D 212). The scale bar indicates 100 nm. (d) The measured enhanced optical signals (solid curve) and light absorptance spectrum (dashed curve), which is equivalent to the metasurface's emittance spectrum. | ||
Fig. 2b illustrates the middle and bottom layers of the SC metasurface in Fig. 2a; dashed arrows from Fig. 2a indicate the correspondence. The two layers are displayed in a decomposed manner for clarity; the middle layer is a perforated Si crystal slab and the bottom is a Au-disk embedded Si slab.
Fig. 2c shows a top-view SEM image of a Au SC PlasPh metasurface with air-hole diameter (D) of 212 nm, which is indicated by a symbol D 212; similar symbols are used in the following figures. The image was taken in a top-view configuration, observing the top layer from the air side.
Fig. 2d shows a typical measured optical signal (blue solid curve) emitted from the IR26 molecules dispersed on the Au SC PlasPh metasurface. The pumping wavelength was 1064.1 nm, which is indicated by a red arrow. The signal was measured in the setup equivalent to that of the fluorescence measurement in Fig. 1c; consequently, a sharp edge at 1100 nm was observed, coming from the laser-line cut filter. The spectral shape of the measured optical signal basically originate from the fluorescence spectrum of IR26 molecules in Fig. 1c, whereas two prominent peaks appear around 1120 and 1170 nm in Fig. 2d. These peaks are associated with peaks of light absorptance (blue dashed curve). The absorptance was evaluated with equation such as
| A = 100 − R | (1) |
We point out that absorptance is equivalent to emittance from the metasurfaces, due to reciprocity;26 therefore, the prominent peaks are ascribed to emittance enhancement. Red dashed arrows indicate resonantly enhanced transitions. In addition to fluorescence, sharp 11 peaks also appear at 1110–1156, 1195–1227 and 1277 nm as shown in Fig. 2c; these peaks are attributed to the Raman scattering by the IR26 molecules from comparison with a previous report on the IR26 molecules.16 Wavenumber representation is generally used for Raman signals, being shown in Fig. S3 (ESI†). We note that IR26 molecules have been rarely studied in plasmonic systems and the literature is very limited to our knowledge. As for the fluorescence enhancement, this paper is the first report.
 | ||
| Fig. 3 (a) Schematic of molecules on the Au PlasPh metasurface with SAM. (b) The structure of a 15-CPDT molecule, forming the SAM. The C–H chain stands on the Au surface with Au–S covalent bond. (c) The measured optical signals (solid curves) and absorptance spectra (dashed curves). The blue, red, and black lines denote the PlasPh metasurfaces with air-hole diameter D 212, 220 and 280 nm, respectively. | ||
Fig. 3c shows measured optical signals (solid curves) from the IR26 molecules dispersed on the Au SC PlasPh metasurfaces with the SAM. Three spectra are shown with blue, red and black, which were measured for the PlasPh metasurfaces with air-hole diameter D 212, 220, and 280 nm, respectively. Light absorptance spectra are also shown with dashed curves and the scale is shown on the right axis; the colors are similar to those of the optical signals. The absorptance spectra were evaluated using eqn (1), similarly to Fig. 2c. The measured reflectance spectra are shown in Fig. S2 (ESI†). The red arrow indicates the excitation wavelength of 1064.1 nm, which is close to the resonance of the PlasPh metasurface with D 212 nm and is off resonance to the PlasPh metasurface with D 280 nm.
In Fig. 3c, the strongest optical-signal enhancement was observed for the PlasPh metasurface with D 212 nm. This probably occurred because the excitation and emission wavelengths were matched for the resonances in the PlasPh metasurface with D 212 nm. Comparing the three cases of D 212, 220 and 280 nm, we find that it is primarily crucial whether the excitation wavelength is resonant or not for obtaining highly enhanced optical signals. Indeed, the PlasPh metasurface with D 280 nm exhibited far weaker optical signals than the PlasPh metasurface with D 212 nm. This contrast strongly suggests that the excitation efficiency on the PlasPh metasurfaces directly contributes to the observed signal intensities.
As for the PlasPh metasurface with D 220 nm in Fig. 3c, the emission wavelengths are relatively off resonance, compared with the metasurface with D 212 nm, and the optical signals are smaller than those from the metasurface with D 212 nm. It is thus most likely that the tuning at the emission wavelengths is secondary important to obtain the enhancing signals. Furthermore, the excitation wavelength is located at longer wavelength side than the peak of PlasPh resonance. This excitation condition is studied later with examining numerical results on the resonant electric-field distributions.
Another feature in Fig. 3c is that Raman signals are hardly observed. Previously, it was reported that, when the outmost Au surface is covered with the carboxy-end SAM with the thickness more than 0.6 nm, the Raman signals of fluorescent molecules emitting around 800 nm are efficiently suppressed.23 A similar effect was observed for the IR26 molecules. Indeed, Fig. 2 shows the prominent Raman signals on the PlasPh metasurface without SAM whereas Fig. 3 shows fluorescence-dominant signals on the PlasPh metasurfaces with the SAM. In the latter, the intrinsic LUMO–HOMO transition, that is, the fluorescent transition is considered to be efficiently preserved.
In the configurations without SAM (Fig. 2), both fluorescence and Raman scattering were observed. The excitation–relaxation dynamics in molecules yielding the optical signals in the artificial configurations has not been clarified to date. One possibility to induce modification of the molecular eigen states allowing efficient Raman processes was inferred in a similar artificial configuration.23 Importantly, we are able to experimentally select the enhanced optical signals using the PlasPh metasurfaces.
Let us mention again that the optical signals are enhanced even when the SAM is not prepared on the PlasPh metasurfaces. Such enhancing effects on the PlasPh metasurfaces were observed using other fluorescent molecules working at and around the visible range.21–23,28 The quantitative discussion is provided later (Table 1). Metal-induced fluorescence quenching, which was often reported in other plasmonic platforms including flat metal surfaces,29–31 has not been observed on the SC PlasPh metasurfaces. This is one of the advantages in the present PlasPh metasurfaces.
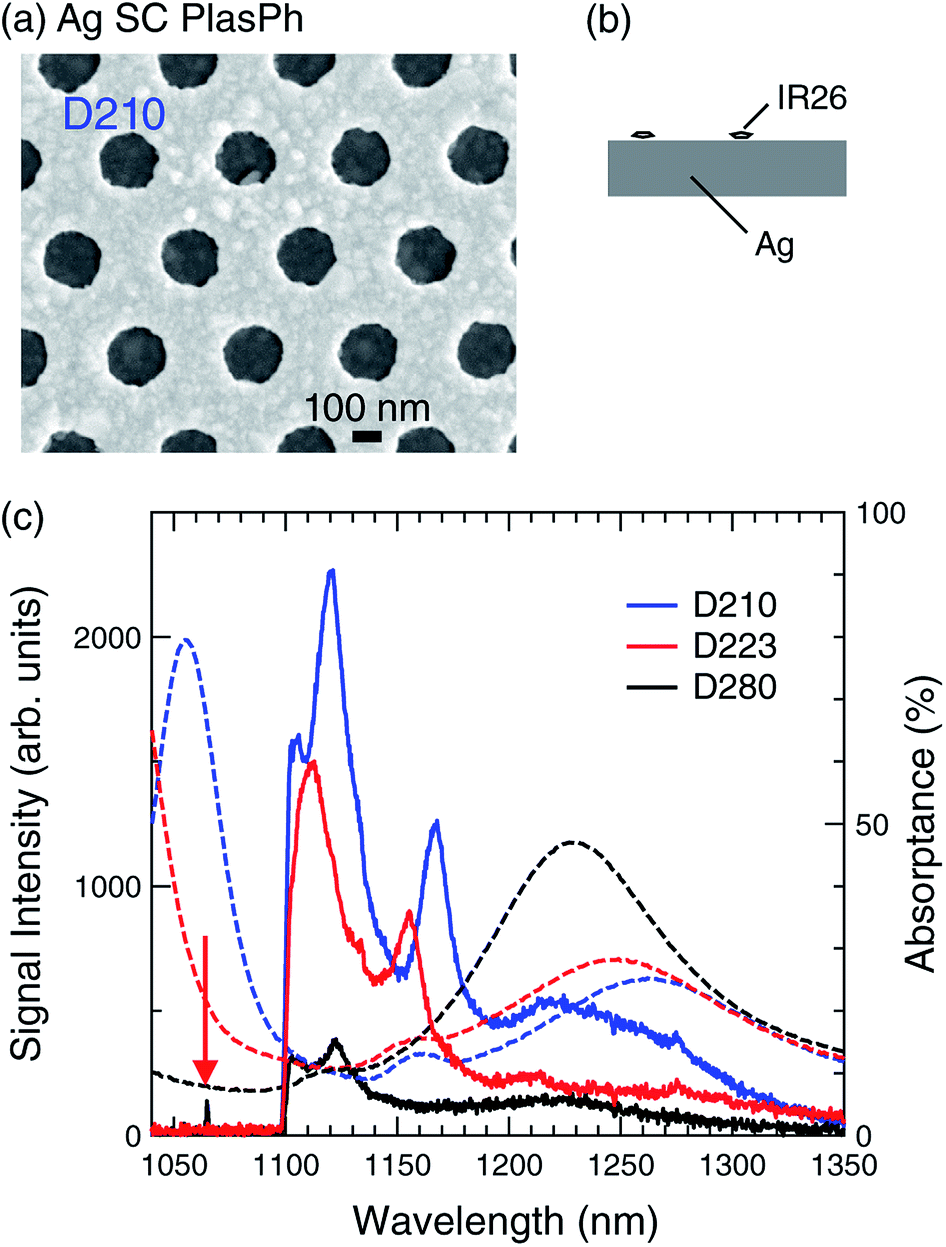 | ||
| Fig. 4 (a) Top-view SEM image of the Ag PlasPh metasurface with air-hole diameter D 210 nm. The scale bar indicates 100 nm. (b) Schematic of the molecule configuration on the Ag PlasPh metasurface without SAM. (c) The measured optical signals (solid curves) and absorptance spectra (dashed curves). The blue, red, and black correspond to the Ag PlasPh metasurfaces with D 210, 223, and 280 nm, respectively. | ||
Fig. 4c shows the measured optical signals from the IR26 molecules dispersed on the Ag SC PlasPh metasurfaces (solid curves) and the absorptance spectra of the metasurfaces (dashed curves). Blue, red, and black curves denote the data on the Ag PlasPh metasurfaces with air-hole diameter D 210, 223 and 280 nm, respectively. The corresponding absorptance spectra were derived using eqn (1), based on the measured reflectance spectra in Fig. S4 (ESI†). The red arrow indicates the excitation wavelength of 1064.1 nm. For these Ag PlasPh metasurfaces, Raman signals were slightly observed (e.g., at 1275.8 nm) whereas fluorescence was dominantly observed in an enhanced manner. Similarly to the Au SC PlasPh metasurfaces in Fig. 2 and 3, large absorptance at the excitation wavelength of 1064.1 nm is strongly correlated with the strong optical signals; moreover, the local maxima at the emission wavelengths contribute to the peaks of the observed signal peaks. Note that the observed peaks at 1167 and 1230 nm for the Ag PlasPh metasurface with D 210 nm are associated with the local absorptance maxima at 1160 and 1260 nm, respectively, and that the fluorescence spectrum of the IR26 molecules dispersed on a non-enhancing substrate decreases with increasing the wavelength (Fig. 1c). A similar tendency was observed for the Ag PlasPh metasurface with D 223 nm. Thus, the mechanism of enhancement is found qualitatively similar to the Au PlasPh metasurfaces.
Quantitatively, the optical signal intensities detected from the Ag PlasPh metasurfaces were smaller than those from the Au PlasPh metasurfaces; related to this result, we simply point out that the excitation wavelength was located at a longer wavelength than the absorptance peaks of the Ag PlasPh metasurfaces with D 210 and 223 nm, and discuss this result later (Fig. 5 and 6) when examining the resonant electric fields.
 | ||
| Fig. 5 Schematic energy diagrams of IR26 molecules. (a) Free state. FL denotes fluorescence. Excitation is abbreviated as Exc. (b) The energy diagrams of the IR26 molecules on the SC PlasPh metasurfaces, which is an artificial configuration for the dispersed molecules. Excitation is reinforced under the high absorptance. The optical signals are enhanced by the emittance. | ||
 | ||
| Fig. 6 Resonant EM fields. (a) Numerically calculated absorptance spectrum at the normal incidence. (b) The |E| distribution at a resonant wavelength R in (a). Representative xy and xz planes are shown, on which the IR26 molecules are mainly dispersed. | ||
In addition, although it is unclear why Raman-scattering components were slightly observed for the Ag PlasPh metasurfaces with any SAM, the quality of the deposited Ag may affect the observed signals; at least, the grain of Ag in Fig. 4a is larger than that of Au in Fig. 2b. Actually, we repeated the measurement by removing and depositing the Ag film; still, the results were almost the same. We consequently consider that, at least when using our preparation protocol and the deposition instrument, the results will remain unchanged.
2.2 Mechanism of optical-signal enhancement
Fig. 5 shows schematics of energy diagrams of IR26 molecules. Fig. 5a shows the energy diagram of free-state IR26 molecules; the diagram consists of HOMO–LUMO transition. The fluorescence (FL) has a band, shown with gray.Fig. 5b depicts the enhanced transitions, based on the observed optical signals in the artificial configurations of the SC PlasPh metasurfaces. First, the excitation is reinforced (bold arrow) owing to the high absorptance of the SC metasurfaces. As seen in Fig. 2–4, when the excitation is tuned to the large absorptance peaks, the most prominent optical signals were observed; therefore, we consider that the resonance-tuning at the excitation wavelength is primarily important to obtain the large enhancement. The resonant electric fields are examined later (see Fig. 6 and 7). Second, the excited IR26 molecules have options in accordance with/without SAM; as shown in Fig. 3, the SC metasurfaces with SAM induce FL signals, whereas, as shown in Fig. 2, the SC metasurfaces without SAM dominantly induce FL and Raman scattering. Third, in both cases, the emitted optical signals were enhanced in accordance with the emittance of the SC metasurfaces (horizontal dashed lines in Fig. 5b); note that the emittance is equivalent to absorptance.26
 | ||
| Fig. 7 Resonant electric-field distributions. The intensity |E|2 is shown in common with the logarithmic scale for (0.1, 400) range. (a)–(c) correspond to the resonant wavelengths indicated in Fig. 5a by arrows L, R, and S, respectively. These panels are presented in saturated manners; see the text for more details. | ||
2.3 Comparison of metals
In plasmonics, it is an open question to clarify the best metal for particular purposes. Here, from the viewpoint of the enhancing performance, we compare the noble metals used in the PlasPh metasurfaces.Table 1 summarizes correlation of the metals and SAM, and the resultant enhanced effects. The thiolate SAM is suitable for growing on Au surface because of covalent bond Au–S; therefore, we used the SAM only for the Au PlasPh metasurfaces. The effect of the SAM was manifested in the appearance of Raman-signal components. The direct contact of the test molecules with the outmost Au surface enhances Raman signals as was observed in a previous study.23
As for the Ag PlasPh metasurfaces, the fluorescence was dominantly enhanced and the Raman-signal component was quite weak. Even when any SAM is not incorporated, the fluorescence is dominant on the Ag metasurfaces. This qualitative tendency is different from that in the Au metasurfaces.
Table 1 also lists enhancement factors (EFs), which were evaluated by taking the ratios of optical signal intensities measured for the SC PlasPh metasurfaces (Fig. 2d, 3c and 4c) to the optical signal intensity for the reference Si wafer in Fig. 1c. Other candidates, such as SiO2 substrate and flat Au film, for reference were also tested; however, they exhibited almost zero signal and turned out to be unsuitable for the reference; the measured data using a SiO2 substrate are shown in Fig. S5 (ESI†). The EFs are expressed22 such as
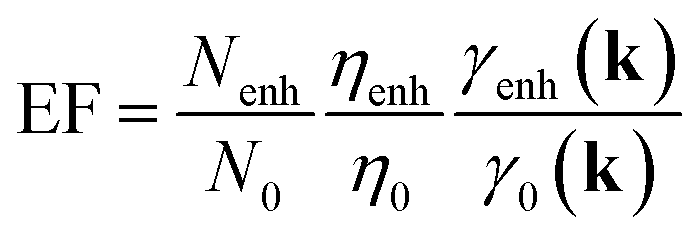 | (2) |
We list the EFs in Table 1, based on the most prominent peaks in Fig. 2d, 3c and 4c. The enhanced optical signals detected from the SC PlasPh metasurfaces exhibited spatial fluctuations by approximately 30% of the averaged values, as noted in the Section 4.1; therefore, the enhancement factors have large standard deviations and should be understood to represent the typical responses. This fluctuating property of enhancement factor is quite different from the previous studies using fluorescent molecules around the visible ranges22,23 because the enhancement of optical signals in those previous studies was almost uniform. Still, the enhancement factors, though not exact, serve as quantitative indicators and enable us to understand the extent of the enhancement.
In the present experiment, the Au SC PlasPh metasurface without covering with SAM showed the best performance; for this metasurface, the enhancement was observed for both fluorescence and Raman signals. On the other hand, Au PlasPh metasurfaces with SAM and Ag PlasPh metasurfaces without SAM exhibit relatively smaller enhancement factors, as summarized in Table 1. This different enhancement effects cannot be understood only from the macroscopic optical properties of the Au and Ag PlasPh metasurfaces because the measured reflectance spectra are quite similar to each other, as shown in Fig. S2 and S4 (ESI†). In the present sample preparation noted in Section 4.1, we can assume that the dispersed molecular density is almost equivalent in the three cases. In addition, the SAM layer is quite thin, being estimated to be less than 1 nm;22 the electric-field enhancement is nearly independent of the SAM, as discussed later (Section 2.4). Taking account of these points, we suggest the following possibilities for the origin of the difference: (i) difference in contact (or absorption) state of the IR26 molecules on the metal atoms and the SAM, and (ii) difference of resonant electric fields according to the metal species. As for (ii), let us examine the resonant electric fields in the next subsection; see the discussion at the end of Section 2.4. As for (i), although we do not have experimental data nor the first-principle calculation data for analyzing a system of 108 metal atoms and an IR 26 molecule, the possibility (i) is not excluded as one of the origins. Related to (i), we mention that the quality of the Ag film does not seem good enough (Fig. 4a) because the Ag grains are rather large, roughly 50 nm in diameter. Such Ag grains tend to have larger optical loss than crystalline Ag surfaces by molecular-beam-epitaxy growth.32–34 Also, oxidation of the outmost Ag surface possibly affect the enhancement effect, in comparison with the outmost Au surface that is hardly oxidized.
The best performance of the Au PlasPh metasurface without SAM was realized at the condition in which the excitation wavelength was fairly well tuned to a high absorptance peak and the emission wavelengths were resonant with the local absorptance (i.e., emittance) maxima. Comparing the data of D 212 nm (or D 210 nm) and D 280 nm in Fig. 3 (or Fig. 4), it is most likely that the PlasPh resonance at the excitation wavelength primarily contributes to the enhancement of optical signals. As discussed on Fig. 3c above, the degree of resonance matching at the emission wavelengths is secondary important to enhance the optical signals. In the next subsection, we examine resonant electromagnetic (EM) fields, related to the optical-signal enhancement.
2.4 Resonant EM fields on the SC PlasPh metasurfaces
Fig. 6 compiles the numerical results for resonant EM fields in the excitation condition of IR26 molecules. Fig. 6a shows a computed absorptance spectrum; the air-hole diameter was assumed to be a typical value of 224 nm and the metal was set to be Au. The numbers 1 and 2 denote the first and second resonances at the normal incidence in the photon-energy order; note that the horizontal axis is represented with wavelength in accordance with the experimental results.Fig. 6b presents the resonant |E| distribution (E: electric-field vector) at the peak wavelength of the second resonance, indicated by an arrow with R in Fig. 6a; the capital letters R, S, and L denote the resonant wavelength, shorter wavelength than the resonance, and longer wavelength, respectively. Representative xy and xz sections are shown in Fig. 6b to visualize the absolute values of resonant electric field that contributes to exciting the IR26 molecules. The two xy sections are top and bottom surfaces of the SC PlasPh metasurfaces; the z positions are indicated in the xz plane with dashed lines. The xz section was taken through the centers of air holes. The incidence was set to |E| = 1. Although the maximal |E| value of the resonant electric field appears on the xz plane and takes 38.7, we display the |E| distribution in the (0, 5) range with the linear scale, since almost all the locations except for the hot (or the |E|-largest) spots become dark and cannot be seen. The hot spots appear at the interface between the top Au and Si. Fig. 6b shows that a-few-fold enhanced electric fields locate on the top Au, near the air holes, and inside the air holes, implying that electric-field enhancement is not so large. Thus, Fig. 6b does not support that the prominently enhanced signals summarized in Table 1 are attributable only to the electric-field enhancement. This numerical insight is consistent with the previously reported results employing the Au SC PlasPh metasurfaces.21–23
Let us further examine the enhanced optical signals and resonant electric fields. Fig. 3c shows a definite difference under the excitation at the second resonance; the two cases (D 212 nm, blue; D 220 nm, red) yield strong and weak optical signals, respectively. As far as we assume the experimental conditions are equivalent, the difference is attributable to relative excitation-wavelength positions for the second PlasPh resonance peak around 1060 nm. The SC PlasPh metasurface with D 212 nm was excited at a shorter wavelength than the second resonance whereas the metasurface with D 220 nm was excited at a longer wavelength. To clarify the difference, we compared electric-field intensity |E|2 distributions at the wavelengths S, R, and L around the second resonance in Fig. 5a; the |E|2 distributions are shown in the next.
Fig. 7 shows resonant electric-field distributions in the xz sections. The intensity |E|2 is plotted in color on the xz section through the centers of the air holes. The section in Fig. 7b is identical to the xz section in Fig. 6b. Note that, in Fig. 6b, absolute value of electric field |E| is plotted in the linear scale whereas the intensity distributions in Fig. 7 are shown with the logarithmic scale for (0.1, 400) range in saturated manners for better visibility. The intensities exceeding 400 in Fig. 7 are represented with yellow. The maxima intensities are 741, 1498 and 1125 in Fig. 7a–c, respectively.
The resonant wavelengths of Fig. 7a–c are indicated by the arrows L, R and S in Fig. 5a, respectively. When comparing the electric-field intensities at the interface of air/Au on the top layer, it turns out that the PlasPh resonance has relatively strong electric field at the resonant and shorter wavelengths; at the longer wavelengths, the electric-field intensity takes relatively small values. This qualitative tendency agrees with the enhancement factors in Table 1.
In Fig. 7, it is also verified that the hot spots corresponding to large intensity exceeding 100 are localized at the side of air holes and that dark spots, which look black, appear on the top Au surface in Fig. 7a and on the bottom Au surfaces in Fig. 7a–c. The dispersed IR26 molecules are considered to be placed mainly on the Au surfaces and possibly on the Si sidewall. Nevertheless, the contribution from the Si sidewall is most likely to be small because, if it should be dominant, the observed optical-signal intensities would show similar amounts at the three conditions of L, R and S in Fig. 5a; however, the differences in the maximum electric-field intensity are about within a factor of 2, as mentioned above, whereas the difference in the enhanced optical-signal intensities is more than 10 fold (Fig. 3c). Thus, we can conclude that the molecules dispersed on the top layer mostly contribute to the enhanced optical signals. We also found that the excitation efficiency of the IR26 molecules is high at the R and S conditions (i.e., Fig. 7b and c) and becomes smaller at the L condition (i.e., Fig. 7a).
The intensity distributions indicate that the excitation at the longer wavelength, corresponding to L, is associated with dark spots on the top and bottom of the Au surface, meaning that the excitation efficiency of the IR26 molecules is relatively lower than the excitation at the S position. Indeed, the excitation at the L position results in smaller optical signals than the excitation at the S position (Fig. 3).35 As for the Ag cases in Fig. 4, both Ag SC PlasPh metasurfaces of D 210 and D 223 nm were excited at the L positions; consequently, they exhibited quantitatively similar optical signals to each other. Thus, these numerical results in Fig. 7 consistently describe all the observed optical-signal intensity ratios in this paper, strongly suggesting that it is important to tune the PlasPh resonance to the excitation wavelength. The SC PlasPh metasurfaces are tunable at the resonant wavelengths by varying the air-hole diameters and are advantageous because the SC metasurfaces are applicable for a variety of molecules that have different HOMO–LUMO transition wavelengths.
At the end of discussion, we address the origin of the different enhancement factors noted in Section 2.3. The possibility (ii) is attributed to the different resonant effects owing to the metal species. In this subsection, we have seen the resonant electric fields in the Au PlasPh metasurface. Resonant electric fields in a structurally equivalent Ag PlasPh metasurface are shown in Fig. S6 (ESI†); as a result, we confirm that the resonant electric fields in the Ag metasurface are quite similar to those in the Au metasurface (Fig. 7). Therefore, we can exclude the possibility (ii) as origin of the different enhancement factors in the Au and Ag cases.
3 Conclusions
We have shown artificially enhanced optical signals emitted from the IR26 molecules dispersed on the SC PlasPh metasurfaces with high-emittance resonances. The enhancement was prominent and clearly observed in comparison with the reference signal detected on a non-enhancing Si substrate. We moreover showed that the enhanced optical signals are selected by choosing the outmost surface with/without SAM. This strategy was first demonstrated for fluorescent molecules working around the visible range23 and has been validated for the fluorescent molecules in the living-body window. Thus, the SC PlasPh metasurfaces are substantiated to serve as quite versatile sensors for optical detections of fluorescent molecules from the visible to the near-infrared 1.2 μm ranges. It was also clarified, by numerically examining the resonant electric-field distributions, that it is important to tune the excitation wavelength to the resonance wavelengths of the SC PlasPh metasurfaces for significant enhancement of the optical signals.4 Methods
4.1 Preparation of metasurfaces
Nanopatterns for the metasurfaces were produced by ultraviolet (UV) NIL in a high-throughput manner. Nanohole arrays of 1 × 1 cm2 dimensions were introduced on SOI substrates (SOI 200 nm/BOX 375 nm/Si wafer 625 μm). The array periodicity was 410.5 nm and the nanoholes were arrayed in a hexagonal manner. The detailed nanofabrication procedure was reported previously.28 We deposited Au or Ag on the nanopatterned SOI substrates as normal as possible to the substrates, and obtained the SC metasurfaces in accordance with the design (Fig. 2a). The thickness of Au and Ag was set to 35 nm, which is thin enough to separate the top and bottom layers, and is thick enough to induce plasmonic resonances. The fabricated structures were confirmed to take section-view SEM images; a typical image28 is cited in Fig. S1 (ESI†). The SC metasurfaces exhibit a series of PlasPh resonances that have been clarified recently.19 In the present experiment, the second resonance at the normal incidence mainly contributed to enhancing the optical signals.One advantage of the nanoimprinted SOI substrates is their reusability. We used SC PlasPh metasurfaces in the fluorescent-molecule experiment, removed the noble metals by wet etching, and recovered them as SC PlasPh metasurfaces by performing the metal deposition. This reusability substantially expedited the optical experiment.
The IR26 methanol solution was 50 μM, which was prepared by adjusting the density using a more dense solution in Fig. 1a. We dispersed a 2 μL drop of the solution on each SC PlasPh metasurface. The drop promptly spread to a large area (i.e., approximately 2 cm diameter) and became dry in air within a few seconds. When we dispersed the molecules, we did not observe any explicit difference with/without the SAM; therefore, we consider that the molecules were dispersed similarly to each other.
If we assume that the molecules were dispersed in an ideally uniform way, we can estimate the molecule density to be 1 molecule/(2.6 × 2.6) nm2 on the surface of SC PlasPh metasurface with D 212 nm, where the air-hole wall is included. Thus, the idealized density turns out to be sparse enough to isolate each molecule.
As noted in the Section 2, it is difficult to completely dissolve IR26 molecules in organic solvents. Therefore, we can easily infer that the dispersed molecules do not obey the ideally spatial distribution assumed in the preceding paragraph. Indeed, we observed inhomogeneous responses of the optical-signal intensity for the SC PlasPh metasurfaces though the spectral shapes were virtually the same. In our data, the fluctuations were approximately 30% of average values. This point was referred to in estimating the EFs in Table 1. In Fig. 2–4, we show measured typical optical signals, except for the largest and smallest data; note that the averaged signals are no longer measured data because they underwent the calculating procedure.
4.2 Optical measurement
Reflectance spectra were measured using a spectrometer that enables to conduct incidence-angle resolved measurements. Reflectance was measured at the incidence angle of 5°, as a substitute for the normal incidence. The incident polarization was p polarization, for which the incident electric-field vector is kept in the xz plane of Fig. 2a when the plane of incidence is the xy plane. At the nearly normal incidence, the measurement under s polarization, for which the incident electric-field vector is parallel to the y axis in Fig. 2a when the plane of incidence is the xy plane, resulted in almost identical reflectance spectra. The light absorptance spectra in Fig. 2–4 were evaluated using eqn (1) and the measured reflectance spectra.We mention that all the measured reflectance spectra shown in this paper were measured before dispersing the IR26 molecules. The dispersed density was rather small; consequently, we did not observe any detectable change in the reflectance spectra due to the molecule dispersion.
The enhanced optical signals from the IR26 molecules dispersed on the SC PlasPh metasurfaces were measured in an illumination-and-collection setup. An objective lens (×10, numerical aperture 0.26) focused the excitation laser light on the SC PlasPh metasurfaces and collected the optical signals emitted by the IR26 molecules. The incidence and collection were carried out for the nearly normal incidence in accordance with the numerical aperture. The excitation wavelength was 1064.1 nm and the light was emitted by a single-mode continuous-wave laser. The excitation power was 12 mW on the sample surfaces and the data acquisition time was 10 s. A setup similar to the one in this study was previously reported with the configuration diagram.23
4.3 Numerical implementation
Numerical calculations for optical spectra and EM fields were conducted using rigorous coupled-wave analysis (RCWA),36 which enables to numerically solve Fourier-transformed Maxwell equations and is one of the first-principle techniques in electromagnetism. To evaluate stacked structures with avoiding numerical divergence, scattering-matrix algorithm37 has to be incorporated. Numerical code based on the RCWA and scattering-matrix algorithm was prepared and executed on supercomputers in a multi-parallel implementation manner.In the RCWA-based computations, we used measured complex relative permittivities of Au and Ag as the material parameters. The measured data are shown in Fig. S6 (ESI†). The reflectance spectra that were numerically calculated using measured permittivities show better correspondence with the measured optical spectra than the numerical results based on the literature data.38 Therefore, in this study, we adopted measured permittivities. In a recent study on high-transmittance metasurfaces,39 we also found that the measured permittivities result in better reproduction of experimental data.
As for other materials involved in the SC PlasPh metasurfaces, we used material parameters in literature and typical values. Complex refractive index of Si was taken from literature.40 The refractive index of the BOX layer was set to 1.46 since the material is SiO2. The refractive index of air was set to 1.00027.
Conflict of interest
There are no conflicts of interest to declare.Acknowledgements
We thank Bongseok Choi for producing nanoimprinted substrates based on SOI substrates. M. I. thanks KAKENHI Grant (Number 26706020) from the Japan Society for Promotion of Science and HPCI System Research Project (IDs: hp160035, hp170134) from Research Organization for Information Science and Technology, Japan; the numerical implementations were conducted at Cyberscience Center, Tohoku University. This study was partially supported by the 4th mid-term project in NIMS. Nanofabrication was conducted at NanoIntegration Platform in NIMS.Notes and references
- J. R. Lakowicz, K. Ray, M. Chowdhury, H. Szmacinski, Y. Fu, J. Zhang and K. Nowaczyk, Analyst, 2008, 133, 1308–1348 RSC
.
- M. Bauch, K. Toma, M. Toma, Q. Zhang and J. Dostalek, Plasmonics, 2014, 9, 781–799 CrossRef CAS PubMed
- D. L. Jeanmaire and R. P. van Duyne, J. Electroanal. Chem., 1977, 84, 1–20 CrossRef CAS
- M. G. Albrecht and J. A. Creighton, J. Am. Chem. Soc., 1977, 99, 5215–5217 CrossRef CAS
- A. M. Glass, P. F. Liao, J. G. Bergman and D. H. Olson, Opt. Lett., 1980, 5, 368–370 CrossRef CAS PubMed
- J. F. Li, Y. F. Huang, Y. Ding, Z. L. Yang, S. B. Li, X. S. Zhou, F. R. Fan, W. Zhang, Z. Y. Zhou, D. Y. Wu, B. Ren, Z. L. Wang and Z. Q. Ti, Nature, 2010, 464, 392–395 CrossRef CAS PubMed
- Y. Li, Q. Shi, P. Zhang, Y. Xiahou, S. Li, D. Wang and H. Xia, J. Mater. Chem. C, 2016, 4, 6649–6656 RSC
- D. R. Nayak, N. Bhat, M. Venkatapathi and S. Umapathy, J. Mater. Chem. C, 2017, 5, 2123–2129 RSC
- A. Kinkhabwala, Z. Yu, S. Fan, Y. Avlasevich, K. Müllen and W. E. Moerner, Nat. Photonics, 2009, 3, 654–657 CrossRef CAS
- M. Schmelzeisen, Y. Zhao, M. Klapper, K. Müllen and M. Kreiter, ACS Nano, 2010, 4, 3309–3317 CrossRef CAS PubMed
- C.-C. Fu, G. Ossato, M. Long, M. A. Digman, A. Gopinathan, L. P. Lee, E. Gratton and M. Khine, Appl. Phys. Lett., 2010, 97, 203101 CrossRef
- W. Zhang, F. Ding, W.-D. Li, Y. Wang, J. Hu and S. Y. Chou, Nanotechnology, 2012, 23, 225301 CrossRef PubMed
- L. Zhou, F. Ding, H. Chen, W. Ding, W. Zhang and S. Y. Chou, Anal. Chem., 2012, 84, 4489–4495 CrossRef CAS PubMed
- S. Dinda, V. Suresh, P. Thoniyot, A. Balčytis, S. Juodkazis and S. Krishnamoorthy, ACS Appl. Mater. Interfaces, 2015, 7, 27661–27666 CAS
- J. Pang, I. G. Theodorou, A. Centeno, P. K. Petrov, N. M. Alford, M. P. Ryan and F. Xie, J. Mater. Chem. C, 2017, 5, 917–925 RSC
- Y. Nishijima, Y. Hashimoto, L. Rosa, J. B. Khurgin and S. Juodkazis, Appl. Phys. A, 2014, 117, 647–650 CrossRef CAS
- I. G. Theodorou, Z. A. R. Jawad, H. Qin, E. O. Aboagye, A. E. Porter, M. P. Ryan and F. Xie, Nanoscale, 2016, 8, 12869–12873 RSC
- G. Hong, S. M. Tabakman, K. Welsher, H. Wang, X. Wang and H. Dai, J. Am. Chem. Soc., 2010, 132, 15920–15923 CrossRef CAS PubMed
- M. Iwanaga and B. Choi, Nano Lett., 2015, 15, 1904–1910 CrossRef CAS PubMed
- M. Iwanaga, Plasmonic Resonators: Fundamentals, Advances, and Applications, Pan Stanford Publishing, Singapore, 2016 Search PubMed
- M. Iwanaga, B. Choi, H. T. Miyazaki, Y. Sugimoto and K. Sakoda, J. Nanomater., 2015, 2015, 507656 Search PubMed
- B. Choi, M. Iwanaga, H. T. Miyazaki, Y. Sugimoto, A. Ohtake and K. Sakoda, Chem. Commun., 2015, 51, 11470–11473 RSC
- M. Iwanaga, B. Choi, H. T. Miyazaki and Y. Sugimoto, Nanoscale, 2016, 8, 11099–11107 RSC
- B. Choi, M. Iwanaga, T. Ochiai, H. T. Miyazaki, Y. Sugimoto and K. Sakoda, Appl. Phys. Lett., 2014, 105, 201106 CrossRef
- A. Seilmeier, B. Sens, K. H. Drexhage and W. Kaiser, Opt. Lett., 1983, 8, 205–207 CrossRef CAS PubMed
- J.-J. Greffet and M. Nieto-Vesperinas, J. Opt. Soc. Am. A, 1998, 15, 2735–2744 CrossRef
- J. C. Love, L. A. Estroff, J. K. Kriebel, R. G. Nuzzo and G. M. Whitesides, Chem. Rev., 2005, 105, 1103–1170 CrossRef CAS PubMed
- B. Choi, M. Iwanaga, H. T. Miyazaki, K. Sakoda and Y. Sugimoto, J. Micro/Nanolithogr., MEMS, MOEMS, 2014, 13, 023007 CrossRef
- R. R. Chance, A. H. Miller, A. Prock and R. Silbey, J. Chem. Phys., 1975, 63, 1589–1595 CrossRef CAS
- E. Dulkeith, A. C. Morteani, T. Niedereichholz, T. A. Klar, J. Feldmann, S. A. Levi, F. C. J. M. van Veggel, D. N. Reinhoudt, M. Möller and D. I. Gittins, Phys. Rev. Lett., 2002, 89, 203002 CrossRef CAS PubMed
- P. Anger, P. Bharadwaj and L. Novotny, Phys. Rev. Lett., 2006, 96, 113002 CrossRef PubMed
- J. H. Park, P. Ambwani, M. Manno, N. C. Lindquist, P. Nagpal, S.-H. Oh, C. Leighton and D. J. Norris, Adv. Mater., 2012, 24, 3988–3992 CrossRef CAS PubMed
- Y.-J. Lu, J. Kim, H.-Y. Chen, C. Wu, N. Dabidian, C. E. Sanders, C.-Y. Wang, M.-Y. Lu, B.-H. Li, X. Qiu, W.-H. Chang, L.-J. Chen, G. Shvets, C.-K. Shih and S. Gwo, Science, 2012, 337, 450–453 CrossRef CAS PubMed
- Y. Wu, C. Zhang, N. M. Estakhri, Y. Zhao, J. Kim, M. Zhang, X.-X. Liu, G. K. Pribil, A. Alù, C.-K. Shih and X. Li, Adv. Mater., 2014, 26, 6106–6110 CrossRef CAS PubMed
- Similar tendency was observed for the Au SC PlasPh metasurfaces without SAM though the data are not shown.
- L. Li, J. Opt. Soc. Am. A, 1997, 14, 2758–2767 CrossRef
- L. Li, J. Opt. Soc. Am. A, 1996, 13, 1024–1035 CrossRef
- A. D. Rakić, A. B. Djurušić, J. M. Elazar and M. L. Majewski, Appl. Opt., 1998, 37, 5271–5283 CrossRef
- H. Kurosawa, B. Choi, Y. Sugimoto and M. Iwanaga, Opt. Express, 2017, 25, 4446–4455 CrossRef PubMed
- E. D. Palik, Handbook of Optical Constants of Solids II, Academic, San Diego, USA, 1991 Search PubMed
Footnote |
| † Electronic supplementary information (ESI) available: SEM images to confirm the stacked complementary structure; measured reflectance spectra of Au and Ag SC PlasPh metasurfaces; enhanced optical signal with wavenumber representation; measured data on an IR26-dispersed SiO2 substrate; numerically calculated resonant electric fields of Ag PlasPh metasurface; measured and cited data on complex permittivity of Au and Ag. See DOI: 10.1039/c7ra05664h |
| This journal is © The Royal Society of Chemistry 2017 |