
 Open Access Article
 This Open Access Article is licensed under a
 Creative Commons Attribution 3.0 Unported Licence
Effects of Cu addition on the corrosion behavior of NiCoCrMo alloys in neutral chloride solution
Biaobiao Yang a,
Jiaxiang Lia,
Xiaojuan Gonga,
Yan Nieb and
Yunping Li*cd
a,
Jiaxiang Lia,
Xiaojuan Gonga,
Yan Nieb and
Yunping Li*cd
aSchool of Materials Science and Engineering, Central South University, Changsha, China
bYuanMeng Precision Technology (Shenzhen) Institute, Shenzhen, China
cState Key Lab for Powder Metallurgy, Central South University, Changsha, China. E-mail: lyping@csu.edu.cn; Tel: +86 13807499012
dHigh Temperature Materials Research Institute, Central South University, Changsha, China
First published on 22nd August 2017
Abstract
The influence of Cu addition (0–4 mass%) on the corrosion behavior of Ni–30Co–16Cr–15Mo alloy in neutral chloride solution is investigated by electrochemical measurements. The results indicate that alloy with 0.5 mass% Cu shows inferior corrosion resistance compared to Cu-free alloy under open-circuit potential, which is possibly ascribed to the galvanic corrosion from the insufficient coverage of Cu on the passive film; a higher fraction of Cu results in a significant improvement on corrosion resistance, and Cu is believed capable of strengthening the passivation and postponing the oxidization of dominant Cr(III) in the passive film into more soluble Cr(VI).
1. Introduction
Due to their exceptionally high heat resistance and corrosion resistance, Ni-based alloys are widely used in a variety of severe environments. Among them, Ni–Cr–Mo alloys demonstrate outstanding corrosion resistance,1–4 primarily attributed to Cr and Mo elements: Cr promotes the formation of a compact Cr2O3 passive film, while Mo significantly enhances the localized corrosion resistance by blocking the dissolution of passive film and acts as an effective barrier against the diffusion of ions through the film via precipitating on the external film.5–8 Mo(IV) (as hydrated MoO2) on the outermost film can be oxidized into Mo(VI) forming soluble MoO42−. The dissolved MoO42− anions6 are cation-selective, resisting the penetration of Cl− and other ions, which facilitates the growth of an inner oxide film.In spite of the aforementioned merits, the low wear resistance of Ni–Cr–Mo alloy due to its low hardness greatly limits its further application in the injection moulding of fluorine-containing resin or plastic.9,10 Recent study indicates that substituting Co for Ni greatly increases the wear resistance of Ni–16Cr–15Mo (NiCrMo) alloy without sacrificing its corrosion resistance to aqueous HF solutions, although with the cost significantly increasing.11,12 This can be ascribed to the reduced stacking fault energy (SFE) of alloy by Co addition, leading to higher work hardening on surface during friction. The hardness of Ni–30Co–16Cr–15Mo (NiCoCrMo) alloy can be further enhanced by plastic deformation,13 although the corrosion resistance of deformed alloy is greatly reduced compared to that of NiCrMo alloy. More recent studies show that further addition of 2 mass% Cu yields a tremendous improvement on corrosion resistance of NiCoCrMo alloy in aqueous HF acid solution, even after severe plastic deformation.8,14
Cu is widely used as an alloying element to enhance the corrosion resistance of alloys in various conditions.15–21 For instance, Pardo et al.19 indicate that a compact Cu film formed in the alloy/solution interface impedes the dissolutions of alloy elements and dramatically increases the corrosion resistance of AISI304 stainless steel in 30 mass% H2SO4 at 50 °C. Similar result by Hong et al.21 suggests that the passive film of Cu-containing steel mainly consists of Cu compounds in a 10 mass% H2SO4 solution. Hou et al. also8 suggests that Cu addition alters the passivation from a Mo-dominated into a Cu-dominated passive film in HF solution.
Despite the aforementioned efforts devoted to investigate the effect of Cu on corrosion resistance, the effects of Cu addition on the passivation mechanism of NiCoCrMo alloy in common corrosive media such as brine solutions have not been clarified clearly yet. Therefore, in the present research, the influence of Cu addition on the corrosion behavior and passivation mechanism of NiCoCrMo alloys in 3.5 mass% aerated NaCl solution is investigated systematically in detail for the first time.
2. Experimental
2.1. Materials
Ni–30Co–16Cr–15Mo–6Fe–xCu–0.7Mn (mass%) alloys with nominal Cu concentrations of 0, 0.5, 2, 4 mass%, are selected for this study, which hereafter are referred to as 0Cu, 0.5Cu, 2Cu and 4Cu, respectively. Ingots of alloys are fabricated by vacuum melting and then subjected to a homogenization treatment at 1250 °C for 14 h. This is followed by a hot forging (60%, reduction) at the same temperature, and homogenization treatment again at 1250 °C for 1 h, immediately with quenching into water so as to avoid unwanted precipitated phase. The above mentioned heat treatment conditions are carried out according to the phase diagram of Ni–30Co–16Cr–15Mo–6Fe–xCu–0.7Mn (mass%), calculated by using a Thermo-Calc 5.0 TCW software (Thermo-Calc Software, Stockholm, Sweden)22 with a Ni-based alloy database, as shown in Fig. 1. All specimens are cut into disks with 16 mm diameter and 1 mm thickness on an electrical discharge wire-cutting machine.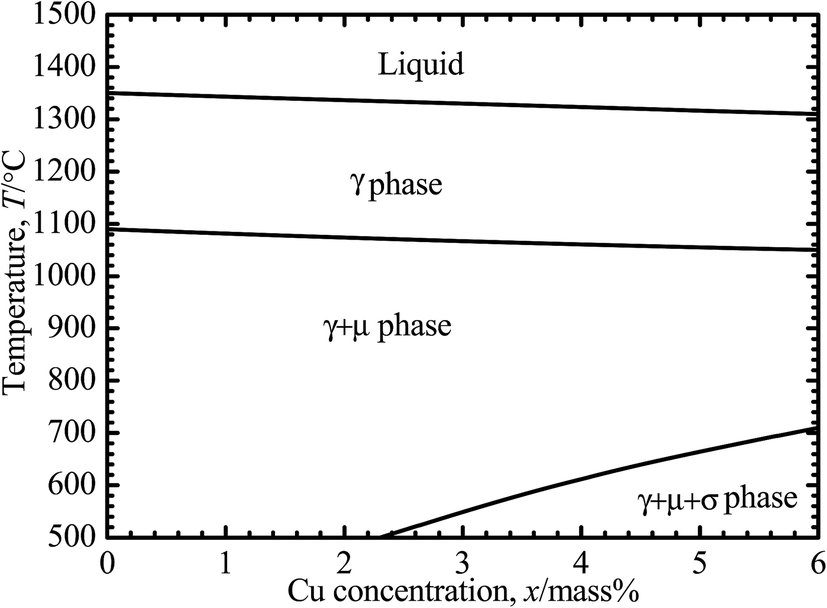 | ||
| Fig. 1 Phase diagram of Ni–30Co–16Cr–15Mo–6Fe–xCu–0.7Mn (x = 0, 0.5, 2, and 4 mass%), calculated using the Thermo-Calc TCW 5.0 software based on the Ni-based alloy database (database N17).22 | ||
2.2. Electrochemical measurements
Specimens for electrochemical impedance spectroscopy (EIS) are wet-grounded with SiC paper (up to 2000 grit), and polished sequentially with 1 μm Al2O3, 0.3 μm Al2O3, and a colloidal SiO2 suspension to attain mirror-like surface. Specimens in potentiodynamic polarization measurements are wet-grounded with SiC paper (up to 800 grit). After that, all the specimens are rinsed in an ultrasonic cleaner with deionized water and alcohol sequentially. All the tests are performed in 3.5 mass% aerated NaCl solution at room temperature. Analytical grade chemicals and ultrapure water (18.25 MΩ cm) are used for the solution preparation. A conventional three-electrode glass cell is used for the experiments and the diameter of specimen surface exposed to the solutions is designed as 10 mm. A Pt counter electrode and a saturated calomel electrode are fixed in the cell. After immersion in 3.5% aerated NaCl solution for 0.5 h, electrochemical impedance spectroscopy (EIS) measurements are performed using a PARSTAT-4000 (Princeton Applied Research, Oak Ridge) with the amplitude of 10 mV over the range from 106 Hz to 0.05 Hz and corresponding impedance data are fitted by ZVIEW software. EIS measurement at each condition is carried out for at least five times to guarantee the repeatability of the experimental results.Prior to polarization test, specimens are immersed in the solution for 7200 s for open-circuit potential (Eocp) measurement, and the finally stabilized potential is employed as Eocp. Polarization test is carried out from 300 mV more negative than Eocp up to 1.5 V (vs. saturated calomel electrode, SCE) at a scan rate of 0.167 mV s−1. Polarization test for each specimen is run for at least five times to guarantee the repeatability of the experimental results. The specimens after electrochemical tests are then drawn from the cell immediately and rinsed with deionized water gently to remove electrolyte on the surface, waiting for surface characterization.
2.3. Microstructure characterization
Initial microstructure is investigated by using an electron backscattered diffraction (EBSD) integrated on a field-emission scanning electron microscope (FEI XL30S field-emission gun; FEI Company, Portland, OR) operated at an accelerating voltage of 20 kV and a step size of 1.0 μm. The surface profiles of the specimens after polarization measurements are measured using a laser scanning microscope (LSM; VK-200 series, Keyence, Osaka, Japan) with a plane and height resolution of 48.83 nm and 0.1 nm, respectively. Microstructural observations and compositional analyses are carried out, using a scanning electron microscope (FEI XL30S field-emission gun; FEI Company, Portland, OR) equipped with energy dispersive X-ray spectroscopy (EDS).X-ray photoelectron spectroscopy (XPS, ESCALAB 250Xi, Thermo Fisher-VG Scientific, Waltham, MA) is utilized to characterize the passive film at 0.5 V (SCE). All binding energies are given relative to the Fermi level, and all spectra are obtained using incident monochromatic Al Kα X-ray source with energy of 1486.61 eV. During survey scan, an energy range of 1100 eV, pass energy of 150 eV, step size of 1 eV, a sweep time of 100 s and a spot size 650 μm by 450 μm are used. For high-resolution spectra, an energy range of 20–40 eV, pass energy of 30 eV, and step size of 0.05 eV are used. Peak shifts due to charging are normalized to the C 1s peak position set to 284.8 eV and spectra corrected using a Shirley background correction. The incident photons are set at 45° to the specimens.
3. Results
3.1. Initial microstructure
The initial microstructures of the alloys before electrochemical tests, observed using EBSD, are shown in inverse polar figure (IPF) maps in Fig. 2(a–d) for 0Cu, 0.5Cu, 2Cu and 4Cu, respectively. The mean grain sizes of all alloys are close to 250 μm. In addition, all alloys exhibit entirely annealed microstructure, characterized by a prevalence of Σ3 annealing twins and deformation-free matrix. No obvious precipitation of second phase is observed.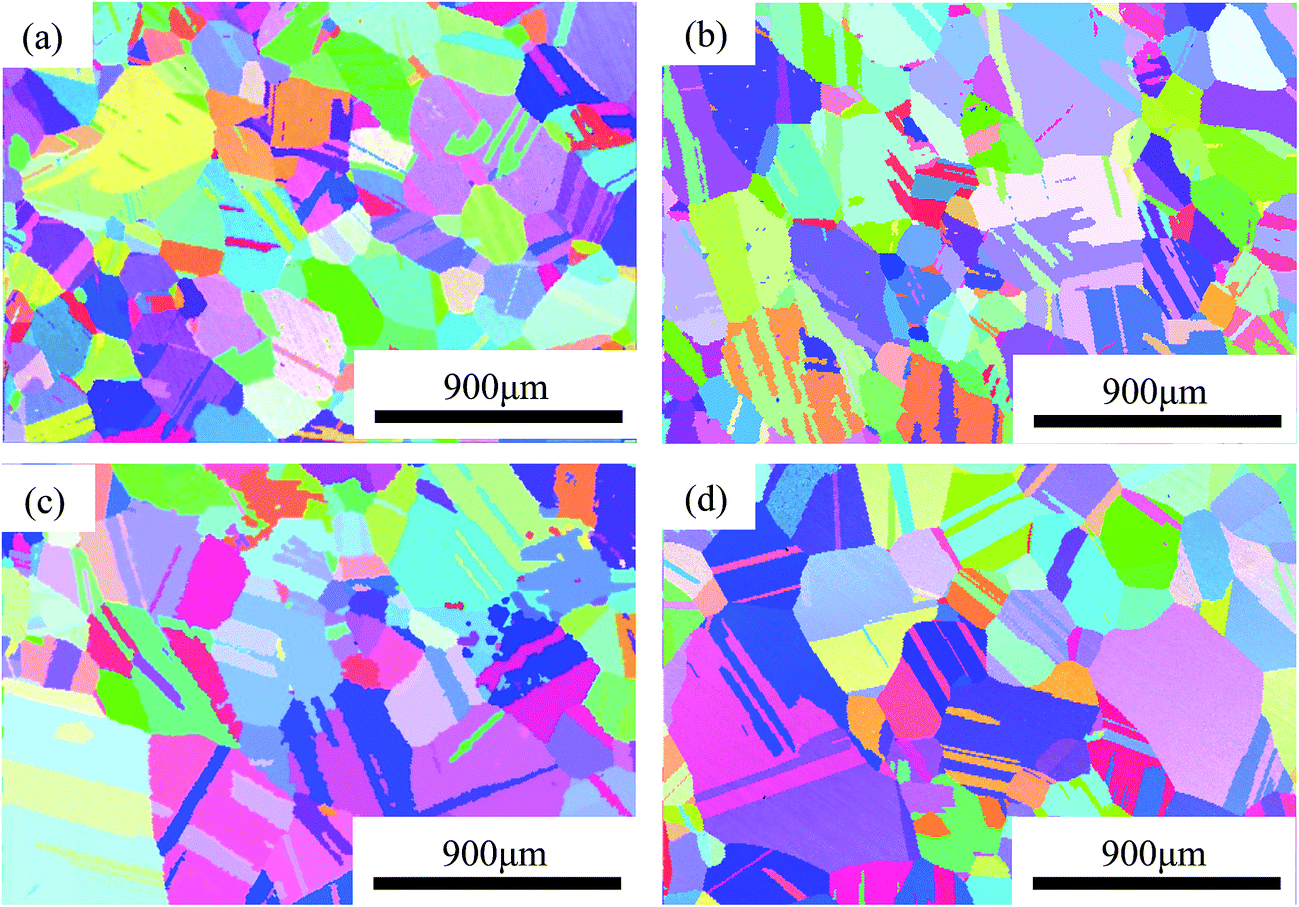 | ||
| Fig. 2 Microstructures of NiCoCrMo alloys with a mirror-like surface: IPF mapping of (a) 0Cu, (b) 0.5Cu, (c) 2Cu, (d) 4Cu. | ||
3.2. Open-circuit potential measurement
The time evolution of the open-circuit potential, Eocp, for 0Cu, 0.5Cu, 2Cu, and 4Cu specimens in 3.5 mass% aerated NaCl solution is given in Fig. 3. With increasing Cu content, Eocp roughly shifts to a nobler potential. In addition, the time–potential curves for alloys with low Cu concentration (0 and 0.5 mass%) are hard to reach steady state compared to that with higher Cu concentration at present condition.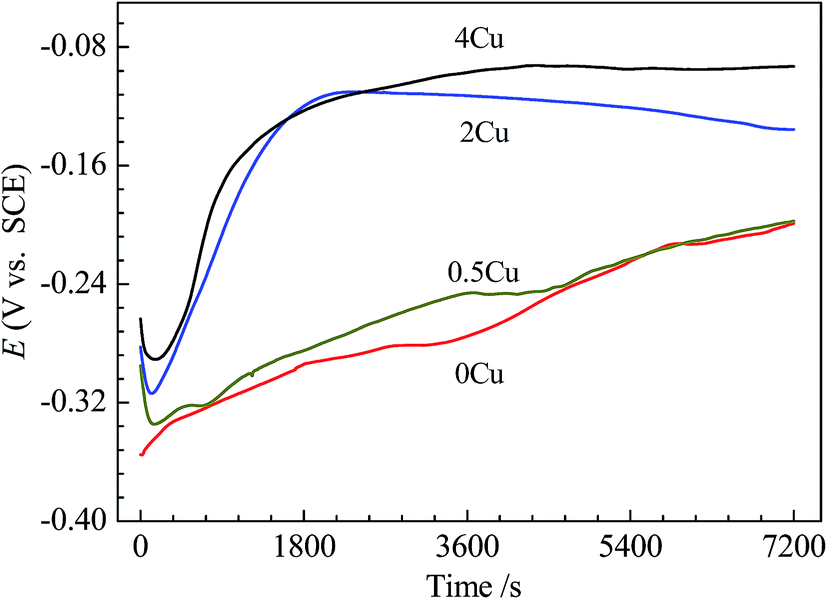 | ||
| Fig. 3 The time evolutions of the open-circuit potential for 0Cu, 0.5Cu, 2Cu, and 4Cu before polarization tests. | ||
3.3. EIS measurements
EIS measurements are carried out at open-circuit potential in 3.5 mass% aerated NaCl solution at room temperature. The obtained impedance responses are presented in the forms of Nyquist and Bode as shown in Fig. 4(a–c). From Fig. 4(a), all alloys display similar impedance features, and each Nyquist plot is characterized by a common capacitive semicircle in high frequency region and a depressed capacitive semicircle in low frequency region. The phase angle vs. frequency plot illustrated in Fig. 4(b) reveals two apparent peaks from high frequency to low frequency, suggesting the occurrence of at least two electron transfer reactions in interface.23,24 The Bode magnitude plots illustrated in Fig. 4(c) suggest that 4Cu exhibits the most superior corrosion resistance, with a higher impedance compared to other alloys.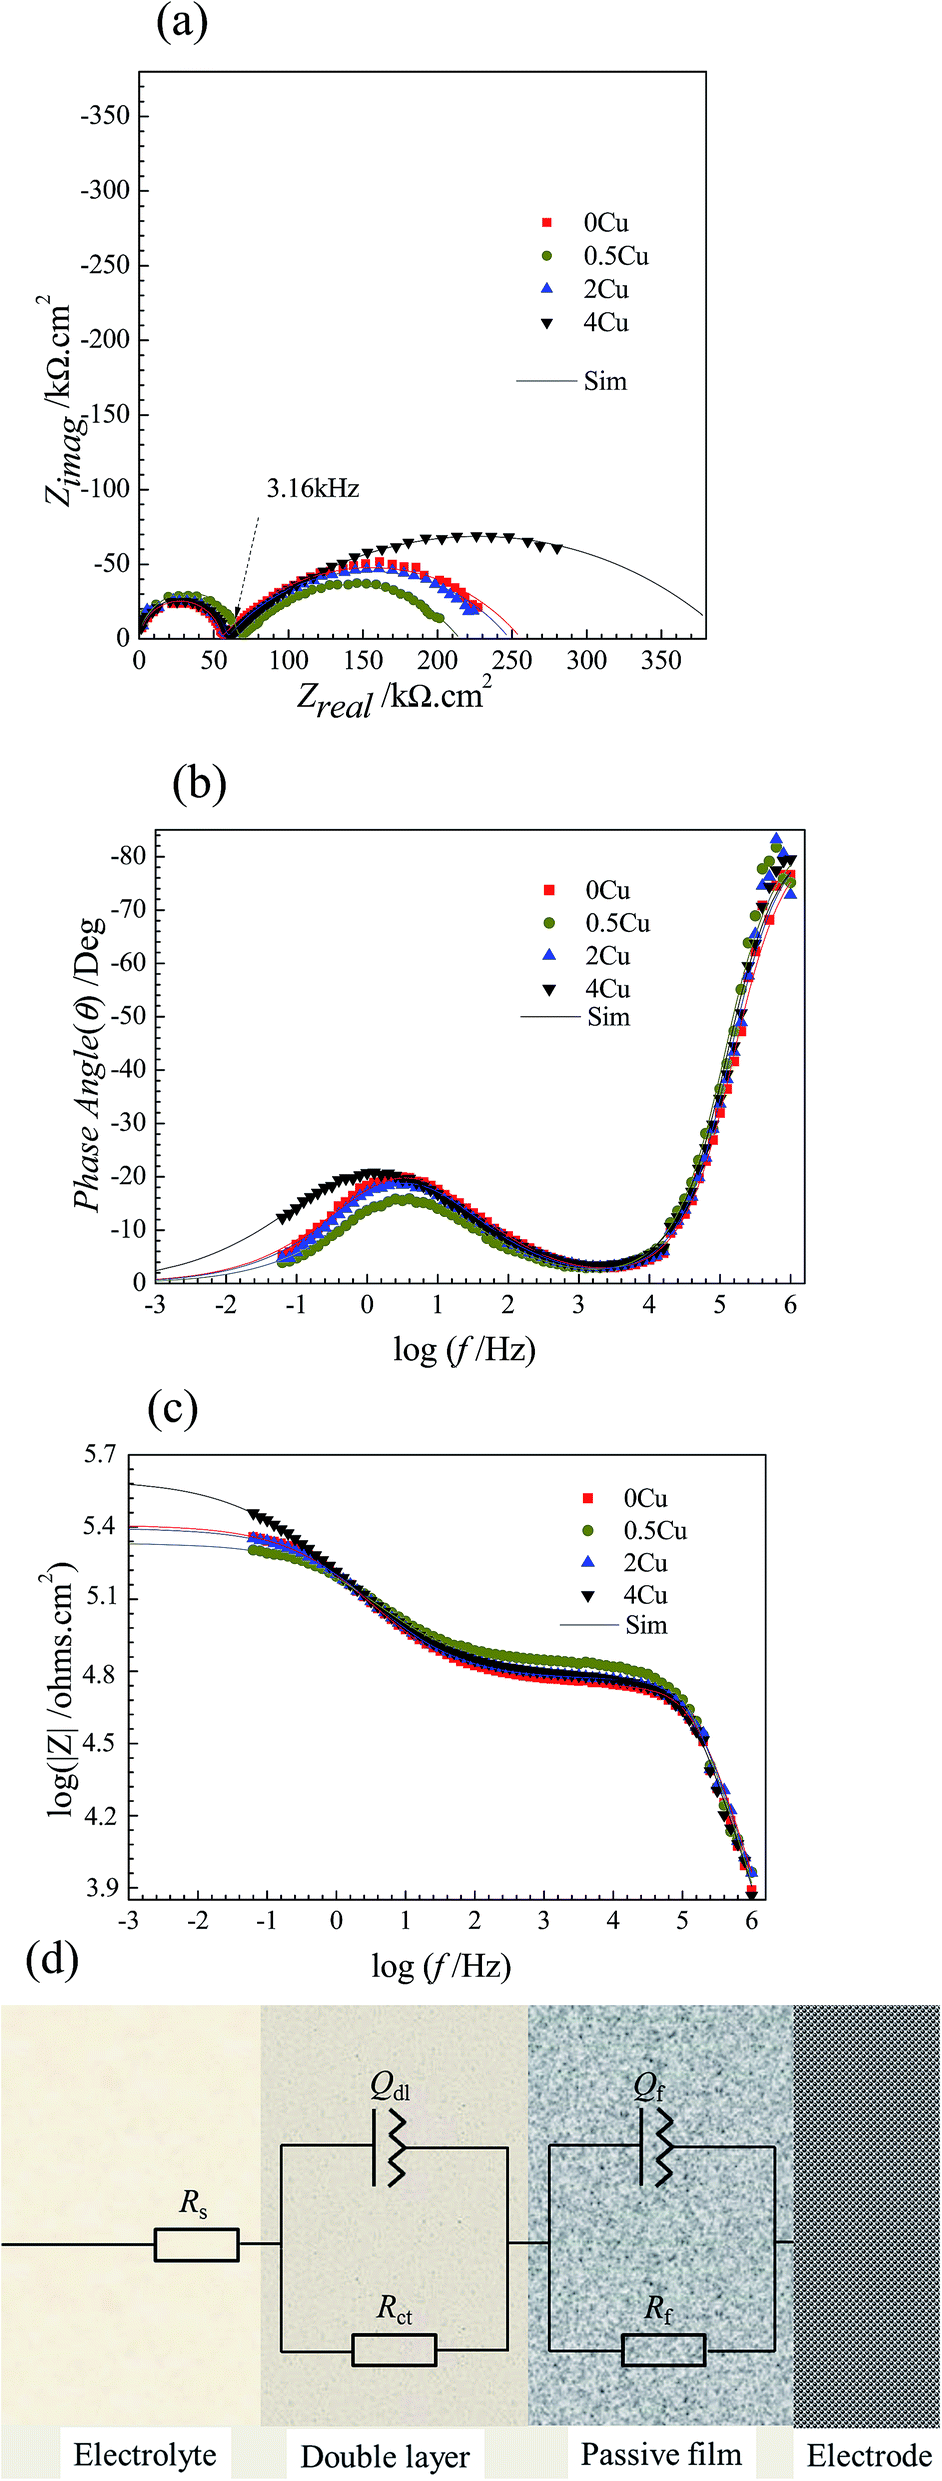 | ||
| Fig. 4 Impedance diagrams for NiCoCrMo alloys with various Cu additions in 3.5 mass% aerated NaCl solution at room temperature: (a) Nyquist plots, (b) Bode phase angle plots, (c) Bode magnitude plots, (d) equivalent circuit model proposed for the fitting of EIS spectra. | ||
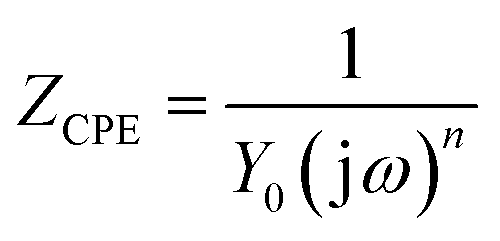
Following the EIS results, the equivalent circuit model in present condition is schematically shown in Fig. 4(d).25–27 Table 1 summarizes the values in fitting the aforementioned curves (Fig. 4(a–c)) by using present circuit model in Fig. 4(d). Here, Rs represents the electrolyte resistance, Rct and Qdl represent the charge transfer resistance and the pseudo-capacitance of the double layer, respectively. Rf and Qf represent the resistance and the pseudo-capacitance of the passive film, respectively. Constant phase element (CPE, Q) rather a capacitance element (C) is chosen to fit the depressed semicircle, owing to the existence of dispersion effect.23,24 The impedance of CPE is described as follows:
 | (1) |
| Specimens | Solution | Double layer | Passive film | χ2 (×10−3) | ||||
|---|---|---|---|---|---|---|---|---|
| Rs (Ω cm2) | Y0dl (pF cm−2 sn−1) | ndl | Rct (kΩ cm2) | Y0f (μF cm−2 sn−1) | nf | Rf (kΩ cm2) | ||
| 0Cu | 8.5 ± 1.5 | 39.72 ± 0.5 | 0.95 ± 0.01 | 54.69 ± 2.5 | 1.89 ± 0.2 | 0.56 ± 0.01 | 201.59 ± 13.1 | 0.18 ± 0.05 |
| 0.5Cu | 6.7 ± 3.1 | 38.95 ± 1.3 | 0.95 ± 0.01 | 60.76 ± 1.8 | 1.89 ± 0.4 | 0.57 ± 0.01 | 149.30 ± 25.7 | 0.22 ± 0.03 |
| 2Cu | 6.2 ± 2.6 | 37.32 ± 0.8 | 0.95 ± 0.01 | 58.41 ± 1.0 | 1.89 ± 0.3 | 0.57 ± 0.02 | 190.11 ± 21.3 | 0.23 ± 0.02 |
| 4Cu | 7.5 ± 1.9 | 42.46 ± 0.7 | 0.95 ± 0.01 | 58.10 ± 1.7 | 2.70 ± 0.4 | 0.49 ± 0.01 | 337.58 ± 17.6 | 0.2 ± 0.06 |
From Table 1, we can find that with, Rf becomes lower for 0.5Cu compared to 0Cu, and then turns higher with increasing Cu content, which are 201.59, 149.30, 190.11, 337.58 kΩ cm2, for 0Cu, 0.5Cu, 2Cu, and 4Cu, respectively. Rct is observed independent of Cu content but much lower than Rf in all alloys, suggesting that Rf takes a larger part than Rct in impedance. No obvious difference is observed in other parameters for all alloys. Moreover, 0.5Cu exhibits lower corrosion resistance under EIS measurement, as a smaller pseudo-capacitive arc is observed for 0.5Cu compared to 0Cu in low frequency region. 4Cu performs best with the largest polarization resistance, characterized by the largest pseudo-capacitive arc as shown in Fig. 4(a).
3.4. Potentiodynamic polarization behavior
Fig. 5 shows the polarization curves of the four specimens in 3.5 mass% aerated NaCl solution, with a locally enlarged drawing from 0.65 V (SCE) to 0.95 V (SCE) inserted. We consider the valleys of the curves as the corresponding corrosion potentials (Ecorr). The cathodic Tafel slopes (βc) are obtained from linear fittings of cathodic polarization Tafel region. Based on corrosion potentials (Ecorr) and cathodic Tafel slopes (βc), corrosion current densities (Icorr) are calculated. These parameters from polarization curves are listed in Table 2.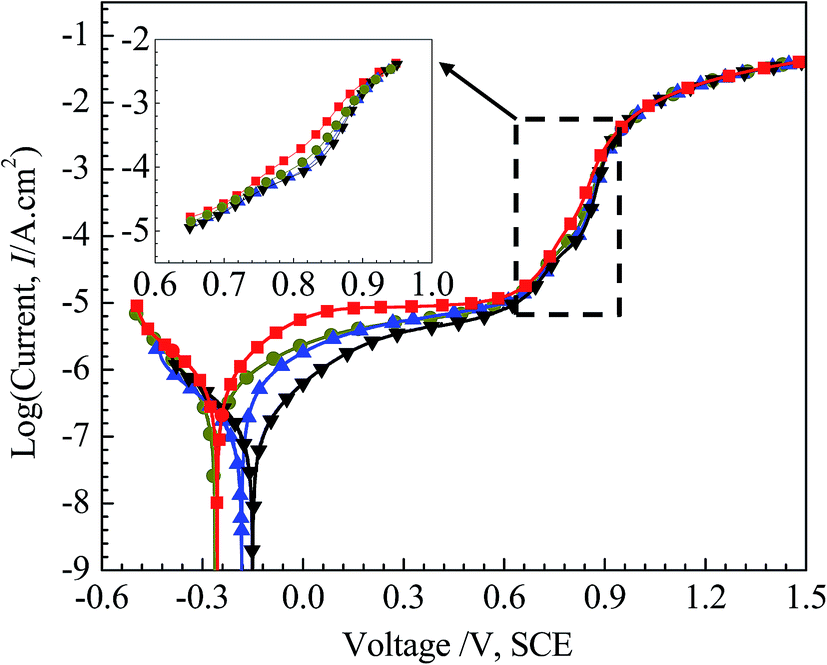 | ||
| Fig. 5 Polarization curves in 3.5 mass% aerated NaCl solution at room temperature of: 0Cu, 0.5Cu, 2Cu, and 4Cu. | ||
| Specimens | βc (V dec−1) | Ecorr (vs. SCE, mV) | Icorr (μA cm−2) |
|---|---|---|---|
| 0Cu | 0.21 ± 0.01 | −256.4 ± 20.30 | 0.46 ± 0.03 |
| 0.5Cu | 0.22 ± 0.01 | −263.4 ± 13.78 | 0.51 ± 0.06 |
| 2Cu | 0.20 ± 0.01 | −183.1 ± 10.34 | 0.32 ± 0.04 |
| 4Cu | 0.21 ± 0.01 | −151.2 ± 8.57 | 0.14 ± 0.05 |
Given that 3.5 mass% aerated NaCl solution contains low concentration of H+, oxygen reduction reaction:
| O2 + 2H2O + 4e− = 4OH− | (2) |
There is no obvious change in the macroscopic views of either the electrode surface or the solution prior to the transpassive period in all alloys. From approximately 0.75–0.8 V (SCE) onwards, the working electrode surface turns from the initial bright silver to hazy, finally distinct yellow after polarization tests. The solution turns yellow gradually, which is probably due to the dissolved CrO42− ions.31 Meantime, small bubbles start to appear on the counter electrode Pt for all specimens via oxidation of water and these curves overlap each other without other apparent difference in all alloys. No significant difference for all alloys is observed, except that the voltage for the working electrode surface turning into yellow is increasing slightly with Cu addition increasing.
From Fig. 5, it can be seen that the four curves behave in a similar trend, and no obvious transition of active–passive region is observed for all alloys, possibly due to spontaneous passivation.32,33 With increasing applied potential, all alloys experience a transition from passive region to transpassive region, and the polarization curves overlap each other gradually. Current density decreases with incremental Cu content in passive region, implying the passive film becomes more uniform and compact ascribed to Cu. The increase of current density for Cu-containing alloy along with potential over the range of 0.75 V (SCE) to 0.9 V (SCE) appears to be retarded compared to 0Cu, although this change is not significant enough with various Cu contents. This can be clearly observed in the amplified figure inserted in Fig. 5. And this phenomenon always exists when we reproduced these experiments.
3.5. SEM and 3D laser scanning microscopy (LSM) analysis
Fig. 6 shows the surface morphologies of the four specimens after being polarized in 3.5 mass% aerated NaCl over different potentials. No obvious difference in the surface of alloys could be identified. At passive region, 0.5 V (SCE), all the surfaces appear as same as that of the initial 800#-polished specimens, possibly owing to the very thin passive film formed for all alloys. At 0.83 V (SCE) in the passive–transpassive transition region, all the specimen surfaces appear slightly corroded and are characterized by fine flocculent particles along the original grinding scratches, and no obvious pitting corrosion is observed throughout the specimen surfaces. During transpassive region (0.95 V, SCE), all specimen surfaces become significantly different from that at lower voltages, characterized by large number of film cracks after drying. The grinding scratches also become indistinguishable.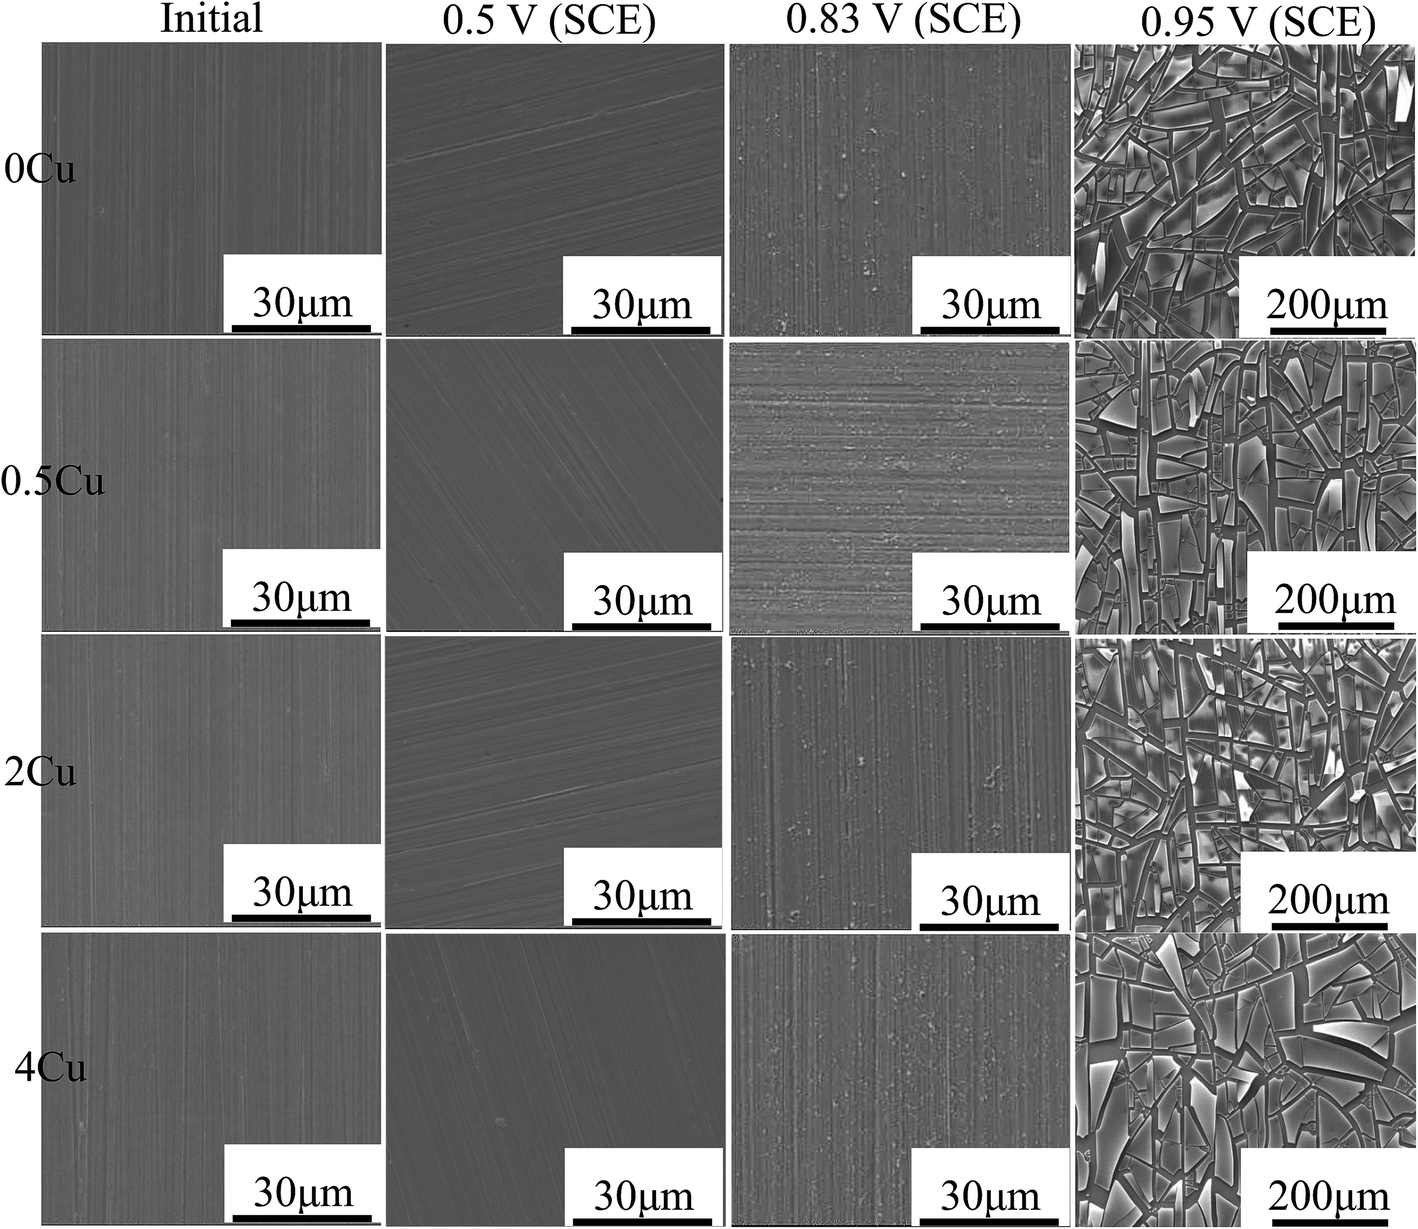 | ||
| Fig. 6 SEM micrographs of 0Cu, 0.5Cu, 2Cu, and 4Cu in 3.5 mass% aerated NaCl solution at room temperature at 0 V (SCE), 0.5 V (SCE), 0.83 V (SCE), 0.95 V (SCE), respectively. | ||
We used LSM to evaluate the surface profiles of specimen after polarization tests, as well as the corresponding height distributions along the red horizontal dashed lines as shown in Fig. 7. Consistent with the results of SEM, occurrence of cracks in the film of all samples could be observed after drying, giving rise to lower height in crack regions and higher height in the non-crack region. The cracks of film occur most likely along grain boundaries and annealing twinning boundaries as marked by yellow and green dashed lines respectively in Fig. 7(d), since both the size and shape of the enclosed areas by cracks are very close to that of grains and annealing twins (Fig. 2). With increasing Cu content, the width of cracks seems to become narrower, implying the more compact film with higher crack resistance with Cu addition. This is especially obvious in alloy with high Cu content (≥2%).
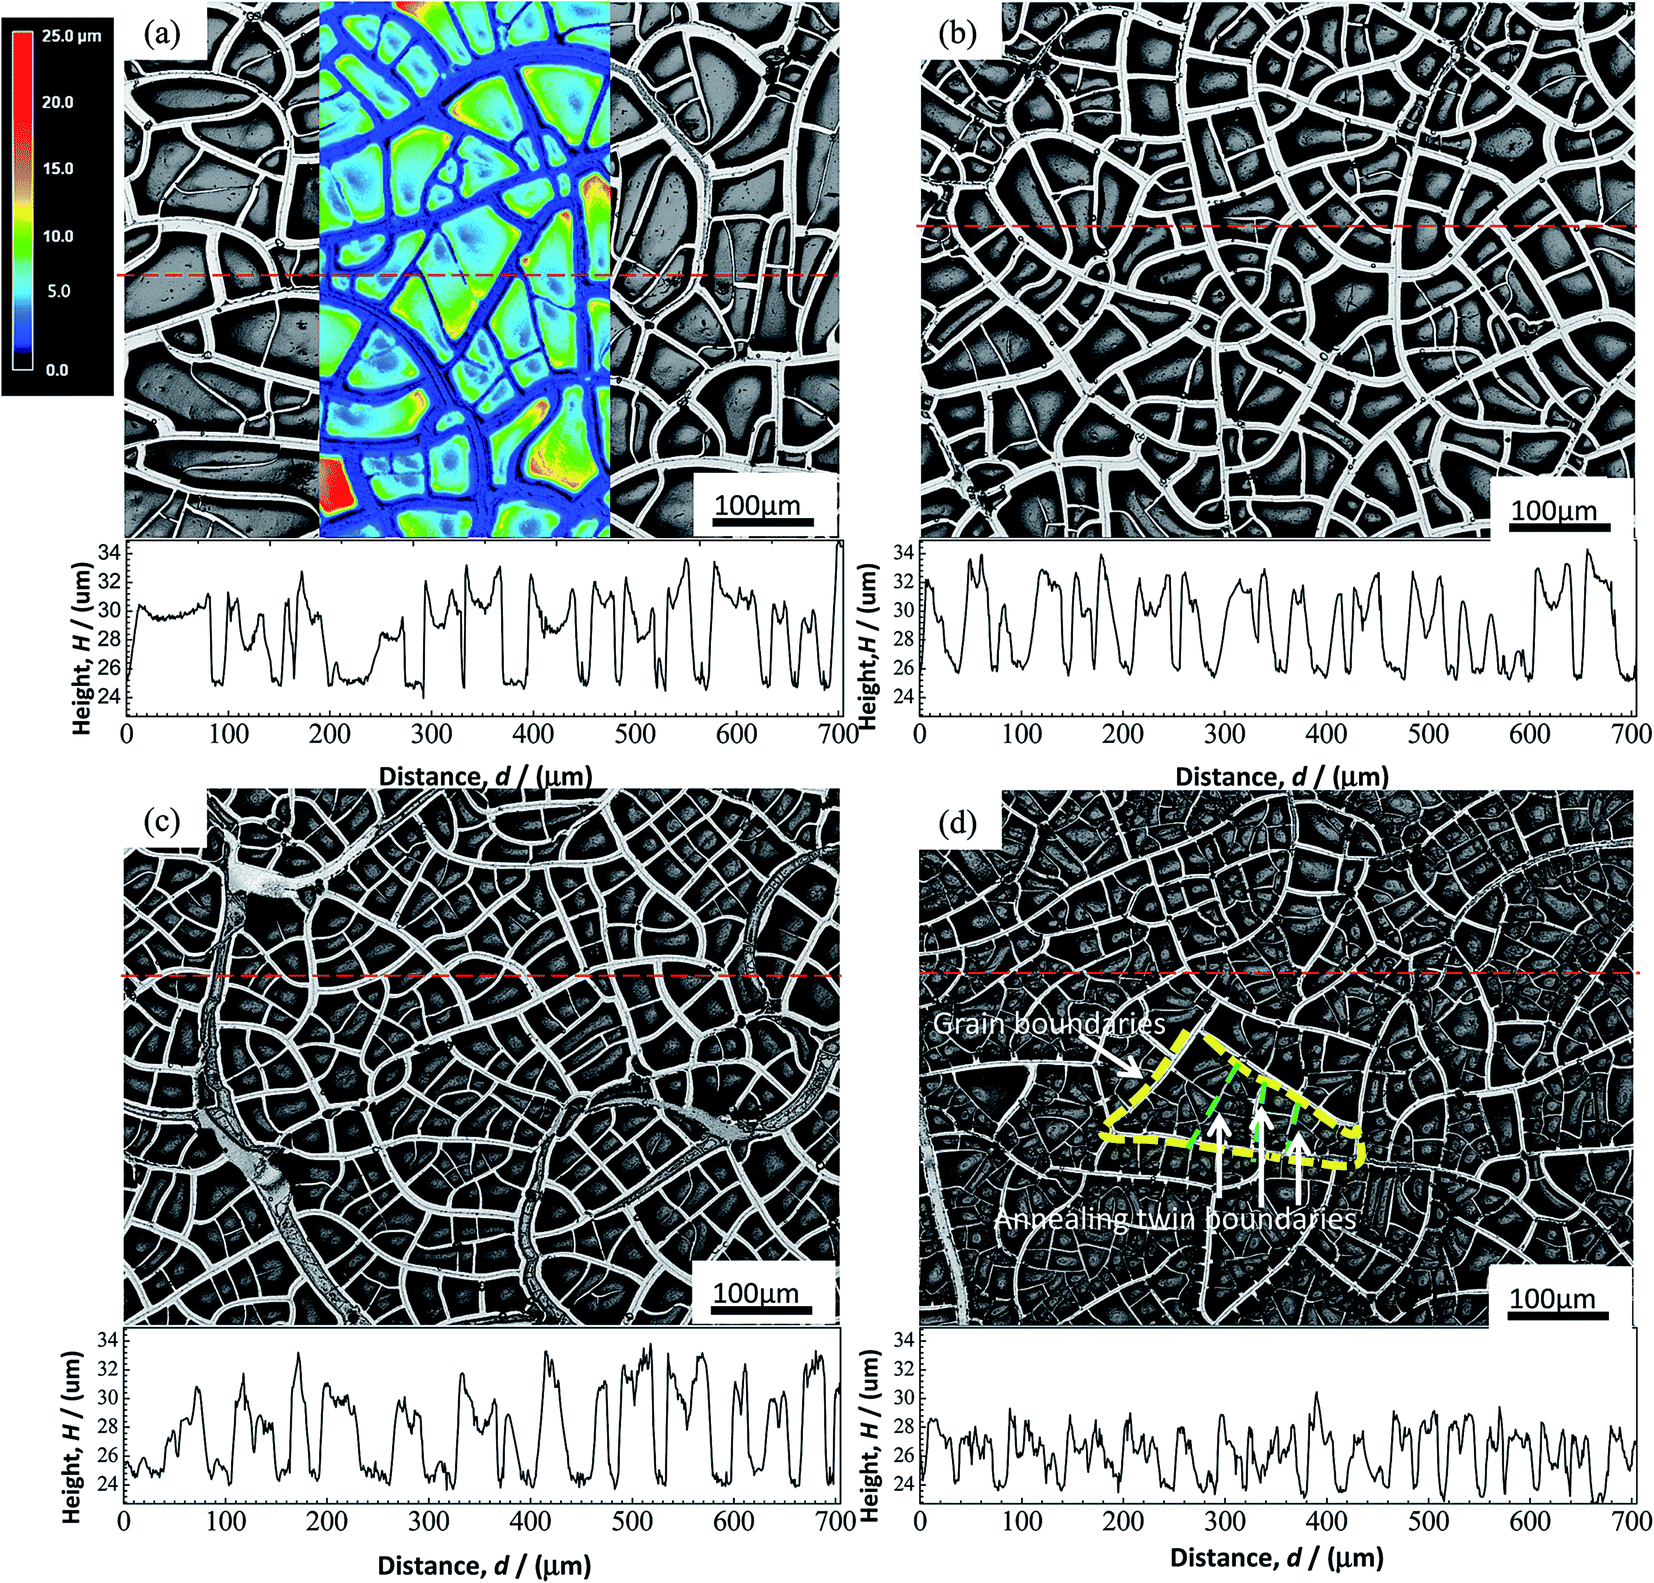 | ||
| Fig. 7 Surface morphologies as well as the corresponding height distribution of specimen surface along the red horizontal dashed line of (a) 0Cu, (b) 0.5Cu, (c) 2Cu, (d) 4Cu after polarization at 1.5 V (SCE) in 3.5 mass% NaCl solution at room temperature. | ||
We choose the mean height difference H between the non-crack regions (peak point in the height curves) and the crack regions (valley of the height curves) of ten random points each in Fig. 7 to represent the mean height of film. With increasing Cu content, H as a function of Cu content is quantitatively showed in Fig. 8. It can be observed that H becomes obviously lower with increasing Cu content, implying the thinner films formed in alloy with higher Cu content.
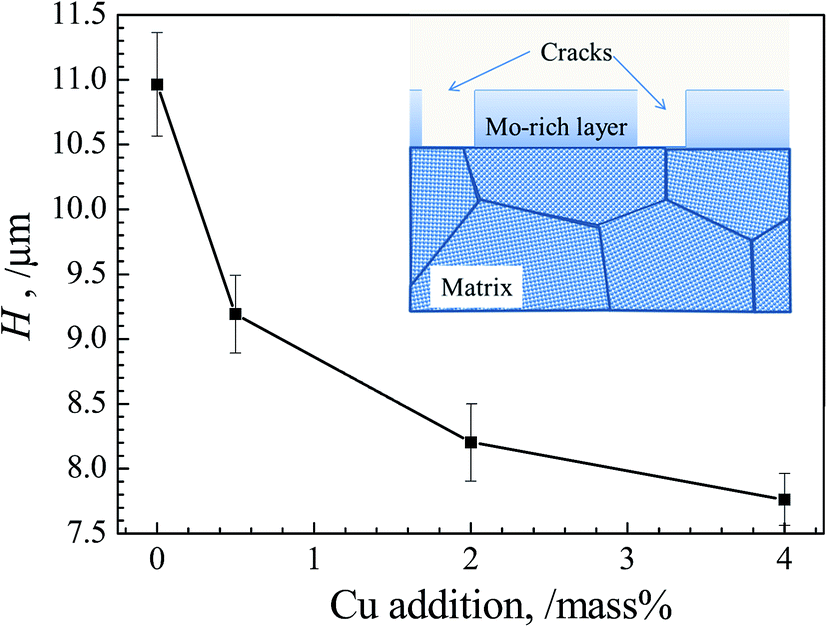 | ||
| Fig. 8 Evolutions of mean height difference H of alloy with various Cu additions. The schematic illustration of corroded surface vertically is also inserted. | ||
3.6. EDS and XPS analysis
The chemical compositions of the specimen surfaces after polarization to various potentials, obtained from EDS analysis, are shown in Fig. 9. From Fig. 9(a–d), all specimen surfaces display similar variations for all the monitored elements in the passive region (0.5 V (SCE)), with Cu, Cr, Mo increasing, and Ni, Co, Fe decreasing, suggesting that Cr, Cu and Mo, play a significant role in passivation herein, consistent with the work of Jakupi et al.34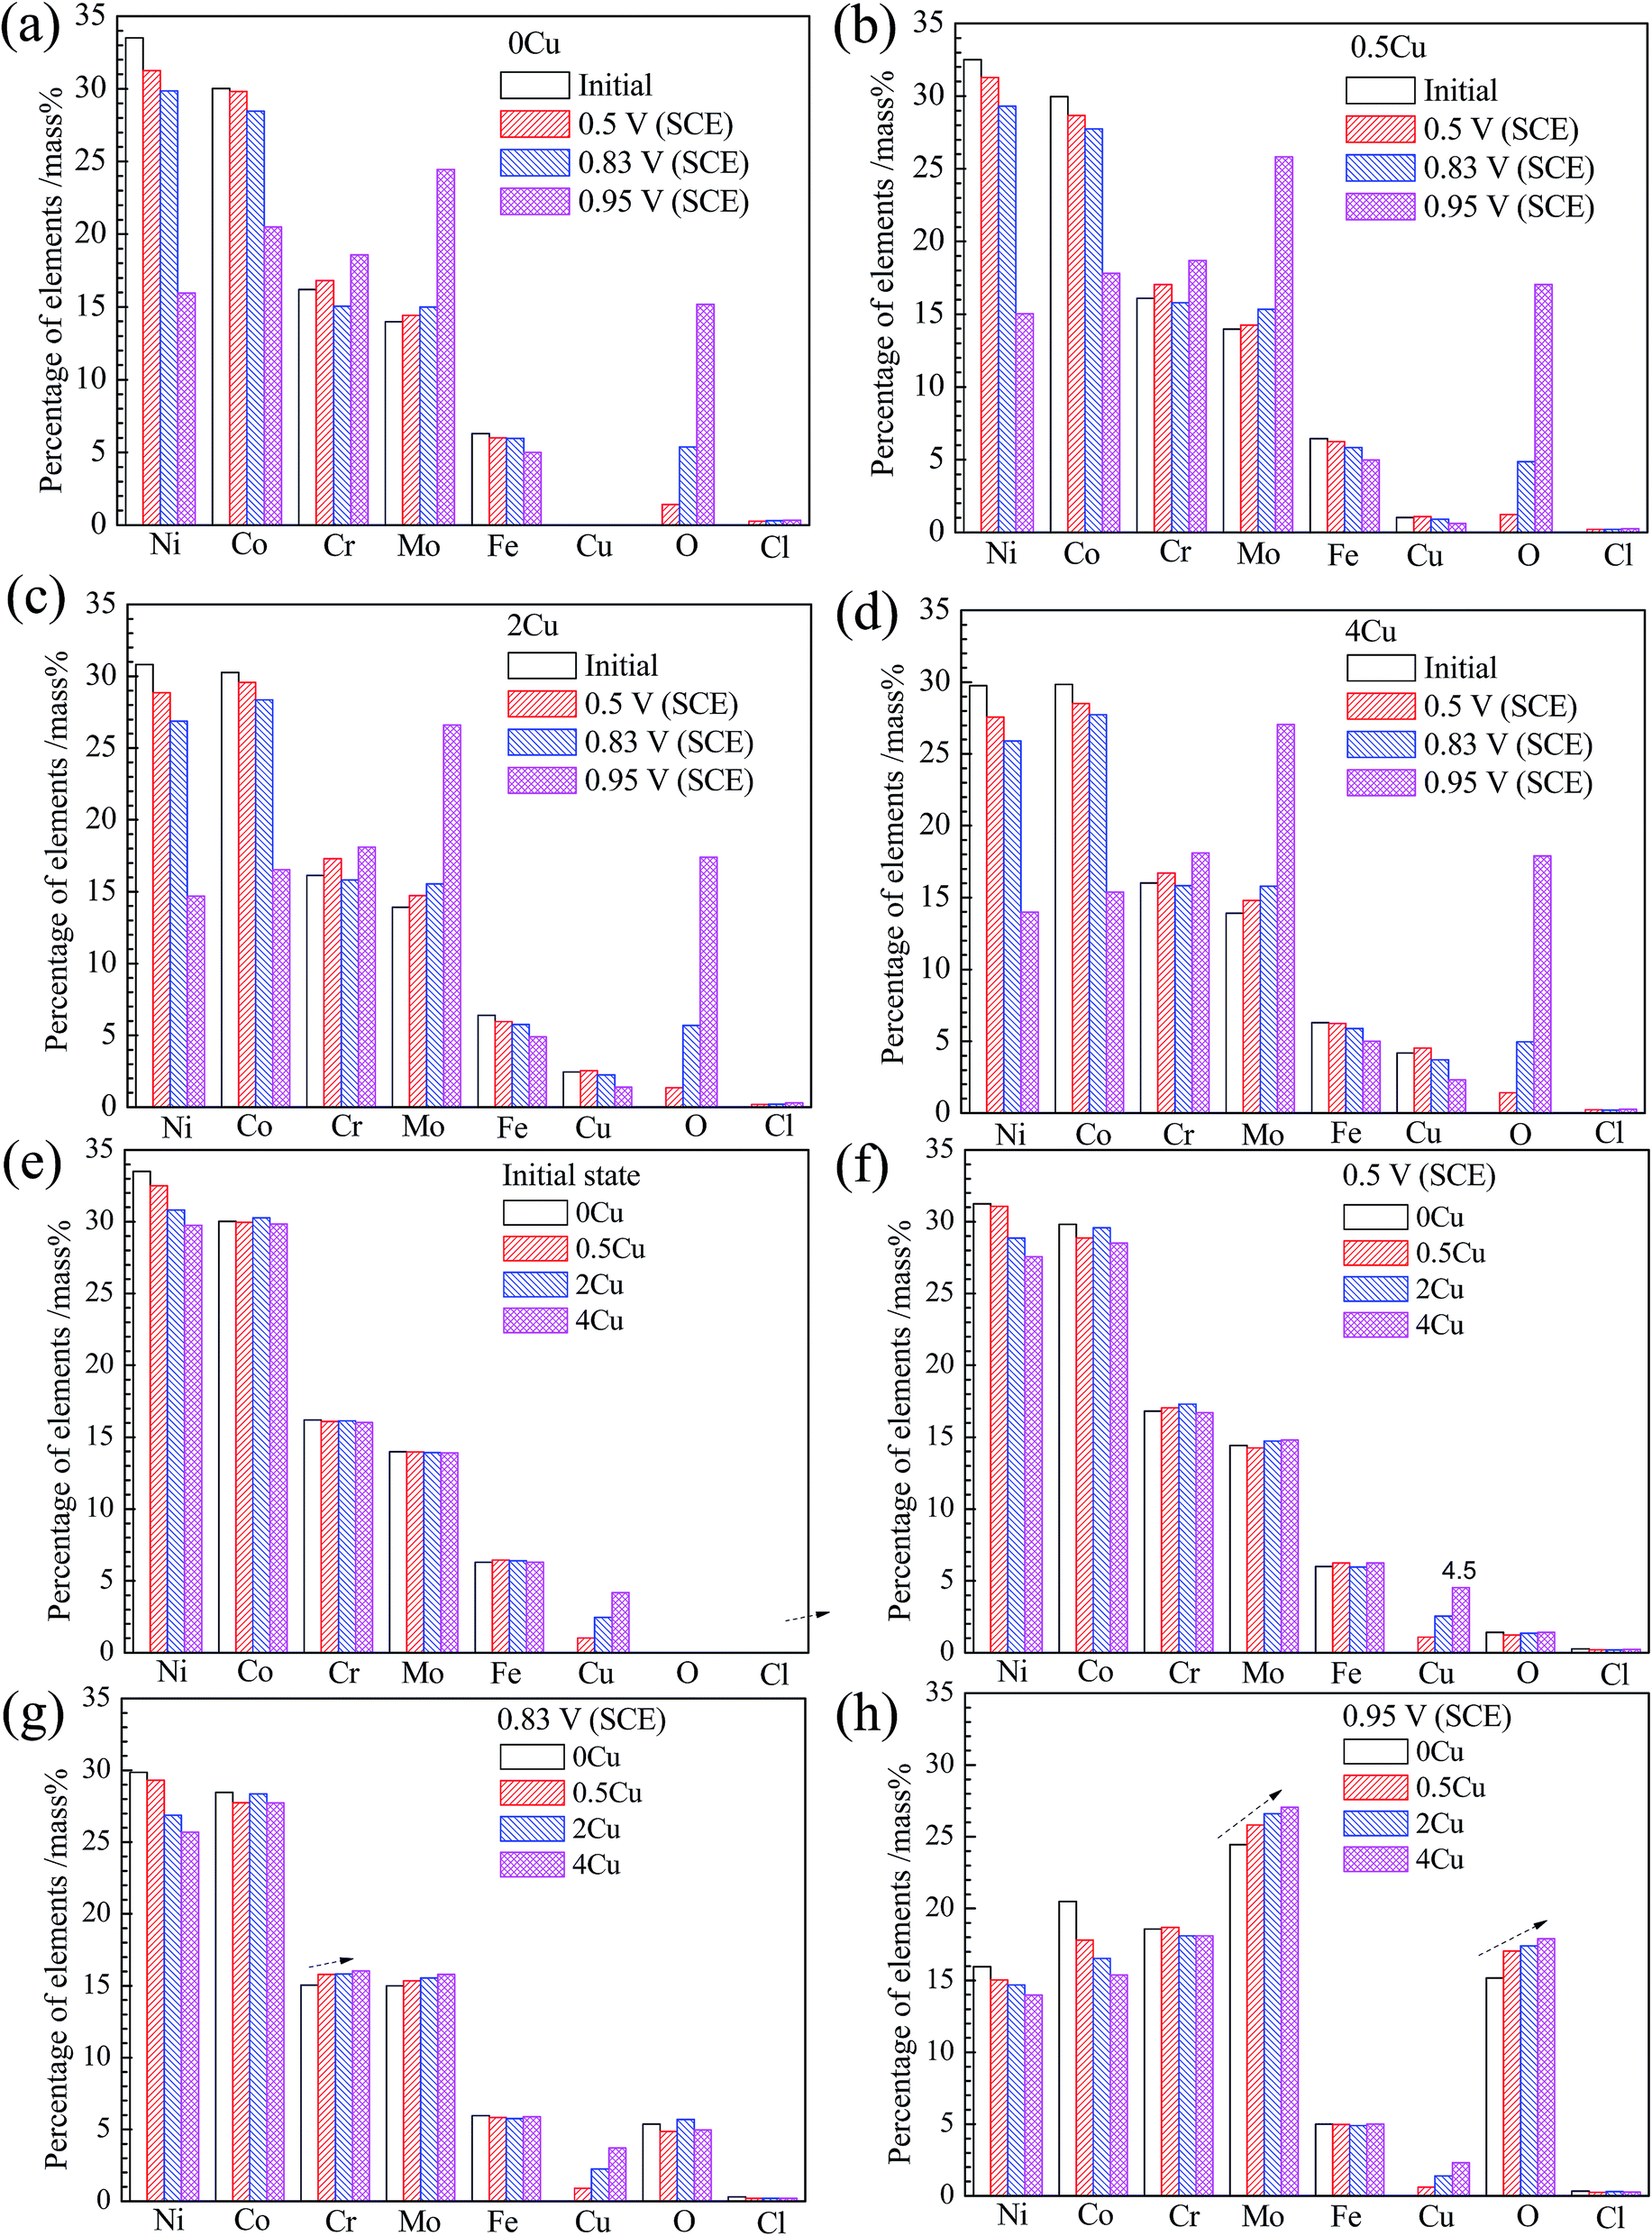 | ||
| Fig. 9 EDS analysis of NiCoCrMo alloys in 3.5 mass% aerated NaCl solution at room temperature, in theirs initial states and polarization at different potentials: (a) 0Cu, (b) 0.5Cu, (c) 2Cu, (d) 4Cu, and at specific potentials with Cu content increasing: (e) initial states, (f) 0.5 V (SCE), (g) 0.83 V (SCE), (h) 0.95 V (SCE). | ||
For a given Cu content, during the passive–transpassive transition region (0.83 V (SCE)), a clear decrease of Cr content is observed compared to that in passive region, which is possibly related with the transformation from Cr(III) to more soluble Cr(VI). However, with Cu content increasing, the dissolution of Cr element at 0.83 V (SCE) seems to be delayed, since the content of Cr in film of Cu-containing alloys is much larger (Fig. 9(g)). Likewise, Mo content is also increasing at 0.83 V (SCE) with Cu content increasing. This occurred concurrently with the current densities evolution in the local enlarged drawing of Fig. 5.
While from the transpassive region onwards at 0.95 V (SCE), apart from the drastic decrease in Ni and Co contents, pronounced increases in Mo, O and Cr contents are observed for all specimens. From Fig. 9(h), Mo content increases substantially at 0.95 V (SCE) along with Cu addition, implying that Cu addition plays an important role in inhibiting the dissolution of Mo.
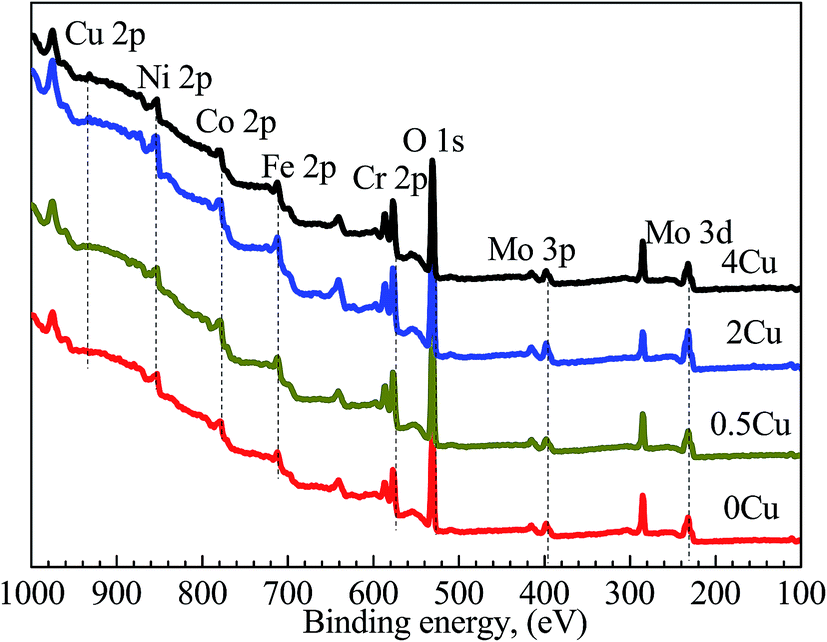
The XPS analyses, which are used to probe the element distributions of specimen surfaces in passive region (0.5 V (SCE)) in 3.5 mass% aerated NaCl solution at room temperature, are shown in Fig. 10. The peaks for Cu 2p, Ni 2p, Co 2p, Cr 2p, Fe 2p, Mo 3p, and Mo 3d can be clearly observed in all alloys at binding energies of 932, 852, 779, 574, 713, 400 and 230 eV, respectively.35 In addition, an intense O 1s peak can be observed in all samples at 530 eV, indicating the existence of extensive oxides or their hydrates on the surface.
 | ||
| Fig. 10 XPS survey scans acquired from the outer surfaces of 0Cu, 0.5Cu, 2Cu, and 4Cu at 0.5 V (SCE). | ||
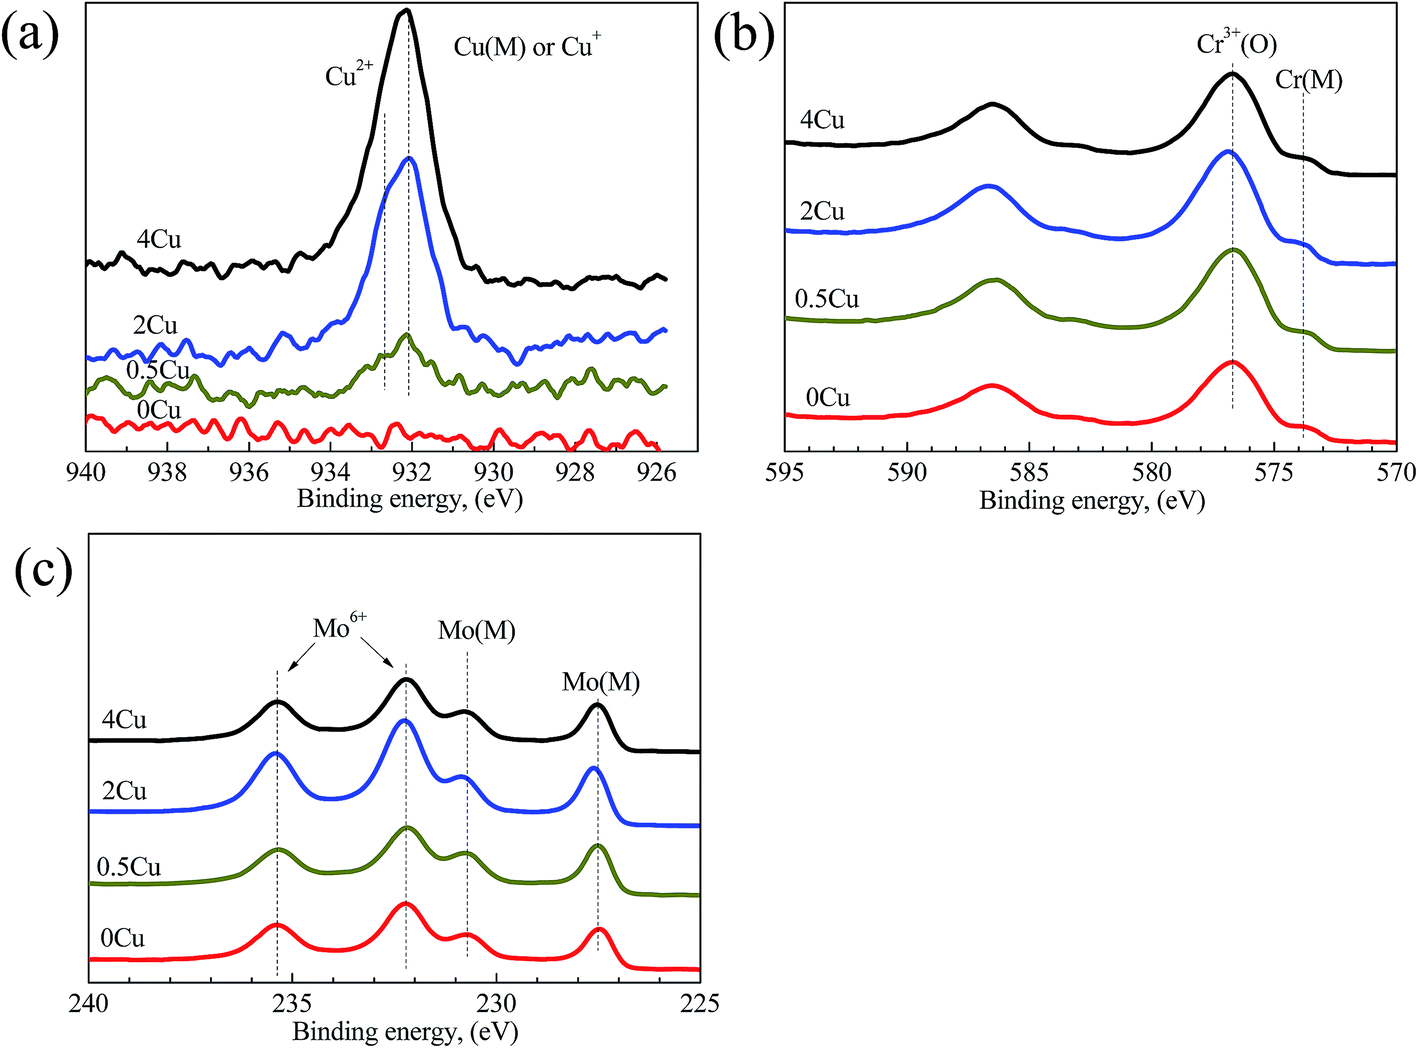
The Cu 2p, Cr 2p, and Mo 3d spectra of the same specimens, but recorded at a higher resolution, are shown in Fig. 11(a–c), respectively. The spectral peaks are deconvoluted to show the contributions of metallic and/or oxide states,35 and demonstrate detailed information on them. For example, the metallic and oxide peaks for Cr and Mo are extremely strong. The Cu 2p peak turns stronger with increasing Cu content, and is identified as Cu2+ and Cu1+ or metallic Cu in Cu-containing specimens. Considering its relatively low concentration in the alloys, Cr 2p peak shows high intensities in the spectra, which is consistent with the EDS results (Fig. 9) that the concentration of Cr in the passive film is much higher than that in the matrix. Considering there is no obvious difference on Ni, Co, Cl, and O with Cu content increasing, their spectra aren't shown herein.
 | ||
| Fig. 11 XPS regional scan spectra acquired from the outer surfaces of 0Cu, 0.5Cu, 2Cu, and 4Cu at 0.5 V (SCE). The spectra corresponding to (a) Cu 2p, (b) Cr 2p, (c) Mo 3d are shown. | ||
Concentrations of constituent elements on the passive films of all alloys determined from XPS regional spectra are shown in Fig. 12. From Fig. 12(a), the concentrations of Ni and Co in passive film are much lower than those in bulk, implying the instability of these two elements in all alloys. On the contrary, Cu, Cr and Mo are enriched in film, which is consistent with the EDS results (Fig. 9). Cr takes a largest portion of passive film among these elements, about 35 mass%, suggesting its significant impact on the passivation of alloys studied. This also indicates the destroy of Cr(III) oxide is fatal to passive film. Mo also exerts its role in enhancing the passivation of alloys. Cu segregates in the passive film with Cu concentration much higher than that in bulk distinctly shown by Fig. 12(b). Furthermore, a more significant increase of Cu in passive film occurs accompanying with its increasing content.
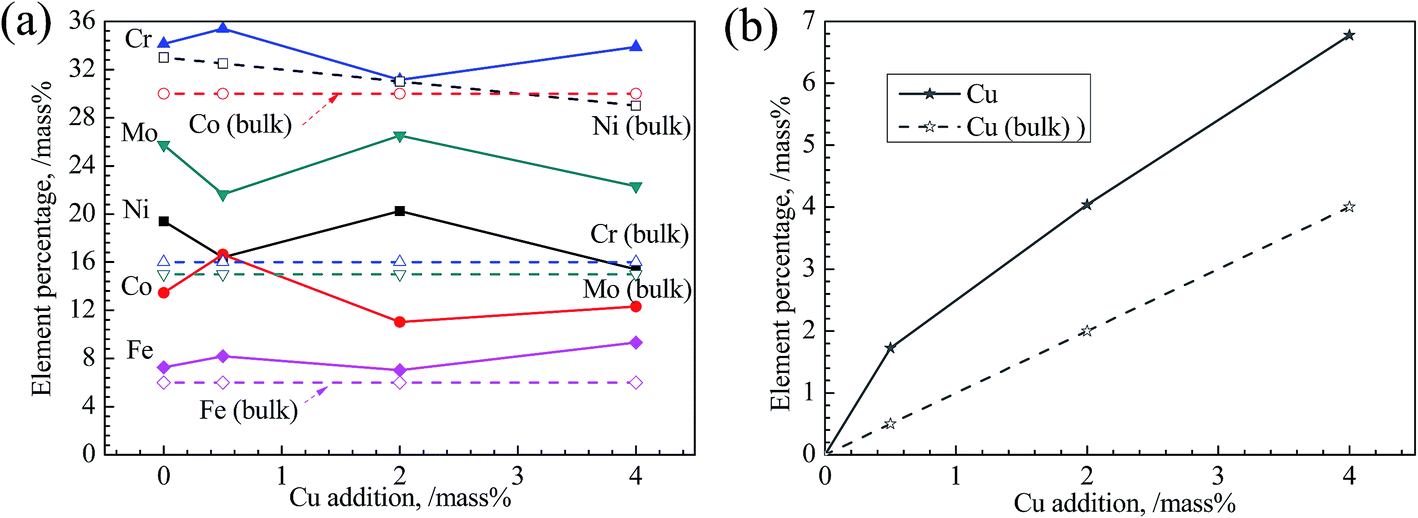 | ||
| Fig. 12 (a) Metal elemental percentages except Cu and (b) Cu elemental percentage of the outer surface obtained from XPS regional spectra as a function of Cu addition, with oxygen element and chlorine element removed and the left resynchronized. Note that it contains the percentages of various alloying elements in bulk (hollow symbol connected with dashed line). | ||
4. Discussion
From the results obtained, it is evident that Cu addition doesn't significantly change the initial microstructure. However, corrosion resistance of alloys is strongly influenced, as shown from Fig. 4 and 5. Moreover, Cu addition has weak influence on corroded surface morphology with applied potential, while Cu addition changes distinctly the element distribution on specimen surface as seen from Fig. 6, 9 and 12.Our researches show that both Cu and Cr segregate in the passive film from both EDS (Fig. 9) and XPS (Fig. 12) results (0.5 V, SCE). In addition, segregation of Cu in the passive film is observed in Cu-containing alloy, which becomes more distinct with increasing Cu content. Although it is difficult to confirm in the present condition, direct observation by Li et al. in hydrofluoric acid solution of similar alloy indicated that Cu layer forms on the outermost surface of passive film.36 Therefore, we assume that Cu enriches on the outermost surface as schematically illuminated in Fig. 13. Following this, the lower corrosion resistance of 0.5Cu compared to 0Cu is possibly attributed to galvanic corrosion from the non-uniformity of Cu layer's coverage on the outmost surface of passive film under open-circuit potential. It is well known that standard reduction potential of Cu is more positive than other metal elements in the present alloys.37 Thus, as indicated in Fig. 13, a galvanic cell will form between Cu and the film without coverage of Cu in electrolyte solution, possibly resulting in accelerated dissolution of passive film or matrix.
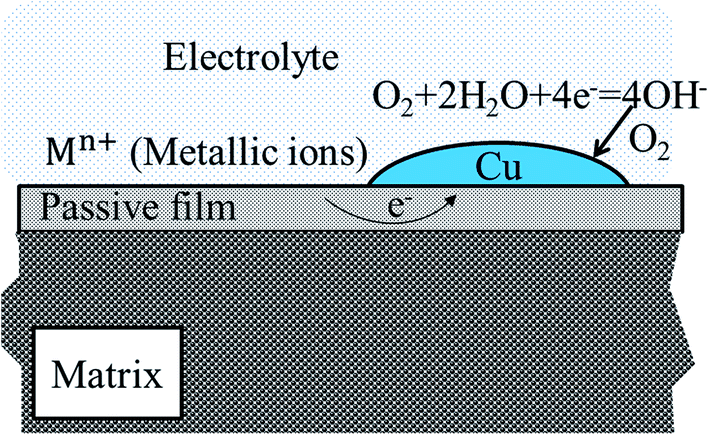 | ||
| Fig. 13 Schematic illumination of galvanic corrosion on Cu-containing alloys with supposing that Cu will segregate at the outermost surface around open-circuit potentials. | ||
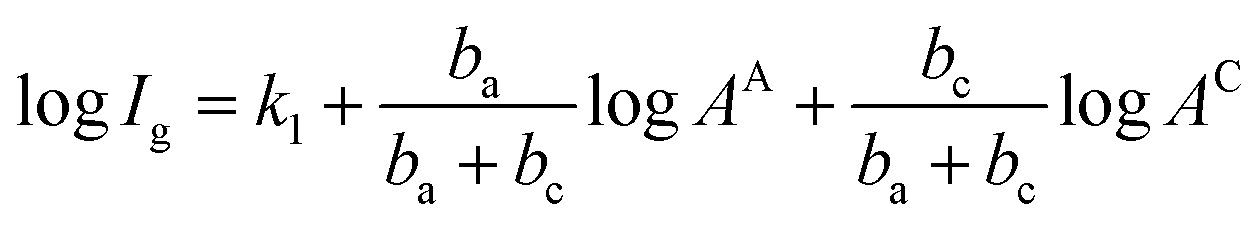
The influence of Cu coverage on film/matrix dissolution is dependent on the area ratio between I1C and I1U, the surfaces with and without Cu, respectively by:38
 | (3) |
 | (4) |
Then, I is introduced representing the apparent current density:
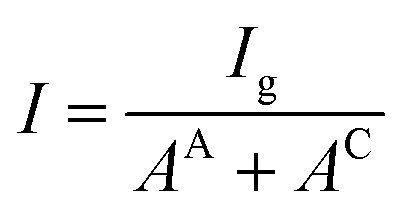 | (5) |
 | (6) |
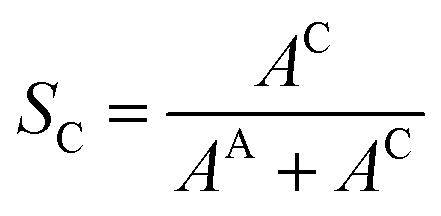 | (7) |
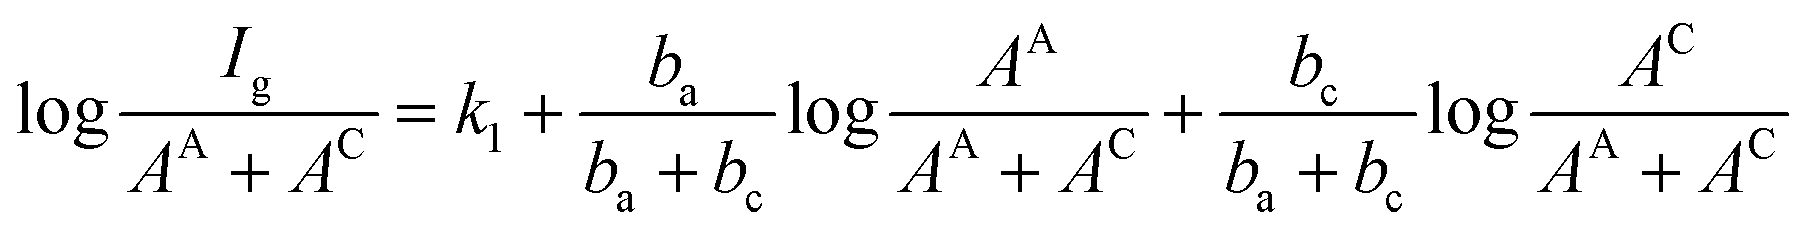
Therefore, eqn (4) can be rewritten as:
 | (8) |
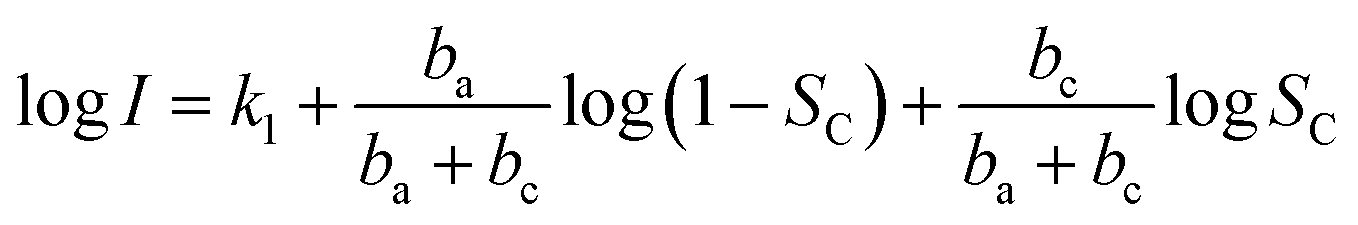 | (9) |
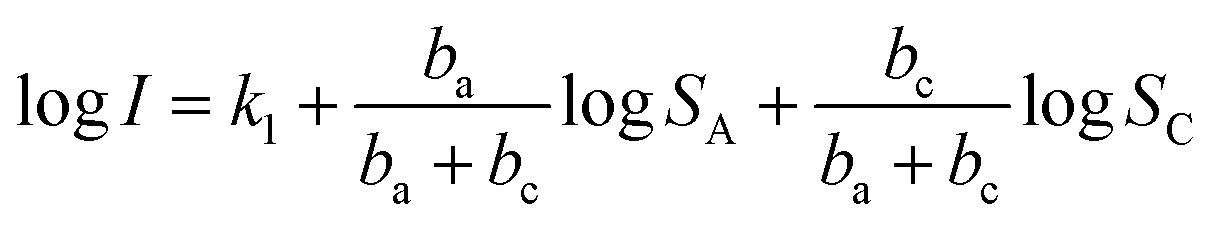
We take log![[thin space (1/6-em)]](https://www.rsc.org/images/entities/char_2009.gif) I a derivative on eqn (9) with respect to SC, it follows:
I a derivative on eqn (9) with respect to SC, it follows:
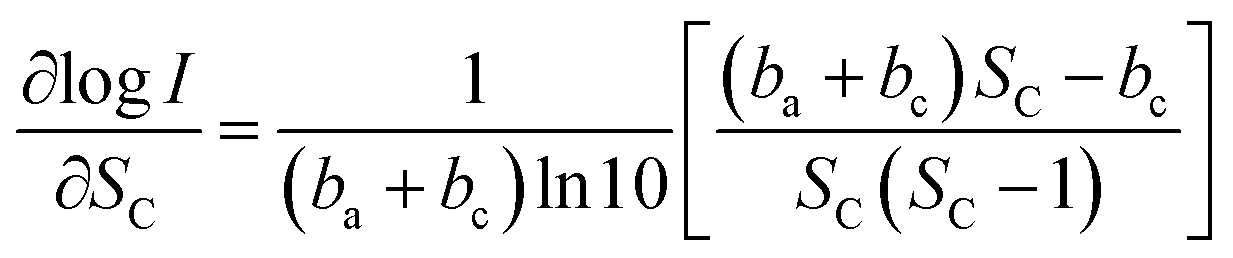 | (10) |
A maximum for logI, or I, will occur at
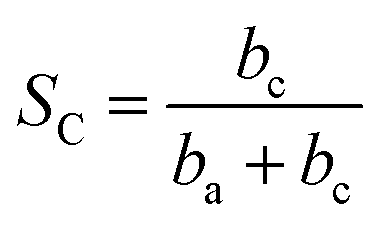 | (11) |
Thus, corrosion current density will be increased when SC is less than 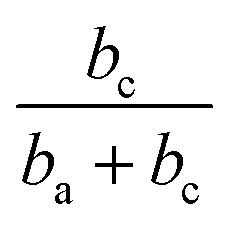 at first, and will be decreased when SC exceeds
  . This should be the reason that around open-circuit potential, 0.5Cu demonstrates lower corrosion resistance compared to 0Cu.
In contrast to the open-circuit potential test, 0.5Cu with higher corrosion resistance compared to 0Cu during polarization test, is possibly ascribed to the more uniform Cu distribution (increased SC) due to the accelerated dissolution–deposition of Cu by applied potential.19,39 Similarly, 2Cu shows comparable corrosion resistance to 0Cu at open-circuit potential and a notable improvement on corrosion resistance from Ecorr onwards. 4Cu exhibits the most outstanding corrosion resistance in 3.5 mass% aerated NaCl solution, owing to its high Cu addition.
In passive region, Cr element segregates in the passive film from Fig. 9 and 12(a), and plays an essential role in passivation. Present results, together with previous researches18,34,36 suggest that enrichment of Cu on the passive film will retard the dissolution of Cr2O3-rich layer at 0.83 V (SCE) during passive–transpassive transition. Besides, Cr element with a high energy of adsorption of oxygen ΔHads(ox) is expected to adsorb hydroxyls (OH−) strongly, and a low metal–metal bond energy εM–M is apt to enhance passivity, as suggested by Marcus et al.5
The oxidization of Cr(III) (mainly as Cr2O3) in the oxide film into more soluble Cr(VI) (CrO42−):
| Cr2O3 + 5H2O = 2CrO42− + 10H+ + 6e− | (12) |
As indicated in the EDS analysis during transpassive region at 0.95 V (SCE), Mo is the dominant component on the surface of all specimens (Fig. 9). Cu has also been reported to enhance the role of Mo in passivation of 17Cr steels as suggested by Lizlovs,41 which agrees well with our results. However, no specific explanation was given. Present results indicate that Mo concentration on the surface increases significantly with Cu addition in transpassive region (0.95 V (SCE)) as shown in Fig. 9, revealing the stabilizing effect of Cu on Mo in surface.
From Fig. 8, the film becomes more compact and homogeneous after polarization tests, and its thickness turns thinner with increasing of Cu addition, implying the hindrance effect of Cu on the extensive dissolution of the film. Similar phenomenon has been reported by Hao et al.,42 who suggest that 2 mass% Cu improves corrosion resistance of low alloy steel with thickness of film declining distinctly. Nevertheless, the influence of Cu on the transpassive behavior of NiCoCrMo alloy is non-significant, considering the little difference in sample surfaces and the overlapped polarization curves in alloys with various Cu contents as shown in Fig. 5.
5. Conclusion
The effects of Cu addition of 0–4% (mass%) on the corrosion resistance of NiCoCrMo alloy in 3.5 mass% aerated NaCl solution are investigated by electrochemical measurements, SEM, EDS, LSM and XPS at room temperature. The main conclusions are summarized as follows:Corrosion resistance of the alloys studied is greatly dependent of Cu element. 0.5Cu demonstrates lower corrosion resistance at low potential around Eocp, and improved corrosion resistance at higher potential. The improvement of corrosion resistance becomes more significant with increasing Cu content.
Cr plays a key role in forming the passive film in NiCoCrMo alloys. Meanwhile, the presence of Cu will hinder the extensive dissolution of Cr, ascribed to the rapid formation of a Cu-rich layer on the outmost Cr2O3 oxide film. Mo exerts its role by hindering the dissolution of metals by segregating to the surface in transpassive region.
Conflicts of interest
There are no conflicts to declare.Acknowledgements
The authors gratefully acknowledge the financial support from project of The Science Fund for Distinguished Young Scholars of Hunan Province, China (2016JJ1016), Fund of State Key Lab for Powder Metallurgy, Central South University, and the project of Innovation and Entrepreneur Team Introduced by Guangdong Province (201301G0105337290).References
- N. Ebrahimi, J. J. Noël, M. A. Rodríguez and D. W. Shoesmith, The self-sustaining propagation of crevice corrosion on the hydrid BC1 Ni-Cr-Mo alloy in hot saline solutions, Corros. Sci., 2016, 105, 58–67 CrossRef CAS.
- N. S. Zadorozne, M. C. Giordano, R. B. Rebak, A. E. Ares and M. R. Carranza, Anodic behavior of alloy 22 in bicarbonate media: effect of alloying, Procedia Mater. Sci., 2015, 8, 510–518 CrossRef.
- N. Priyantha, P. Jayaweera, D. D. Macdonald and A. Sun, An electrochemical impedance study of alloy 22 in NaCl brine at elevated temperature. I. Corrosion behavior, J. Electroanal. Chem., 2004, 572, 409–419 CrossRef CAS.
- D. D. Macdonald, A. Sun, N. Priyantha and P. Jayaweera, An electrochemical impedance study of alloy 22 in NaCl brine at elevated temperature. II. Reaction mechanism analysis, J. Electroanal. Chem., 2004, 572, 421–431 CrossRef CAS.
- P. Marcus, On some fundamental factors in the effect of alloying elements to passivation of alloys, Corros. Sci., 1994, 36, 2155–2158 CrossRef CAS.
- C. R. Clayton and Y. C. Lu, A bipolar model of the passivity of stainless steel: the role of Mo addition, J. Electrochem. Soc., 1986, 133, 2465–2473 CrossRef CAS.
- A. C. Lloyd, J. J. Noël, S. McIntyre and D. W. Shoesmith, Cr, Mo and W alloying additions in Ni and their effect on passivity, Electrochim. Acta, 2004, 49, 3015–3027 CrossRef CAS.
- Y. H. Hou, Y. P. Li, F. L. Wang, C. Zhang and Y. Koizumi, Influence of Mo concentration on corrosion resistance to HF acid solution of Ni-Co-Cr-Mo alloys with and without Cu, Corros. Sci., 2015, 99, 185–193 CrossRef CAS.
- T. Kawamura, S. Okada and J. I. Yamaki, Decomposition reaction of LiPF6–based electrolytes for lithium ion cells, J. Power Sources, 2006, 156, 547–554 CrossRef CAS.
- J. Aigueperse, P. Mollard, D. Devilliers, M. Chemla, R. Faron, R. Romano and J. Pierre Cuer, Fluorine Compounds, Inorganic, Ullmann's Encyclopedia of Industrial Chemistry, Wiley-VCH Verlag GmbH & Co, KGaA, 2000 Search PubMed.
- Y. H. Hou, Y. P. Li, E. Onodera, C. Zhang, Y. Koizumi and A. Chiba, Ex-situ observation on the dissolution behaviour of Ni-16Cr-15Mo and Ni-30Co-16Cr-15Mo alloys in hydrofluoric acid, Corros. Sci., 2015, 90, 133–139 CrossRef CAS.
- Y. P. Li, X. R. Fan, N. Tang, H. K. Bian, Y. H. Hou, Y. Koizumi and A. Chiba, Effects of partially substituting cobalt for nickel on the corrosion resistance of a Ni-16Cr-15Mo alloy to aqueous hydrofluoric acid, Corros. Sci., 2014, 78, 101–110 CrossRef CAS.
- Y. H. Hou, Y. P. Li, C. Zhang, N. Tang, Y. Koizumi and A. Chiba, Effects of cold working on corrosion resistance of Co-modified alloy Ni-16Cr-15Mo to hydrofluoric acid, Corros. Sci., 2015, 90, 133–139 CrossRef CAS.
- C. Zhang, Y. P. Li, Y. H. Hou, N. Tang, K. Ohmura, Y. Koizumi and A. Chiba, Corrosion resistance of Cu- and Fe-modified alloy Ni-16Cr-15Mo to hydrofluoric acid, Corros. Sci., 2014, 89, 81–92 CrossRef CAS.
- M. A. Amin, S. A. E. Rehim and A. S. El-Lithy, Corrosion, passivation and breakdown of passivity of Al and Al-Cu alloys in gluconic acid solutions, Electrochim. Acta, 2010, 55, 5996–6003 CrossRef CAS.
- E. E. Oguzie, J. B. Li, Y. Q. Liu, D. Chen, Y. Li, K. Yang and F. H. Wang, The effect of Cu addition on the electrochemical corrosion and passivation behavior of stainless steels, Electrochim. Acta, 2010, 55, 5028–5035 CrossRef CAS.
- T. Dieudonné, L. Marchetti, M. Wery, J. Chêne, C. Allely, P. Cugy and C. P. Scott, Role of Cu and aluminum additions on the hydrogen embrittlement susceptibility of austenitic Fe-Mn-C TWIP steels, Corros. Sci., 2014, 82, 218–226 CrossRef.
- X. G. Zhang, D. Zagidulin and D. W. Shoesmith, Characterization of film properties on the Ni-Cr-Mo alloy C-2000, Electrochim. Acta, 2013, 89, 814–822 CrossRef CAS.
- A. Pardo, M. C. Merino, M. Carboneras, F. Viejo, R. Arrabal and J. Muñoz, Influence of Cu and Sn content in the corrosion of AISI 304 and 316 stainless steels in H2SO4, Corros. Sci., 2006, 48, 1075–1092 CrossRef CAS.
- Q. F. Xu, K. W. Gao, W. T. Lv and X. L. Pang, Effects of alloyed Cr and Cu on the corrosion behavior of low-alloy steel in a simulated groundwater solution, Corros. Sci., 2016, 102, 114–124 CrossRef CAS.
- J. H. Hong, S. H. Lee, J. G. Kim and J. B. Yoon, Corrosion behaviour of Cu containing low alloy steels in sulphuric acid, Corros. Sci., 2012, 54, 174–182 CrossRef CAS.
- Thermo-Calc Software, Ni-based alloy database, TCW 5.0, http://www.thermocalc.com.
- C. N. Cao and J. Q. Zhang, An introduction to electrochemical impedance spectroscopy, Science Press, Beijing, 2002 Search PubMed.
- A. Lasia, Electrochemical Impedance Spectroscopy and Its Applications, Mod. Aspects Electrochem., 1999, 32, 143–248 CAS.
- F. Mohammadi, T. Nickchi, M. M. Attar and A. Alfantazi, EIS study of potentiostatically formed passive film on 304 stainless steel, Electrochim. Acta, 2011, 56, 8727–8733 CrossRef CAS.
- M. J. Hwang, E. J. Park, W. J. Moon, H. J. Song and Y. J. Park, Characterization of passive layers formed on Ti-10 wt% (Ag, Au, Pd, or Pt) binary alloys and their effects on galvanic corrosion, Corros. Sci., 2015, 96, 152–159 CrossRef CAS.
- J. Cassar, B. Mallia, A. Karl and J. Buhagiar, The effect of sliding onto the metal-electrolyte interface: studying model parameter modifications by means of EIS, Mater. Sci. Eng., C, 2017, 75, 1366–1375 CrossRef CAS PubMed.
- R. W. Zurilla, R. K. Sen and E. Yeager, The Kinetics of the Oxygen Reduction Reaction on Gold in Alkaline Solution, Chem. Informationsdienst, 1978, 125, 1103–1109 CAS.
- G. Kear, B. D. Barker and F. C. Walsh, Electrochemical corrosion of unalloyed copper in chloride media–a critical review, Corros. Sci., 2004, 46, 109–135 CrossRef CAS.
- S. Hiromoto, A. P. Tsai, M. Sumita and T. Hanawa, Effects of surface finishing and dissolved oxygen on the polarization behavior of Zr65Al7.5Ni10Cu17.5 amorphous alloy in phosphate buffered solution, Corros. Sci., 2000, 42, 2167–2185 CrossRef.
- M. Pourbaix, Atlas of electrochemical equilibria in aqueous solution, National Association of Corrosion Engineers, Houston, TX, 1974 Search PubMed.
- C. N. Cao, Principles of electrochemistry of corrosion, Chemical Industry Press, Beijing, 2008 Search PubMed.
- Y. Zhou and F. A. Yan, The relation between intergranular corrosion and electrochemical characteristic of carbon steel in carbonic acid and sodium nitrite solutions, Int. J. Electrochem. Sci., 2016, 11, 3976–3986 CrossRef CAS.
- P. Jakupi, D. Zagidulin, J. J. Noël and D. W. Shoesmith, The impedance properties of the oxide film on the Ni–Cr–Mo alloy-22 in neutral concentrated sodium chloride solution, Electrochim. Acta, 2011, 56, 6251–6259 CrossRef CAS.
- J. F. Moulder, W. F. Stickle, P. E. Sohol and K. D. Bomben Jr, Handbook of X-ray photoelectron spectroscopy, a reference book of standard spectra for identification and interpretation of XPS data, Physical Electronics Inc., Minnesota, 1st edn, 1995 Search PubMed.
- Y. P. Li, X. D. Xu, Y. H. Hou, C. Zhang, F. L. Wang, K. Omura, Y. Koizumi and A. Chiba, Regulating the passive film of NiCoCrMo alloy in hydrofluoric acid solution by small addition of Cu, Corros. Sci., 2015, 98, 119–127 CrossRef CAS.
- W. M. Haynes, R. L. David and J. B. Thomas, Handbook of Chemistry and Physics, CRC press, Boca Raton, 97th edn, 2016, vol. 5, pp. 78–84 Search PubMed.
- F. Mansfeld, Area relationships in galvanic corrosion, Corrosion, 1971, 27, 436–442 CrossRef CAS.
- T. Ujiro, S. Satoh, R. W. Staehle and W. H. Smyrl, Effect of alloying Cu on the corrosion resistance of stainless steels in chloride media, Corros. Sci., 2001, 43, 2185–2200 CrossRef CAS.
- A. A. Hermas, K. Ogura and T. Adachi, Accumulation of Cu layer on a surface in the anodic polarization of stainless-steel containing Cu at different temperatures, Electrochim. Acta, 1995, 40, 837–844 CrossRef CAS.
- E. A. Lizlovs, Effects of Mo, Cu, Si and P on anodic behavior of 17 Cr steels corrosion (Houston, TX, United States), Corrosion, 1966, 22, 297–308 CrossRef CAS.
- X. H. Hao, J. H. Dong, J. Wei, I. N. Etim and W. Ke, Effect of Cu on corrosion behavior of low alloy steel under the simulated bottom plate environment of cargo oil tank, Corros. Sci., 2017 DOI:10.1016/j.corsci.2017.03.012.
| This journal is © The Royal Society of Chemistry 2017 |