 Open Access Article
Creating dynamic SERS hotspots on the surface of pH-responsive microgels for direct detection of crystal violet in solution†
Huaxiang Chena,
Tingting You*b,
Li Jiangc,
Yukun Gaoa and
Penggang Yin *a
*a
aKey Laboratory of Bio-inspired Smart Interfacial Science and Technology of Ministry of Education, School of Chemistry, Beihang University, Beijing, China. E-mail: pgyin@buaa.edu.cn
bSchool of Physics and Nuclear Energy Engineering, Beihang University, Xueyuan Road 37, Beijing, 100191, China
cCollege of Optical and Electronic Technology, China Jiliang University, China
First published on 27th June 2017
Abstract
A systematic study for the creation of dynamic surface-enhanced Raman scattering (SERS) hotspots is reported. Herein, gold nanoparticles-loaded pH-responsive poly(2-vinylpyridine) (AuNPs/P2VP) composite microgels were prepared efficiently by in situ chemical reduction. The nano-gap among AuNPs could be tuned easily by changing pH values of AuNPs/P2VP microgels solution from 2.0 to 5.0, creating vast SERS hotspots for electromagnetic enhancement. This change increased the SERS intensity remarkably, using 4-mercaptobenzoic acid (PMBA) as the model probe at a concentration of 1 × 10⁻⁴ M. Besides, the strongest SERS signal of PMBA was obtained when the gold concentration was 0.6 g L−1, and we systematically studied the relationship between gold concentration of AuNPs/P2VP microgels solution and SERS signal strength. The prepared SERS substrate with the strongest SERS signal was proved to be stable for months. Finally, the new SERS substrate was used for direct detection of crystal violet in solution, considering that crystal violet is the main ingredient in dye wastewater, and the detection limit was about 4 × 10⁻⁹ M. This result indicated that the new AuNPs/P2VP microgels are highly effective and can be used as a SERS-active substrate for direct analysis of a variety of objects in solution.
1. Introduction
Surface-enhanced Raman scattering (SERS) has been widely applied as a powerful and sensitive tool for the detection of chemical and biochemical analytes, which were adsorbed onto metallic nanoparticles, especially gold and silver.1–3 In SERS, it is now well established that high SERS activity is predominantly based on the plasmonic hot spots that can give rise to high enhancement factors.4,5 To date, the development of SERS technique faces two main challenges.6,7 The first one is the preparation of a SERS-active substrate with large numbers of hotspots,8,9 the second one is how to place the targeted molecules in the hotspots with high efficiency.10,11 It is necessary to develop a simple method for creating dynamic SERS hot spots, in which the nano-gap among metallic nanoparticles can be controlled easily. After being adsorbed onto metallic nanoparticles, molecular probe will be sited in the hot spots efficiently by narrowing the nano-gap.It is known that stimulus-responsive hybrid microgels can alter their volumes and properties in response to environmental stimuli.12–14 The nano-gap among nanoparticles composited with stimulus-responsive microgels can be tuned effortless by external stimulus, such as temperature, pH and light.15,16 Over the past decade, the subject of composite stimulus-responsive microgels with metallic nanoparticles has received increasing amounts of attention due to their plasmonic properties and biomedical applications.17,18 Different types of microgels were used for SERS substrate, C. Fernández-lópez et al., reported that temperature responsive gold nanorod-poly(N-isopropylacrylamide) microgels systems were used as excellent broadband SERS substrates;19 SERS efficiency of temperature and pH double-responsive silver nanoparticle-loading microgels were reported by Liu Xiaoyun et al.20 pH value is one of the most common stimuli,21,22 especially in chemical and biomedical systems.23,24 For instance, K. Akamatsu et al., reported the synthesis on nanocomposite of poly(2-vinylpyridine), one of acid-swellable microgels, with size-controlled gold nanoparticles (AuNPs) deposited only on the microgel surface, and the prepared composite microgels have attractive potential application in pH-probing mobile plasmonic or SERS microsensors.25 The synthetic method is simple and effective, however, there have been no previous reports on the SERS direct detection in solution of the prepared composite microgels as the SERS substrate.
Herein, we report the synthesis of pH-responsive AuNPs/P2VP composite microgels loaded with different amount of gold nanoparticles by in situ chemical reduction. By changing the reaction conditions, AuNPs/P2VP composite SERS substrate with optimal dynamic SERS hotspots were designed. The SERS efficiency of the prepared AuNPs/P2VP hybrids, with long-time stability, could be remarkably modulated by pH value changing from 2.0 to 5.0, using PMBA as the model probe. Finally, used as the new SERS substrate in aqueous solutions, these AuNPs/P2VP hybrids exhibited great potential for direct detecting crystal violet.
2. Materials and methods
2.1 Reagents
2-Vinylpyridine (2VP, purity 97%) and divinylbenzene (DVB, purity 80%) were purchased from Energy Chemical (China) and purified bypassing through a short basic Al2O3 column before use. Poly(ethylene glycol) methyl ether methacrylate (PEGMA) macromonomer (Mn = 2080, 50 wt% aqueous solution), α,α′-azodiisobutyramidine dihydrochloride (AIBA, purity 97%), Aliquat 336 and dimethylamineborane (DMAB) were purchased from Energy Chemical (China) and used as received. Chloroauric acid (HAuCl4, purity 99.3%) and sodium hydroxide (NaOH) were supplied by Shanghai Chem. Reagent Co. (China) and used as received. 4-Mercaptobenzoic acid (PMBA) and crystal violet (CV) were purchased from J&K Scientific(China). All deionized water was used throughout and obtained using a Millipore Direct-Q system.2.2 Preparation of AuNPs/P2VP hybrid microgels
The pH-responsive poly(2-vinylpyridine) microgels used in this study were first synthesized according to ref. 25. Briefly, 1.00 g Aliquat 336 and 1.00 g PEGMA were dissolved in 80 mL of deionized water in a 250 mL round-bottomed flask. A mixture of 9.90 g 2VP and 0.10 g DVB was then added. The aqueous solution was degassed at ambient temperature using five vacuum/nitrogen cycles. The degassed solution was stirred at 250 rpm using a magnetic stirrer and heated to 60 °C with the aid of an oil bath. Aqueous AIBA initiator solution (0.15 g, 9 mL) was injected after 20 min. The polymerization was continued for 24 h at 60 °C.In order to remove residual 2VP monomer, excess Aliquat 336 surfactant, and nongrafted PEGMA stabilizer, the P2VP latex particles were centrifuged at 9000 rpm for 15 min, followed by careful decantation of the supernatant, replacement with fresh water, and redispersion of the sedimented particles with the aid of an ultrasonic bath.
AuNPs/P2VP hybrid microgels were prepared by in situ chemical reduction. Firstly, P2VP latex was mixed with aqueous HAuCl4 solution (20 mM) in appropriate ratios, and the mixture solution was stirred for 1 h at room temperature, then purified by dialysis. Secondly, aqueous DMAB solution (10 mM, 5 mL) was gradually dropped into the solution of ion-doped microgels (1 mL) at the rate of 150 μL s−1 under stirring for 60 min to reduce the gold ions to metallic gold, followed by dialysis using distilled water.
2.3 SERS property of AuNPs/P2VP hybrid microgels
The SERS activity of AuNPs/P2VP hybrid microgels was studied using PMBA as analyte. Specifically, the composite microgels with different concentrations of AuNPs were mixed with PMBA at pH values of 2 and stirred for 0.5 h. Next, the mixed solution was dropped into a quartz cuvette for SERS measurement at the condition of different pH values. The prepared AuNPs/P2VP-2 hybrid microgels with gold concentration of 0.6 g L−1 was also used as SERS substrates to detect crystal violet (CV). The CV was mixed with the new SERS substrate at pH values of 2 and stirred for 0.5 h, then, after changed pH values to 5 by NaOH and stirred for 0.5 h, the mixed solution was dropped into a quartz cuvette for SERS measurement.2.4 Characterization
Transmission electron microscopy (TEM) images were obtained on a JEM-1200EX transmission electron microscope at a voltage of 120 kV. Diluted AuNPs/P2VP hybrid microgel dispersions were dropped onto carbon coated copper grids and dried at room temperature. The ultraviolet-visible absorption spectra (UV-vis) at varied pH values were measured on a Shimadzu UV-3150 spectrometer. The hydrodynamic diameters (DH) of the AuNPs/P2VP hybrid microgels dispersed in the water of various pH values were measured via BI-200SM dynamic light scattering (DLS) (Brookhaven, USA) at the temperature of 20 °C, which is equipped with a solid laser source (wavelength of 532 nm and output power of 100 mW) and a BI-9000AT digital auto correlator. The scattering light was collected at 90°, and the CONTIN statistical method was used to convert the measured correlation data into a particle size distribution. Gold concentration was detected by Agilent 7500ce (ICP-OES). Raman spectra were recorded with JYHR800 (HORIBA Jobin Yvon), equipped with a 50× objective (NA = 0.5), 600 lines per mm grating and an Ar–Kr laser with 647 nm as excitation. The laser power was 3 mW. The scatter light was analyzed with a Dilor XY triple spectrometer and a liquid-nitrogen-cooled CCD multi-channel detector. A 520 cm−1 peak of silicon wafer was used to calibrate the spectrograph.3. Results and discussion
3.1 Synthesis and characterization of AuNPs/P2VP hybrid microgels
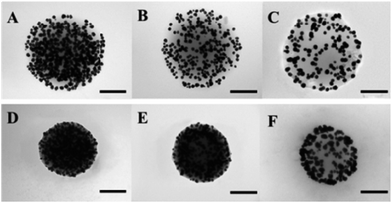
The AuNPs/P2VP hybrid microgels were prepared by in situ chemical reduction of AuCl4−1 ions coordinated into P2VP microgels. It was confirmed that the gold nanoparticles fabricated by this method were located only on the microgels surface.24Gold concentration was detected by ICP-OES. As listed in Table 1, the average diameters of the loaded AuNPs measured from the TEM images are within the range from 3 to 8 nm, shown in Fig. 1. With the decreasing of P2VP![[thin space (1/6-em)]](https://www.rsc.org/images/entities/char_2009.gif) :
:![[thin space (1/6-em)]](https://www.rsc.org/images/entities/char_2009.gif) HAuCl4 ratio, the content of the loaded AuNPs is raised, but their particle size varies insignificantly (shown in Fig. S1†).
HAuCl4 ratio, the content of the loaded AuNPs is raised, but their particle size varies insignificantly (shown in Fig. S1†).
![[thin space (1/6-em)]](https://www.rsc.org/images/entities/char_2009.gif) :
:![[thin space (1/6-em)]](https://www.rsc.org/images/entities/char_2009.gif) HAuCl4) and their characterization results
HAuCl4) and their characterization results
| Samples | Ratios (v![[thin space (1/6-em)]](https://www.rsc.org/images/entities/char_2009.gif) : :![[thin space (1/6-em)]](https://www.rsc.org/images/entities/char_2009.gif) v) (P2VP v) (P2VP![[thin space (1/6-em)]](https://www.rsc.org/images/entities/char_2009.gif) : :![[thin space (1/6-em)]](https://www.rsc.org/images/entities/char_2009.gif) HAuCl4) HAuCl4) |
Gold concentration of product solution (g L−1) | Average diameters of AuNPs (nm) |
|---|---|---|---|
| AuNPs/P2VP-1 | 1![[thin space (1/6-em)]](https://www.rsc.org/images/entities/char_2009.gif) : :![[thin space (1/6-em)]](https://www.rsc.org/images/entities/char_2009.gif) 20 20 |
0.807 | 24.5 ± 3.8 |
| AuNPs/P2VP-2 | 1![[thin space (1/6-em)]](https://www.rsc.org/images/entities/char_2009.gif) : :![[thin space (1/6-em)]](https://www.rsc.org/images/entities/char_2009.gif) 17.5 17.5 |
0.742 | 23.6 ± 4.1 |
| AuNPs/P2VP-3 | 1![[thin space (1/6-em)]](https://www.rsc.org/images/entities/char_2009.gif) : :![[thin space (1/6-em)]](https://www.rsc.org/images/entities/char_2009.gif) 15 15 |
0.658 | 23.4 ± 4.0 |
It can be seen in Fig. 1, with the environmental pH values changing from 2.0 to 5.0, the diameters of the hybrid microgels decrease sharply, and the nano-gap among AuNPs narrowed down apparently. To probe the reversibility of the diameters change of AuNPs/P2VP microgels, AuNPs/P2VP-2 microgels were exposed to pH 2 and pH 5 circularly, corresponding UV-vis spectra and hydrodynamic diameters were recorded, as shown in Fig. 2. As the pH values rises from 2.0 to 5.0, their particle sizes of the composite microgels decrease sharply, and aggregation of gold nanoparticles leads to red shift, indicating that AuNPs/P2VP hybrid microgels have marked pH responsiveness.
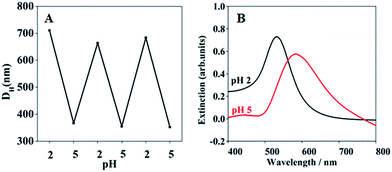 | ||
| Fig. 2 Hydrodynamic diameters (A) and UV-vis spectra (B) of AuNPs/P2VP-2 microgels at pH values of 2.0 or 5.0. | ||
3.2 pH-tunable SERS efficiency of AuNPs/P2VP microgels
The prepared AuNPs/P2VP-2 microgels were used as SERS substrates, on which PMBA is adsorbed as target with a concentration of 10−4 M in aqueous solution at 25 °C. According to the previously reported SERS spectra of PMBA on Ag and Au substrates,26 the two prominent peaks at 1076 and 1587 cm−1 are assigned to its aromatic ring breathing vibration.The AuNPs/P2VP-2 microgels solution with gold concentration of 0.6 g L−1 were selected as SERS substrates, considering that the strongest SERS signal of PMBA was got at this condition. No peaks corresponding to P2VP were observed (shown in Fig. S3†).
As shown in Fig. 3, at pH values of 2, gold nanoparticles was in the dispersed state, as a result, PMBA can be easily absorbed onto the gold surface. When pH values changed from 2 to 5, nano-gap among AuNPs narrowed down apparently, creating vast hot spots for SERS detection. Herein, PMBA was firstly adsorbed on the AuNPs/P2VP-2 microgels at pH values of 2, then the SERS spectra was detected at different pH values.
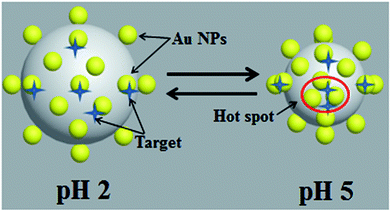 | ||
| Fig. 3 Schematic representation of the AuNPs/P2VP-2 microgels used as SERS substrates and the pH-responsive behavior. | ||
As seen from Fig. 4, all peaks other than the one at 1280 cm−1 are strongly enhanced with increasing pH values from 2.0 to 5.0. Therefore, it could be speculated that the pH-induced SERS signal enhancement of PMBA is associated with the pH triggered volume phase transition of the hybrid microgels as SERS substrates. Although only few PMBA molecules are located within the gaps, their contribution to an entire EF should be pronounced due to the huge enhancement effect.
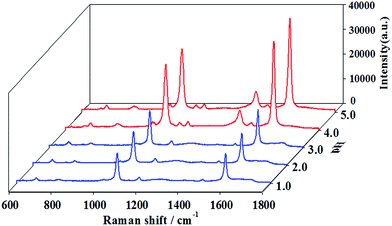 | ||
| Fig. 4 3D SERS spectra of 10−4 M PMBA adsorbed on the AuNPs/P2VP-2 microgels, detected at different pH values. The acquisition time was 2 s. | ||
Fig. 5 shows that the SERS signal can be tuned by alternating pH values between 2 and 5, and this may apply to biological monitoring.
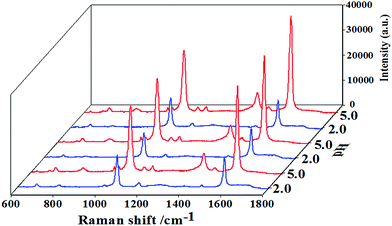 | ||
| Fig. 5 3D SERS spectra of 10−4 M PMBA adsorbed on AuNPs/P2VP-2 microgels, detected at alternating pH values between 2 and 5. The acquisition time was 2 s. | ||
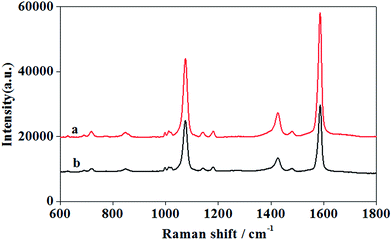
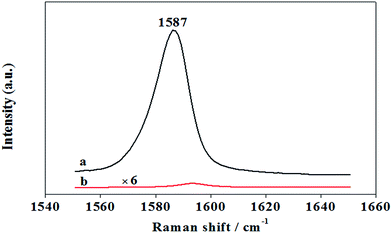
It can be seen in Fig. 6, when PMBA was directly adsorbed on AuNPs/P2VP-2 microgels under the condition of pH values of 5, the SERS spectra became weak. It is indicated that, in the process of regulating pH values from 2 to 5, more PMBA molecular can be located in the junctions among AuNPs, which are hotspot sites with the strongest signal enhancement.
3.3 SERS strength and stability of AuNPs/P2VP microgels
SERS signal strength can be affected by gold concentration of AuNPs/P2VP microgels solution. As shown in Fig. 7, when using AuNPs/P2VP-2 microgels with gold concentration of 0.6 g L−1 as SERS substrates, we get the strongest SERS signal of PMBA. With gold concentration changing from 0.4 g L−1 to 0.6 g L−1, more hot spots distributed under laser speckle, causing SERS signal increased obviously. Altering gold concentration from 0.6 g L−1 to 0.8 g L−1, SERS signal decreased, due to the accumulation of gold nanoparticles.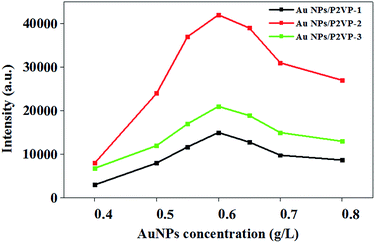 | ||
| Fig. 7 The SERS intensity at 1587 cm−1 of 10−4 M PMBA adsorbed on AuNPs/P2VP microgels at a function of different gold concentration. The pH value is 5. The acquisition time was 2 s. | ||
To compare the enhancement more quantitatively, we have calculated the EFs (enhancement factors) for the main Raman peaks of PMBA adsorbed on AuNPs/P2VP-2 microgels with gold concentration of 0.6 g L−1, as shown in Fig. 8, based on the method in ref. 27:
| EF = (ISERS/Nads)/(Ibulk/Nbulk) | (1) |
The SERS signal of 10−4 M PMBA did not change after two months, as can be seen in Fig. 9, proving that AuNPs/P2VP-2 composite SERS substrate was stable for months.
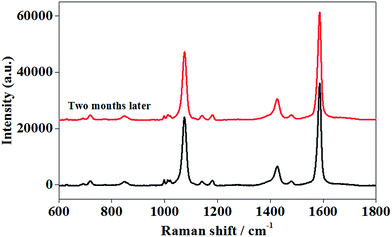 | ||
| Fig. 9 The SERS spectra of 10−4 M PMBA adsorbed on AuNPs/P2VP-2 microgels after two months. The acquisition time was 2 s. | ||
3.4 Detecting crystal violet in solution by SERS
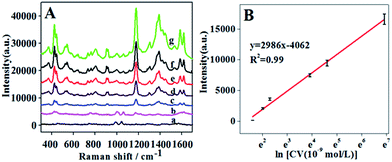
Rapid detection and identification of poisonous substances in food or the environment is one of the most important tasks for SERS analysis. Due to its ultrahigh sensitivity and “fingerprint-like” property, SERS exhibited a great advantage for the detection of crystal violet. Up to now, although a great deal of progress for detection of crystal violet has been achieved, the good SERS-active substrates usually used inorganic composite nanospheres due to the synthesis procedure being based on the inclement hydrothermal process.In this paper, we prepared a pH-responsive composite SERS-active substrate with high stability. We first used the prepared AuNPs/P2VP-2 with gold concentration of 0.6 g L−1 as SERS substrates to detect crystal violet. Dye molecules were adsorbed on AuNPs/P2VP-2 microgels under the condition of pH values of 2 and the Raman spectra were detected at pH values of 5.
The intensities of Raman shift at 1178 cm−1 of CV were plotted against the natural logarithm of CV concentrations, as shown in Fig. 10B. The result showed the detection of limit (LOD) is 4 × 10⁻⁹ M, at a signal-to-noise ratio of 3![[thin space (1/6-em)]](https://www.rsc.org/images/entities/char_2009.gif) :
:![[thin space (1/6-em)]](https://www.rsc.org/images/entities/char_2009.gif) 1.
1.
This result demonstrated that the prepared AuNPs composite nanospheres could serve as the SERS substrates to detect the targeting crystal violet molecules in solution. The AuNPs composite nanosphere based high performance SERS substrates will be of a great value for food safety and environment protection.
4. Conclusions
In summary, we demonstrated that dynamic SERS hotspots on the surface of gold nanoparticles-loading pH-responsive microgels could be facilely prepared through the in situ reduction. With pH values changing from 2 to 5, nano-gap among AuNPs narrow down apparently, creating vast hot spots for SERS detection. At the optimal preparation condition, the composite nanospheres showed excellent consistency and good activity in the SERS experiments. Used AuNPs/P2VP-2 microgels with gold concentration of 0.6 g L−1 as SERS substrates, we get the strongest SERS signal of PMBA, and the EFs (enhancement factors) for the main Raman peaks of PMBA adsorbed on this composite microgels was calculated to be 1.3 × 10⁶. AuNPs/P2VP-2 composite SERS substrate was proved to be stable for months. Finally, these experimental results also demonstrated that the prepared AuNPs composite nanospheres could serve as an excellent SERS substrate to detect crystal violet in solution, with the detection limit of about 4 × 10⁻⁹ M. It will be of great value for food safety and environment protection.Acknowledgements
This work was supported by the National Natural Science Foundation of China (51272013 and 51572009).References
- M. Fleischmann, P. J. Hendra and A. J. McQuillan, Chem. Phys. Lett., 1974, 26(2), 163 CrossRef CAS.
- Z. Z. Han, H. L. Liu, B. Wang, S. Z. Weng, L. B. Yang and J. H. Liu, Anal. Chem., 2015, 87, 4821 CrossRef CAS PubMed.
- J. A. Dieringer, K. L. Wustholz, D. J. Masiello, J. P. Camden, S. L. Kleinman, G. C. Schatz and R. P. Van Duyne, J. Am. Chem. Soc., 2009, 131(2), 849 CrossRef CAS PubMed.
- Y. P. Wu, F. Zhou, L. B. Yang and J. H. Liu, Chem. Commun., 2013, 49(44), 5025 RSC.
- A. Chen, D. A. Eugene, D. Arnaud, J. I. Alexandra, V. S. Elena, K. G. Stephen, W. Ulrich and K. V. Vitalii, Small, 2011, 7(16), 2365 CrossRef CAS PubMed.
- H. Liu, Y. Sun, Z. Jin, L. Yang and J. Liu, Chem. Sci., 2013, 4(9), 3490 RSC.
- J. B. Matthew, E. M. Jill, L. D. Qin and A. M. Chad, Chem. Soc. Rev., 2008, 37, 885 RSC.
- Y. H. Lai, S. W. Chen, M. Hayashi, Y. J. Shiu, C. C. Huang, W. T. Chuang, C. J. Su, H. C. Jeng, H. W. Chang, Y. C. Lee, A. C. Su, C. Y. Mou and U. Jeng, Adv. Funct. Mater., 2014, 24(17), 2544 CrossRef CAS.
- J. Sharma, R. Chhabra, Y. Liu, Y. Ke and H. Yan, Angew. Chem., Int. Ed., 2006, 45(5), 730 CrossRef CAS PubMed.
- H. Y. Chen, M. H. Lin, C. Y. Wang, Y. M. Chang and S. Gwo, J. Am. Chem. Soc., 2015, 137(42), 13698 CrossRef CAS PubMed.
- D. Radziukand and H. Moehwald, Nanoscale, 2014, 6(11), 6115 RSC.
- M. Karg, I. Pastoriza-Santos, J. Pérez-Juste, T. Hellweg and L. M. Liz-Marzán, Small, 2007, 3, 1222 CrossRef CAS PubMed.
- A. M. Kloxin, C. J. Kloxin, C. N. Bowman and K. S. Anseth, Adv. Mater., 2010, 22(31), 3484 CrossRef CAS PubMed.
- D. Seliktar, Science, 2012, 336(6085), 1124 CrossRef CAS PubMed.
- M. Zhang, N. I. Rabiah, T. H. Ngo, T. P. Otanicar, P. E. Phelan, R. Swaminathan and L. L. Dai, J. Colloid Interface Sci., 2014, 425, 12 CrossRef CAS PubMed.
- X. Y. Liu, C. Zhang, J. M. Yang, D. L. Lin, L. Zhang, X. Chen and L. S. Zha, RSC Adv., 2013, 3(10), 3384 RSC.
- B. M. Budhlall, M. Marquez and O. D. Velev, Langmuir, 2008, 24, 11959 CrossRef CAS PubMed.
- A. Sáncheziglesias, M. Grzelczak, B. Rodríguezgonzález, P. Guardiagirós, I. Pastorizasantos, J. Pérezjuste, M. Prato and L. M. LizMarzán, ACS Nano, 2009, 3(10), 3184 CrossRef PubMed.
- C. Fernández-lópez, L. Polavarapu, D. M. Solís, J. M. Taboada, F. Obelleiro and R. Contrerascáceres, ACS Appl. Mater. Interfaces, 2015, 7(23), 12530 Search PubMed.
- X. Y. Liu, X. Q. Wang, L. S. Zha, D. L. Lin, J. M. Yang, J. F. Zhou and L. Zhang, J. Mater. Chem. C, 2014, 2(35), 7326 RSC.
- D. Dupin, A. S. Fujii, S. P. Armes, P. Reeve and S. M. Baxter, Langmuir, 2006, 22(7), 3381 CrossRef CAS PubMed.
- B. Matthias and Y. Lu, Polymer, 2007, 48(7), 1815 CrossRef.
- D. Schmaljohann, Adv. Drug Delivery Rev., 2006, 58(15), 1655 CrossRef CAS PubMed.
- D. S. W. Benoit, W. Gray, N. Murthy, H. Li and C. L. Duvall, Comprehensive Biomaterials, 2011, 357 Search PubMed.
- K. Akamatsu, M. Shimada, T. Tsuruoka, H. Nawafune, S. Fujii and Y. Nakamura, Langmuir, 2010, 26(2), 1254 CrossRef CAS PubMed.
- A. Michota and J. Bukowska, J. Raman Spectrosc., 2003, 34(1), 21 CrossRef CAS.
- L. Zhang, C. Jiang and Z. Zhang, Nanoscale, 2013, 5, 3773 RSC.
Footnote |
| † Electronic supplementary information (ESI) available. See DOI: 10.1039/c7ra05567f |
| This journal is © The Royal Society of Chemistry 2017 |

