
 Open Access Article
 This Open Access Article is licensed under a
 Creative Commons Attribution 3.0 Unported Licence
Computing analysis of lattice vibrations of ice VIII†
Shu-Kai Yaoa,
Peng Zhang *a,
Ying Zhangb,
Ying-Bo Lua,
Tian-Lin Yanga,
Bai-Gong Suna,
Zhen-Yu Yuana and
Hui-Wen Luoa
*a,
Ying Zhangb,
Ying-Bo Lua,
Tian-Lin Yanga,
Bai-Gong Suna,
Zhen-Yu Yuana and
Hui-Wen Luoa
aSchool of Space Science and Physics, Shandong University, Weihai, 264209, China. E-mail: Zhangpeng@sdu.edu.cn
bSchool of Physics and Technology, University of Jinan, Jinan, 250022, China
First published on 21st June 2017
Abstract
The differences in the vibrational spectra of a condensed matter between inelastic neutron scattering and photon scattering originate from the different corresponding interaction mechanisms. However, investigators used to ignore them due to difficulties to analyse theoretically. Herein, we devise an approach to link neutron scattering with photon scattering experiments by computing simulation methods and shed light on new physical insights for the assignments of crystalline materials. By using the first-principles method based on density functional theory (DFT), the vibrational spectrum of ice VIII is investigated. Comparisons between the computing vibration modes and the experimental data of ice VIII, i.e., Raman and neutron scattering data, mutually validate the reliability. The assignments of the dynamic process of 33 normal modes at the Brillouin zone (BZ) center are precisely illustrated from the vibrational analysis based on CASTEP code. The physical insights for special vibration modes are discussed individually as well as in terms of the correlated peak from neutron and Raman scattering.
Introduction
Water is one of the essential materials for natural processes and the evolution of humans.1 Ice, the solid state of water, has been found in the form of more than 17 different crystalline and amorphous structures under certain pressures and temperatures.2–11 Recently, Huang et al. theoretically predicted a new phase of ice under negative pressure, s-III, which possesses an ultralow density of 0.593 g cm−3.12 All of the condensed states consist of a three-dimensional network of hydrogen bonds (H-bonds),13 which pack the water molecules by connecting the hydrogen and the neighboring oxygen atoms. The H-bonds with various behaviors predominate over the interaction between H2O molecules. Consequently, the accuracy of the H-bonds calculation is pivotal in the validity of our work. In this work, the structure of ice VIII is entirely hydrogen-ordered without H-bond distortion even though it is a high-pressure phase,14 which verifies the feasibility of our simulations.Ice VII, first discovered by Bridgman, is a stable form of ice existing above the pressure of 22 kbar at room temperature.15 It is widely accepted that the orientations of hydrogens are disordered in ice VII, which leads to a reasonable prediction that an ordered structure of an ice crystal corresponding to ice VII could be detected at lower temperature. Based on the calculation of entropy change in the disorder–order transition, a transformation from VII to a new phase that is orientationally ordered should occur in the region of 0–20 °C.16 Using the opposed circular anvils, Whalley et al. determined a phase of ice (ice VIII) with a low dielectric constant transformed from ice VII below 0 °C.17 Numerous experiments by measuring the dielectric properties,18 the IR absorption spectrum,19 the Raman spectrum20,21 and the neutron diffraction pattern5 to demonstrate the transition between ice VII and ice VIII have been reported. Some interesting phase transitions of ice VIII (and VII) induced by changes in pressure and temperature have been detected by experiments. Infrared evidences show a transformation of ice VIII and VII above 60 GPa to ice X,22,23 of which hydrogen atoms are equally spaced and bonded between the oxygen atoms. The spectrum analysis of ice VIII is of significant value with regard to this symmetry transition under high pressure. And it is discovered that ice VIII transfers to low density amorphous ice (LDA) about 125 K upon heating at ambient pressure using X-ray diffraction.24 Raman experiment verifies this transformation as Yoshimura et al. find a clear LDA transition above 120 K.25
The structure of ice VIII consists of two cubic ice Ic lattices opposed interpenetrating with each other. There are four H2O molecules in one primitive cell of ice VIII with the space symmetry I41/amd. Measurements of the vibrational spectrum of ice VIII have been studied in the past.14,26–29 However, some of the assignments in ice VIII vibrational spectrum remain tentative and phenomenal due to difficulties to analyse theoretically. By using the CASTEP code, a first-principles DFT method, we develop a new approach to theoretically investigate the lattice vibrations of ice VIII. The outcomes of IR spectra simulation present the relationship between frequencies and vibration modes at the BZ center. Theoretically, the calculation of vibrational spectrum is based on harmonic approximately. Thus the vibration modes are called normal modes. The frequencies of normal modes could be illustrated from the dispersion relationship and the phonon density of states (PDOS) could be integrated by the normal modes throughout the whole reduced BZ. The computational results are verified with neutron scattering and photon scattering data in principle by: (1) the inelastic neutron scattering (INS) experiment is able to collect all phonon signals without selection. The data could be compared with the calculated PDOS; (2) the coupling of photons with phonons are more close to the center of BZ. So that, we could assign the peaks from photon scattering according to the frequencies of calculated normal modes. The differences between neutron scattering and photon scattering are originated from different interaction mechanisms. However, investigators used to ignore these differences because they are difficult to be analysed theoretically in the past. Herein, we setup a bridge linking neutron scattering with photon scattering by computing methods and shed light on their physical insights for the vibrational spectra assignments of condensed matter.
Computational methodology
Based on quantum mechanics DFT method, the code of CASTEP is used to perform the geometrical optimization and phonons calculation.30 The XC function of GGA RPBE,31 although produces a slight red-shift in the H-bonds but greater accuracy in the intra-molecular vibrations according to our test,32 is chosen for this work. The energy and SCF tolerance should take the maximum values for phonon calculation. The energy cutoff is set at 1000 eV and the K-point mesh is 4 × 4 × 5 in the reduced BZ. The norm-conserving pseudopotentials are used to calculate the PDOS and the environmental pressure is set as 2.4 GPa.Results and discussion
The simulated vibrational spectrum of ice VIII is shown in Fig. 1 with four separate vibration regions and the correlated data are listed in Table 1. We compared the computing results with inelastic neutron scattering and Raman scattering data. The peaks come from Raman scattering corresponds to the frequencies of normal modes at Gamma point because the interactions between photons and phonons are restricted near the BZ center. Since the inelastic neutron scattering could collect all the phonon signals of lattice vibration, the experimental data could be compared with simulated spectrum integrated by PDOS (please find more explanations from ref. 32). The vibration modes at the BZ center, i.e., at Gamma point, will be discussed specifically as follows. As a primitive cell of ice VIII containing 12 atoms, there are 12 × 3 − 3 = 33 optical normal modes of lattice vibration, thus we could illustrate them in this paper individually.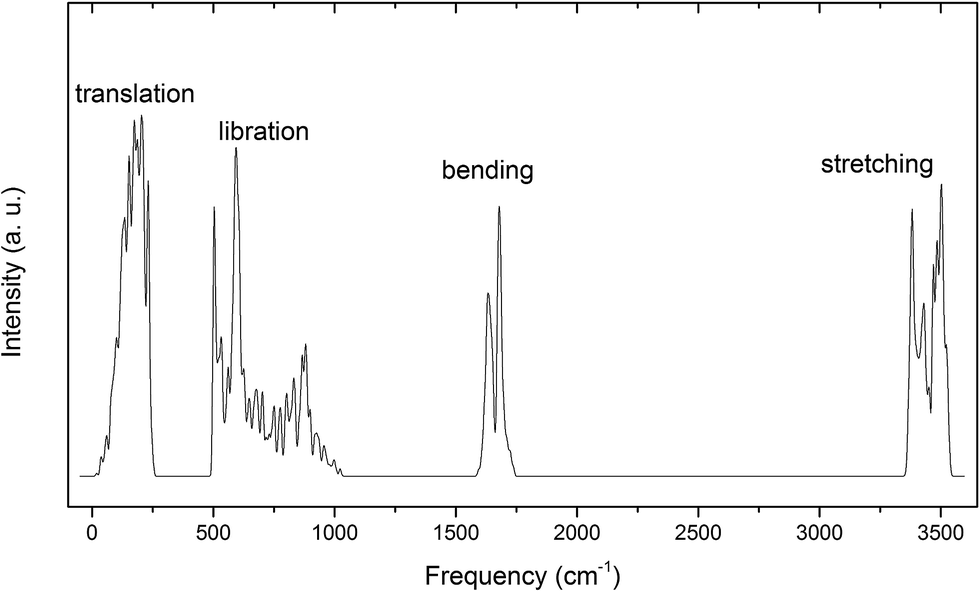 | ||
| Fig. 1 The simulated spectrum of ice VIII, a straight outcome from calculated phonon density of states. The four main bands named translation, libration, bending and stretching regions are illustrated from left to right. | ||
| PDOS | Neutr. scatt. (ref. 14/27) | Normal modes | Raman scatt. (ref. 26/28) |
|---|---|---|---|
| 133 | /118 | ||
| 152 | 161 | 169/ | |
| 161 | |||
| 174 | /167 | 174 | 172/ |
| 177 | |||
| 177 | |||
| 203 | /215 | 205 | 214/ |
| 205 | |||
| 231 | 237 | ||
| 254 | 258/ | ||
| 503 | 463/443 | 502 | |
| 502 | |||
| 531 | /484 | 537 | 494/ |
| 537 | |||
| 561 | 548/548 | 580 | 548/ |
| 582 | |||
| 583 | |||
| 594 | 583 | 583/ | |
| 702 | 684 | 740/ | |
| 903 | |||
| 881 | 846/862 | 903 | 874/ |
| 1023 | 1032 | 1064/ | |
| 1589 | |||
| 1632 | 1660/ | 1625 | 1677/ |
| 1678 | 1683 | ||
| 1742 | 1821/ | ||
| 3357 | |||
| 3381 | 3363 | 3359/3291 | |
| 3429 | 3460 | ||
| 3469 | 3434/ | 3465 | 3448/3391 |
| 3465 | |||
| 3484 | 3469 | ||
| 3469 | |||
| 3503 | 3635/ | 3480 | 3477/3449 |
The 8 intra-molecular stretching vibration modes are shown in Fig. 2. We use A1, A2 to label two molecules in one Ic lattice connecting with H-bond and B1, B2 for the other. The left two molecules are the same to A2 (right one) and B1 (left one) in the neighbor cells individually. The side view is perpendicular to the X axis. The green arrows are indications of the vibration directions at the same time, in sizes proportional to the vibration amplitude. The vibrational frequencies above 3000 cm−1 are O–H stretching vibration modes. There are two kinds of vibration mode in one molecule: symmetric stretching and asymmetric stretching. And there are eight normal modes in stretching region because the vibrations are subject to the symmetry of the space group and the binding equilibrium with neighbors. The symbol SS refers to symmetric stretching vibration and AS refers to asymmetric stretching vibration. We do not observe the isolated vibration of only one O–H bond vibrate while the other covalent bond remains static in one molecule, which differs from the lattice vibration of ice XV.33 And, the mixing of symmetric and asymmetric stretching may be possible in ice XV but forbidden in ice VIII for high symmetry structure.
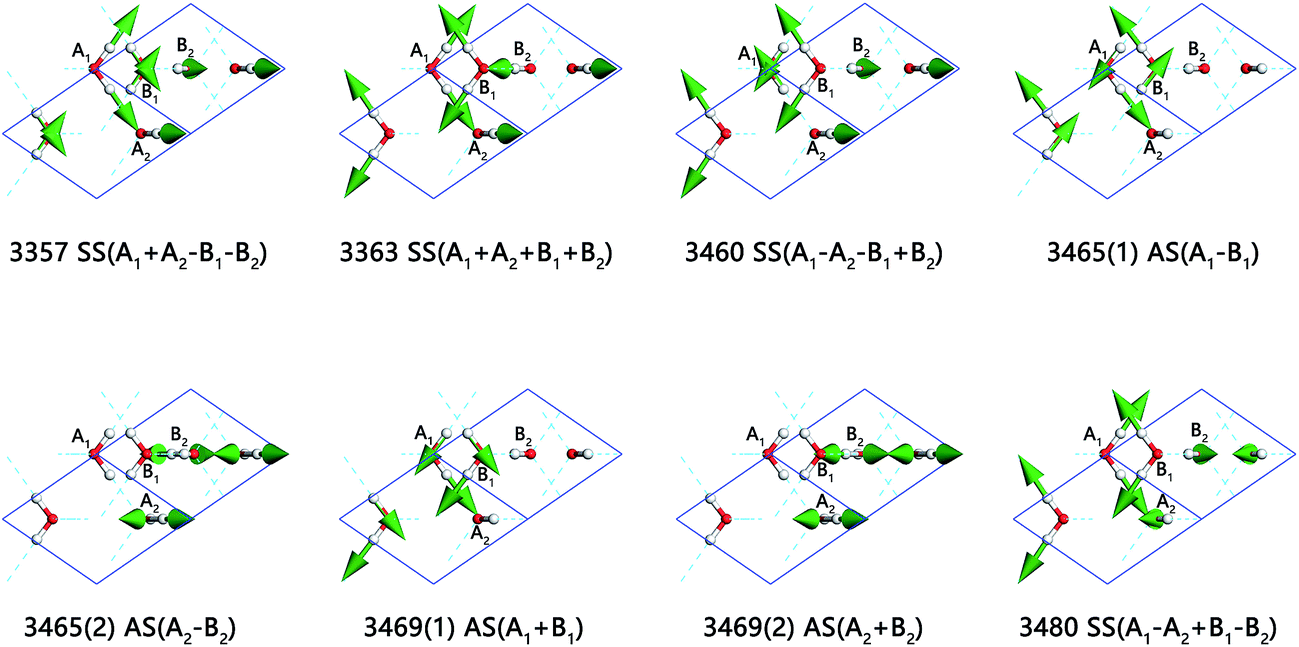 | ||
| Fig. 2 Eight normal modes in stretching region (the side view is YZ plane). Four H2O molecules in the primitive cell of ice VIII are labeled with A1, A2, B1, and B2 respectively. Numbers are the frequencies (cm−1) of vibrational modes. SS is the sign of symmetric stretching and AS represents asymmetric stretching. | ||
We provide a video referring to the normal mode 3357 cm−1 to illustrate the H2O molecule vibration modes, please find it in ESI Video S1.† In this mode, molecules A1, A2, B1, and B2 are symmetric stretching individually. While O–H are stretching in A1 and A2, B1 and B2 are shrinking. The sign ‘+’ is used to indicate the in-phase vibrations with the molecule A1. Although B1 and B2 are in-phase vibrations, they are out of phase to A1, this mode is thus labeled as SS(A1 + A2 − B1 − B2). Moreover, it is shown that 3363 cm−1 (normal modes)/3381 cm−1 (PDOS) is SS in-phase, which agrees with Wong's assignment at the peak of 3359 cm−1.26 Hemley's work of Raman spectrum in stretching region shows three obvious peaks with the highest frequency is 3449 cm−1.28 Li and Wong assign the peaks at 3434 cm−1 (INS)/3448 cm−1 (Raman) to AS14,26 in agreement with four normal modes of AS spread from 3465 cm−1 to 3469 cm−1 with an exception for 3460 cm−1.
Li et al. assigns the peak at 3635 cm−1 (INS) to SS out of phase,14 and Wong et al. also assigns the peak at 3477 cm−1 to SS out of phase.26 Our results indicate that the highest peak at 3480 cm−1 (normal modes)/3503 cm−1 (PDOS) is SS out of phase. In summary, compared with asymmetric stretching vibration, the modes of SS have lower vibration energy, except for the normal mode of 3480 cm−1 which has the highest frequency in the stretching region. It is also obvious that the Raman scattering provide more close peaks to be assigned special vibration modes according to computing results, while inelastic neutron scattering could verify the PDOS spectrum and is difficult to tell their physical insight for a specific peak.
With respect to the intra-molecular bending region, there are only four normal modes as shown in Fig. 3. We use ‘+’ and ‘−’ to demonstrate whether the molecule is in-phase or out of phase with A1. For instance, A1 and B1 are opening while A2 and B2 are closing at the frequency of 1625 cm−1. Therefore, we name this mode to be 1625 (A1 − A2 + B1 − B2) and offer a video in ESI Video S2.†
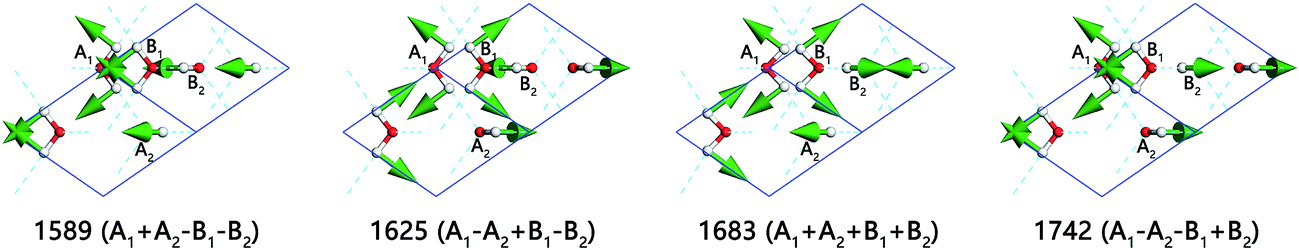 | ||
| Fig. 3 Four normal modes in bending region (the side view is YZ plane). The number indicates the vibration frequency of a normal mode (cm−1); ‘+’ and ‘−’ are the symbol of in-phase or out of phase with A1. | ||
The Raman spectrum recorded by Wong et al. pointed that there is a peak at 1677 cm−1 in the bending region.26 The INS experiment exhibits a peak at the frequency of 1660 cm−1.14 They both assign this peak to be out of phase between the molecules A1 and B2. In this work, the frequency of 1625 cm−1 (normal mode)/1632 cm−1 (PDOS) indicates a same out of phase bending. The in-phase vibration for all of the four molecules occurs in 1683 cm−1, which is significantly higher than literatures above. We are in doubt about the accuracy of the peak at 1346 cm−1 in Wong's Raman spectrum and his assignment, for he assigned this peak to be in-phase bending vibration.
In the inter-molecular libration band, there are 12 normal modes corresponding to 8 frequencies due to 4 degenerate states, which are illustrated in Fig. 4 in detail. All the molecule vibration modes could be classed in three types: rocking, twisting and wagging labeled as R, T, and W. Considering the mode of 903(1) cm−1 (ESI Video S3†), A1 and B1 are rocking and, simultaneously, A2 and B2 are wagging. Additionally, some of the modes share the same labels, whereas the specific dynamic modes are different. The modes of frequencies at 502(2) cm−1 and 583(1) cm−1, for instance, are named with the same R(A1B1) + W(A2B2). As shown in ESI Video S4,† the hydrogens in one sublattice keep a distance with neighbors; while in S5,† the hydrogens in one sublattice are closing to neighbors dynamically.
 | ||
| Fig. 4 Twelve normal modes in libration region (the side view is YZ plane). W, R, and T refer to wagging, rocking and twisting. It should be noted that 580, 582, 684 and 1032 cm−1 possess a common label although the actual vibration modes are different. | ||
Two typical sharp peaks in libration region are observed in INS spectrum.14,27 The frequencies of two distinct peaks are 443 cm−1 and 548 cm−1. They are observed in our results at 503 cm−1 (PDOS)/502 cm−1 (normal modes) and 561 cm−1 (PDOS)/580 cm−1 (normal modes), with numbers of blueshift. They assigned the second strong peak to twisting among the four molecules. We verify this assignment exactly by first-principles' outcomes.
Interestingly, the Raman spectrum also shows two sharp peaks at frequencies of 494 cm−1 and 548 cm−1.26 Kolesnikov et al. considered that the peak at the frequency of 494 cm−1 in the Raman data represents a weak peak at 484 cm−1 instead of the sharp peak at 443 cm−1 in his neutron data.27 He speculated that the vibration mode of the peak 443 cm−1, which is the left sharp peak in our work, does not contribute to the Raman spectrum. We can confirm the speculation by computing outcomes. According to our result, the two vibrations at 503 cm−1 (PDOS)/502 cm−1 (normal modes) are very weak in terms of Raman intensity active, hence, this peak cannot be recorded in Raman experiment. Further, the two sharp peaks are followed by an area of humps extended to another peak. Kolesnikov, Li and Wong's spectrum exhibit peaks at frequencies of 846, 874 and 862 cm−1.14,26,27 In contrast, we show a peak at 881 cm−1 (PDOS)/903 cm−1 (normal modes), which possesses the vibration mode that is R(A1B1) + W(A2B2) and W(A1B1) + R(A2B2), as shown in Fig. 4. A vibration mode at 1023 cm−1 (PDOS)/1032 cm−1 (normal modes) of twisting is recorded by Raman scattering and missed in neutron scattering.
Fig. 5 presents the inter-molecular translation vibrations. We use X, Y, Z to express the translational directions. The ESI Video S6† illustrates the vibration of the frequency at 237 cm−1. While A1 and B1 head toward the positive direction of the Z axis, A2 and B2 vibrate toward the negative direction. This vibration mode is named as Z(A1 − A2 + B1 − B2). In this region, there is a peak at 133 cm−1 in PDOS without normal modes. We consider this peak originated from acoustic branch. This is detectable in the INS spectrum of ice VIII at the frequency of 118 cm−1,27 but cannot be observed by photon scattering.
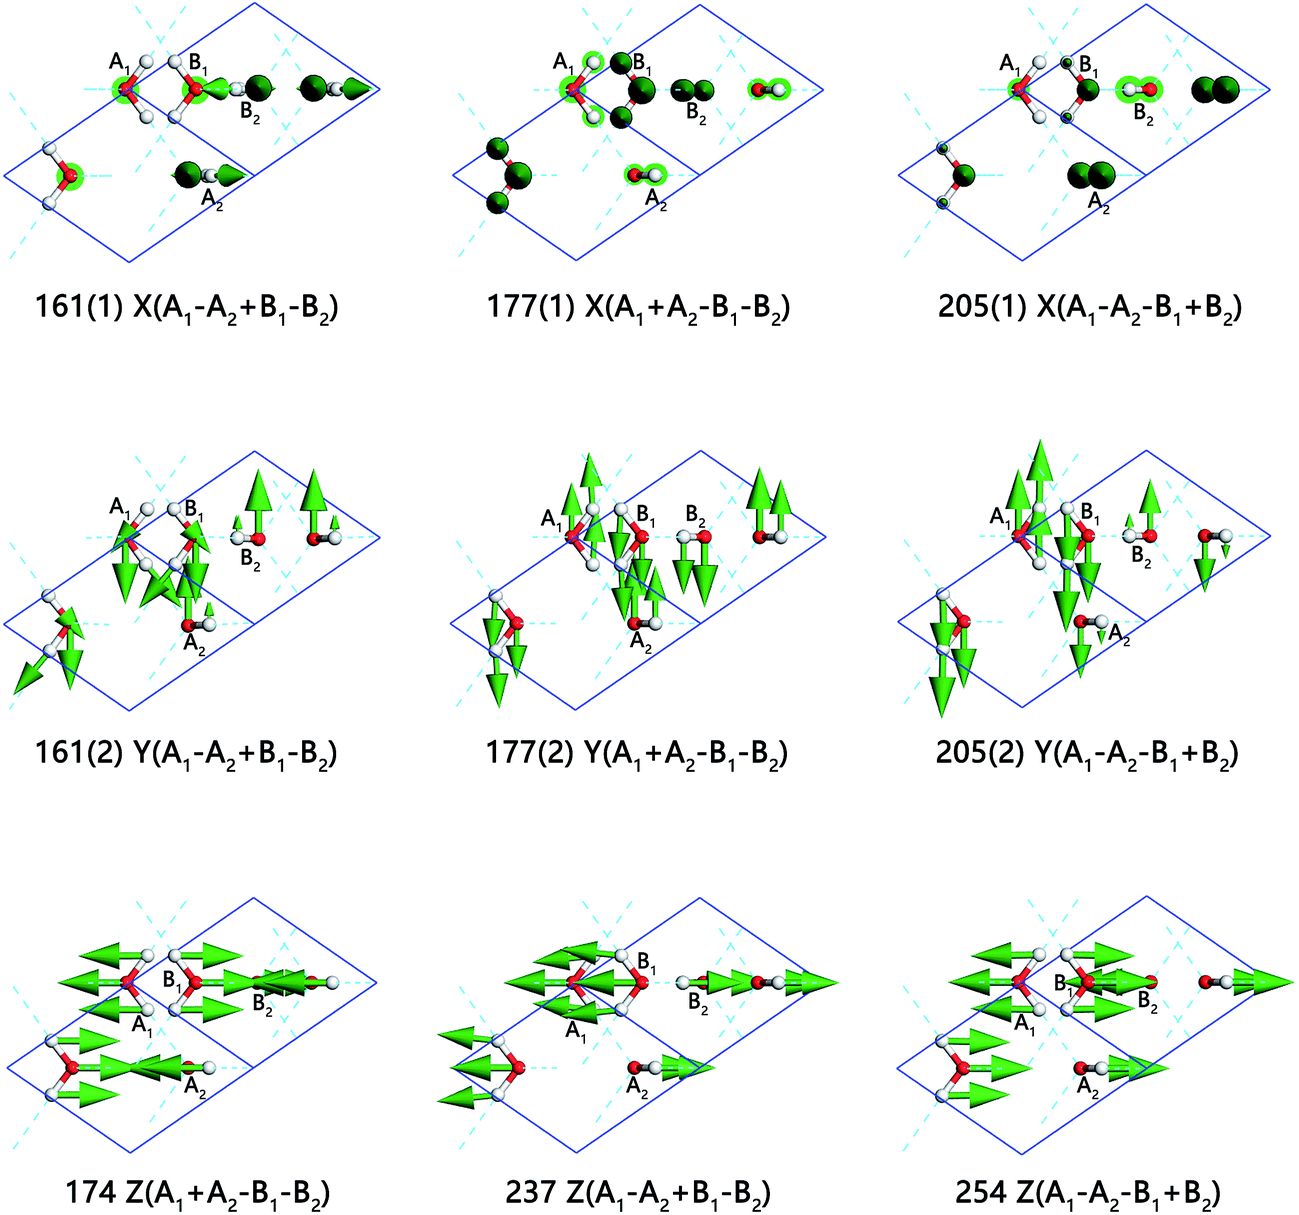 | ||
| Fig. 5 Nine normal modes in translation region (the side view is YZ plane). The first row displays three modes vibrating along the X axis. The row below contains three modes along Y axis, whose energy degenerate with the modes above. Three modes vibrating along Z axis are presented in the bottom row. | ||
The frequency at 161 cm−1 emerges energy degeneration in the basin plane perpendicular to Z axis (C axis in the unit cell). The two vibration modes are skeleton deformation, which have the lowest energy without H-bond vibrating. In Fig. 5, three vibration modes in the first row indicate all of the molecules vibrate along X axis. In the lowest translational vibration region of ice, Whale et al. put forward a “rigid-network modes” to depict the relevant movement of two interpenetrating sublattice networks in ice XV.33 Interestingly, we also observe this phenomenon for ice VIII. The mode of 177(1) cm−1 is caused by the vibration of two rigid networks against each other. A1 and A2 matched with an H-bond are vibrating toward the same direction, which means that the H-bond does not stretch in this condition. B1 and B2 are the same as A1 and A2 while they are vibrating toward the opposite direction. At the frequency of 205(1) cm−1, A1 and A2 vibrate toward opposite direction, which leads to an obvious H-bond stretching. B1 and B2 are in the same status as A1 and A2. As for three normal modes that vibrating along the Y axis, their energies degenerate with those three modes in the X direction due to the structure geometrical symmetry. In the third row, we present three modes vibrating along Z axis. The frequency of 174 cm−1 is a rigid-network mode too. As A1 is vibrating along Z axis, A2 is accompanying without H-bond stretching. Three rigid-network modes, located at 174, 177(1) and 177(2) cm−1, occur in this region, which is another case the same as ice XV. The H-bond that connects B1 and B2 does not change either. The modes at 237 cm−1 and 254 cm−1 are H-bond stretching. The differences between the two modes are the vibration directions of two penetrated sublattices. The INS spectrum observed three typical peaks in this band at 118, 167, and 215 cm−1. Due to the mixed with acoustic phonons, the peaks from INS are difficult to be assigned to special vibration modes. So we take INS signals in this region as fingerprint to distinguish different phases and do not identify the peaks individually.
Conclusions
In summary, according to the discussion of simulated spectra of ice VIII, one can see that the PDOS peaks in our results are in accord with inelastic neutron scattering data, which manifest the validity of the simulation in this paper. The 33 normal modes at BZ center are designated concisely and are used for peak assignments mainly from Raman scattering experiment.The main goals herein we achieved are: (1) presenting assignments for a vibration spectrum; (2) illustrating the special dynamic process and analyse their physical mechanism for a vibration mode; (3) pointing out the differences between neutron scattering and photon scattering. This combined method could not only present the physical insights for vibrational spectrum of crystalline material, but also figure out their differences between neutron scattering and photon scattering.
Conflict of interest
The authors declare no competing financial interest.Acknowledgements
This work is supported by the National Natural Science Foundation of China with Grant No. 11504202. The numerical calculations in this paper have been done on the supercomputing system in the Supercomputing Center, Shandong University, Weihai.References
- F. H. Stillinger, Nature, 1999, 401, 850–851 CrossRef CAS.
- J. E. Bertie and E. Whalley, J. Chem. Phys., 1967, 46, 1271–1284 CrossRef CAS.
- Y. Tajima, T. Matsuo and H. Suga, Nature, 1982, 299, 810–812 CrossRef CAS.
- J. E. Bertie, L. D. Calvert and E. Whalley, J. Chem. Phys., 1963, 38, 840–846 CrossRef CAS.
- W. F. Kuhs, J. L. Finney, C. Vettier and D. V. Bliss, J. Chem. Phys., 1984, 81, 3612–3623 CrossRef CAS.
- E. Whalley, J. B. R. Heath and D. W. Davidson, J. Chem. Phys., 1968, 48, 2362–2370 CrossRef CAS.
- K. R. Hirsch and W. B. Holzapfel, J. Chem. Phys., 1986, 84, 2771–2775 CrossRef CAS.
- C. Lobban, J. L. Finney and W. F. Kuhs, Nature, 1998, 391, 268–270 CrossRef CAS.
- C. G. Salzmann, P. G. Radaelli, A. Hallbrucker, E. Mayer and J. L. Finney, Science, 2006, 311, 1758–1761 CrossRef CAS PubMed.
- C. G. Salzmann, P. G. Radaelli, E. Mayer and J. L. Finney, Phys. Rev. Lett., 2009, 103, 105701 CrossRef PubMed.
- A. Falenty, T. C. Hansen and W. F. Kuhs, Nature, 2014, 516, 231–233 CrossRef CAS PubMed.
- Y. Huang, C. Zhu, L. Wang, X. Cao, Y. Su, X. Jiang, S. Meng, J. Zhao and X. C. Zeng, Sci. Adv., 2016, 2, e1501010 Search PubMed.
- E. Arunan, G. R. Desiraju, R. A. Klein, J. Sadlej, S. Scheiner, I. Alkorta, D. C. Clary, R. H. Crabtree, J. J. Dannenberg, P. Hobza, H. G. Kjaergaard, A. C. Legon, B. Mennucci and D. J. Nesbitt, Pure Appl. Chem., 2011, 83, 1637–1641 CAS.
- J. C. Li, C. Burnham, A. I. Kolesnikov and R. S. Eccleston, Phys. Rev. B: Condens. Matter Mater. Phys., 1999, 59, 9088–9094 CrossRef CAS.
- P. W. Bridgman, J. Chem. Phys., 1937, 5, 964–966 CrossRef CAS.
- E. Whalley and D. W. Davidson, J. Chem. Phys., 1965, 43, 2148–2149 CrossRef CAS.
- E. Whalley, D. W. Davidson and J. B. R. Heath, J. Chem. Phys., 1966, 45, 3976–3982 CrossRef CAS.
- G. P. Johari, A. Lavergne and E. Whalley, J. Chem. Phys., 1974, 61, 4292–4300 CrossRef CAS.
- M. Song, H. Yamawaki, H. Fujihisa, M. Sakashita and K. Aoki, Phys. Rev. B: Condens. Matter Mater. Phys., 2003, 68, 014106 CrossRef.
- J. M. Besson, M. Kobayashi, T. Nakai, S. Endo and P. Pruzan, Phys. Rev. B: Condens. Matter Mater. Phys., 1997, 55, 11191–11201 CrossRef CAS.
- P. Pruzan, J. C. Chervin and B. Canny, J. Chem. Phys., 1993, 99, 9842–9846 CrossRef CAS.
- A. F. Goncharov, V. V. Struzhkin, M. S. Somayazulu, R. J. Hemley and H. K. Mao, Science, 1996, 273, 218–220 Search PubMed.
- K. Aoki, H. Yamawaki, M. Sakashita and H. Fujihisa, Phys. Rev. B: Condens. Matter Mater. Phys., 1996, 54, 15673–15677 CrossRef CAS.
- D. D. Klug, Y. P. Handa, J. S. Tse and E. Whalley, J. Chem. Phys., 1989, 90, 2390–2392 CrossRef CAS.
- Y. Yoshimura, S. T. Stewart, M. Somayazulu, H. K. Mao and R. J. Hemley, J. Phys. Chem. B, 2011, 115, 3756–3760 CrossRef CAS PubMed.
- P. T. T. Wong and E. Whalley, J. Chem. Phys., 1976, 64, 2359–2366 CrossRef CAS.
- A. I. Kolesnikov, J. C. Li, D. K. Ross, V. V. Sinitzin, O. I. Barkalov, E. L. Bokhenkov and E. G. Ponyatovskii, Phys. Lett. A, 1992, 168, 308–312 CrossRef CAS.
- R. J. Hemley, L. C. Chen and H. K. Mao, Nature, 1989, 338, 638–640 CrossRef CAS.
- S. Klotz, T. Strässle, C. G. Salzmann, J. Philippe and S. F. Parker, Europhys. Lett., 2005, 72, 576–582 CrossRef CAS.
- S. J. Clark, M. D. Segall, C. J. Pickard, P. J. Hasnip, M. I. J. Probert, K. Refson and M. C. Payne, Z. Kristallogr., 2005, 220, 567–570 CAS.
- B. Hammer, L. B. Hansen and J. K. Norskov, Phys. Rev. B: Condens. Matter Mater. Phys., 1999, 59, 7413–7421 CrossRef.
- P. Zhang, Z. Wang, Y. B. Lu and Z. W. Ding, Sci. Rep., 2016, 6, 29273 CrossRef CAS PubMed.
- T. F. Whale, S. J. Clark, J. L. Finney and C. G. Salzmann, J. Raman Spectrosc., 2013, 44, 290–298 CrossRef CAS.
Footnote |
| † Electronic supplementary information (ESI) available. See DOI: 10.1039/c7ra05563c |
| This journal is © The Royal Society of Chemistry 2017 |