 Open Access Article
Creative Commons Attribution 3.0 Unported Licence
Platinum deposited on cerium coordination polymer for catalytic oxidation of hydroxymethylfurfural producing 2,5-furandicarboxylic acid
Wei Gong,
Kunkun Zheng and
Peijun Ji *
*
Department of Chemical Engineering, Beijing University of Chemical Technology, Beijing, China. E-mail: jipj@mail.buct.edu.cn; Tel: +86 10 64423254
First published on 11th July 2017
Abstract
2,5-Furandicarboxylic acid (FDCA) is a value added chemical that can be used as a polymer building block for the synthesis of biobased polymers. Developing efficient catalysts is fundamentally important for the selective oxidation of 5-hydroxymethylfurfural (HMF) into FDCA. In this work, a novel catalyst was prepared at mild conditions by forming platinum nanoparticles on a cerium coordination polymer (CeCP), which was synthesized using 1,3,5-benzenetricarboxylic acid as the ligand. The CeCP@Pt catalyst was utilized for the selective oxidation of highly concentrated HMF into FDCA. The yield of FDCA could reach 96.2% after 12 h of reaction at 70 °C in water at atmospheric conditions. Furthermore, this catalyst can be reused at least five times without significant activity loss. After five recycling cycles, the leaching of Pt from CeCP@Pt was negligible. This work demonstrated the advantages of the CeCP@Pt catalyst, including its easy preparation in mild conditions, application at relatively low temperatures and in atmospheric conditions, catalyzing the oxidation of HMF with a high concentration, and its reuse with a high stability.
1. Introduction
The development of platform chemicals from biomass resources is of significant importance from an environmental point of view. Among the biobased chemicals, 5-hydroxymethylfurfural (HMF) is a versatile platform chemical and can be used to synthesize valuable chemicals.1,2 Chemicals including 2,5-diformylfuran (DFF), 2,5-formylfurancarboxylic acid (FFCA), 5-hydroxymethyl-2-furancarboxylic acid (HMFCA), and 2,5-furandicarboxylic acid (FDCA) can be produced by the oxidation of HMF (Scheme 1). Among these chemicals, FDCA is a value added chemical. It can be used as a polymer building block for the synthesis of polyamides,3 polyesters,4 and bio-based epoxy resins.5 The promising biobased polymer polyethylene furanoate (PEF) can be produced from the esterification of ethane-1,2-diol and FDCA.6 By account of the growing demand for sustainable packaging materials, PEF has the potential to replace polyethylene terephthalate (PET), which has been used for the production of bottles for the packaging of water, soft drinks, and fruit juices.Selective oxidation of HMF generating FDCA has been extensively investigated. The aerobic oxidation of HMF into FDCA is generally carried out at alkaline conditions and at high temperatures and high pressures. With oxygen used as the oxidant, the aerobic oxidation was catalyzed mostly by heterogeneous catalysts.7–11 Noble-metal catalysts, including inorganic material-supported Pt, Pd, Ru and Au nanoparticles,12–15 have been extensively studied, as the catalysts can have long-term catalytic performance, high selectivity, and good recyclability. A magnetical catalyst based on Pd nanoparticles can achieve 86.7% yield of FDCA with reaction time 10 h.16 The Pd/C catalysts reported by Davis et al. converted 100% HMF with a FDCA yield of 71% with 2 equivalent NaOH at 69 bar.17 CeO2-Supported Au nanoparticles exhibited the oxidation of HMF into FDCA with a yield of 99% at 130 °C with 4 equivalents of NaOH.18 However, the catalyst lost its activity after one cycle. Supported Pt catalysts have shown high activity for the oxidation of HMF into FDCA. Carbon-supported Pt catalysts produced FDCA with yields of 81% by Verdeguer et al.19 and 79% by Davis et al.17 PVP-Stabilized Pt (Pt–PVP–GLY) achieved a FDCA yield of 95% at 80 °C after 24 h.20 The oxidation of HMF catalyzed by reduced graphene oxide-supported metal nanoparticles produced FDCA with a yield of 40.6%.21 γ-A12O3-Supported Pt (Pt/γ-A12O3) and ZrO2-supported Pt (Pt/ZrO2) produced FDCA with yields of 96% and 94%, respectively.22,23 In contrast, TiO2-supported Pt (Pt/TiO2) and CeO2-supported Pt (Pt/CeO2) catalysts produced FDCA with low yields of 2% and 8%, respectively.23 Addition of Bi to the supports can improve the catalytic performance. The Pt–Bi/C catalyst achieved a FDCA yield of 98% under 40 bar air at 100 °C.24 Pt–Bi/TiO2 catalyst also showed high catalytic activity and stability.25 Pt–Bi/CeO2 catalyst could also significantly improve the catalytic efficiency.26
In this work, cerium coordination polymer (CeCP) was synthesized using 1,3,5-benzenetricarboxylic acid as the ligand. Platinum nanoparticles were formed and deposited on the surface of CeCP. The composite CeCP@Pt was utilized for the oxidation of the oxidation of 5-hydroxymethylfurfural producing 2,5-furandicarboxylic acid.
2. Experiment
2.1. Materials
5-Hydroxymethylfurfural (≥99%), Ce(NO3)3·6H2O (99.999%), 1,3,5-benzenetricarboxylic acid (≥99%), chloroplatinic acid (99.995%), and NaBH4 (≥98%) were purchased from Sigma-Aldrich (Shanghai, China).2.2. Preparation of CeCP@Pt
2.17 g Ce(NO3)3·6H2O was dissolved in 45 ml H2O, the solution was designated as solution A. 1.05 g 1,3,5-benzenetricarboxylic acid was dissolved in 15 ml ethanol/water (v/v = 1![[thin space (1/6-em)]](https://www.rsc.org/images/entities/char_2009.gif) :
:![[thin space (1/6-em)]](https://www.rsc.org/images/entities/char_2009.gif) 1), the solution was designated as solution B. At 60 °C under stirring, solution A was added dropwise to solution B, and stirring was carried out for 2 h. Then the mixture was cooled to room temperature. The mixture was then filtered, washed first with water and then with ethanol until the filtrate being neutral. The synthesized CeCP was finally dried at 60 °C under vacuum for 12 h.
1), the solution was designated as solution B. At 60 °C under stirring, solution A was added dropwise to solution B, and stirring was carried out for 2 h. Then the mixture was cooled to room temperature. The mixture was then filtered, washed first with water and then with ethanol until the filtrate being neutral. The synthesized CeCP was finally dried at 60 °C under vacuum for 12 h.
CeCP@Pt composites were prepared using CeCP and chloroplatinic acid hydrate (H2PtCl6). Different CeCP to H2PtCl6 mass ratios were used. 5 mg CeCP was dispersed in 40 ml ethanol and sonicated for 10 min. Then 0.23, 0.27, 0.54, 0.81, and 1.35 ml of the solutions of chloroplatinic acid (15.8 mg ml−1) were separately added dropwise and sonicated for 10 min. Then the freshly prepared sodium borohydride solution (NaBH4, 30 mM, 1 ml) was added and sonicated for 5 min. The resulting products were centrifuged (7000 rpm for 20 min) and washed with ultrapure water by filtration through 450 nm pore size membrane. The centrifugation and washing steps were repeated 3 times.
2.3. Determination of Pt loading
The platinum content in CeCP@Pt was determined by inductively coupled plasma (ICP) atomic emission spectrometric analysis (PerkinElmer OPTIMA 3300DV). The solution for digestion consisted of concentrated HNO3 (10 ml), concentrated HCl (3 ml), and HF (50 wt%, 2 ml). 1 g sample was digested in the solution. After digestion, the sample was diluted 10 fold with deionized water. The solution was subjected to ICP atomic emission spectrometric analysis.2.4. Aerobic oxidation of HMF
0.5 mmol of HMF and different amounts of sodium hydroxide (NaOH) were dissolved in water (10 ml) at 70 °C. Then a certain amount of CeCP@Pt catalyst was introduced to the mixture to initiate the reaction. During the reaction, oxygen was permitted to flow at the bottom of the reactor continuously with a flow rate of 30 ml min−1. After the reaction, the catalyst was collected after washing and centrifugation, and dried under vacuum (45 °C) for the next recycling reaction.The substrate and intermediate and final products were analyzed by HPLC (Shimadzu 15 LC-10A) with a Zorbax Eclipse XDB-C8 column (Agilent). The mobile phase consisted of phosphate buffer (12 mM, pH 7.0) and acetonitrile at a flow rate of 1.3 ml min−1. After 1.5 min of phosphate buffer, acetonitrile was increased to 5% in 4.0 min and subsequently to 40% in 3 min. After 0.5 min of acetonitrile, the eluent was returned to phosphate buffer in 0.5 min and this level was maintained for 2 min. Detection was carried out at 268 nm.
2.5. Characterization
The morphology of CeCP@Pt was observed by transmission electron microscopy (TEM) images, which were recorded on a FEI Tecnai G2 F20 S-TWIN instrument. XPS spectra were measured using an X-ray photoelectron spectrometer (Thermo VG ESCALAB250, Beijing, China). The measurement was carried out at the pressure of 2 × 10⁻⁹ Pa. Mg KX-ray was used as the excitation source. The weight percentage of Pt in the CeCP@Pt composite was analyzed by energy dispersive X-ray spectroscopy (EDS) using a JEOL JSM-6700F microscope.2.6. Catalysis comparison
The calcination of CeCP at 650 °C resulted in CeOcal2. Pt was supported on the CeOcal2 and on commercial CeO2 (CeOcom2) with the same preparation procedure as that for CeCP@Pt (5.4%). 5 mg CeOcal2 or CeOcom2 was dispersed in 40 ml ethanol and sonicated for 10 min. Then 0.23 ml of the chloroplatinic acid solution (15.8 mg ml−1) was added dropwise and sonicated for 10 min. Then the freshly prepared sodium borohydride solution (NaBH4, 30 mM, 1 ml) was added and sonicated for 5 min. The resulting product was centrifuged (7000 rpm for 20 min) and washed with ultrapure water by filtration through a membrane (450 nm). The centrifugation and washing steps were repeated three times.2.7. CO chemisorption
CO chemisorption on the CeCP@Pt catalysts was measured to determine the Pt dispersion on CeCP (Auto Chem 2910 instrument). The catalysts were pretreated by reduction at 573 K in He-balanced H2 (11.0%). At room temperature, CO pulses (He mixture with 10.0% of CO) were injected over the reduced catalyst. The CO adsorption was assumed to be completed after three successive peaks showing the same peak areas. A CO/Pt stoichiometry of 1 was used for the calculation of the dispersion of Pt.3. Results and discussion
3.1. Characterization of Pt deposited Ce coordination polymer
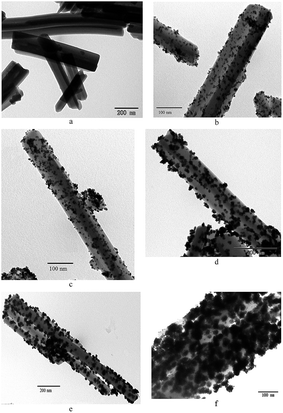
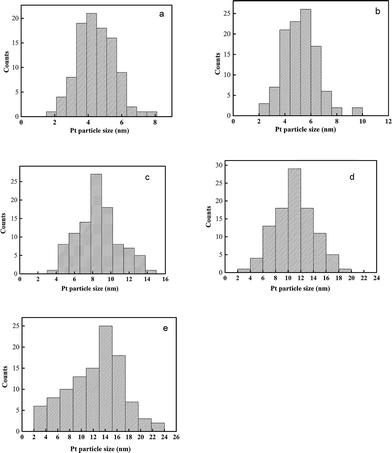
Different CeCP to H2PtCl6 mass ratios were used for the preparation of CeCP@Pt. The Pt content of the obtained CeCP@Pt was 5.4%, 10%, 19.9%, 32.6%, and 52.7%, respectively, examined using inductively coupled plasma atomic emission spectrometric analysis. TEM images for the samples of CeCP and CeCP@Pt are shown in Fig. 1. CeCP itself exhibited a rod-like morphology (Fig. 1a). The Pt nanoparticles were in situ formed on CeCP. After loading Pt, CeCP has kept its original morphology. The Pt nanoparticles have been well distributed on the surface of CeCP. The size of Pt nanoparticles was affected by the amounts loaded. With more Pt deposited on CeCP, larger Pt nanoparticles were formed. The size-distribution of Pt nanoparticles are shown in Fig. 2, and the averaged sizes of the Pt nanoparticles are listed in Table 1.| Percentage of Pt loaded | 5.4% | 10% | 19.9% | 32.6% | 52.7% |
| Average size of Pt particle (nm) | 4.5 | 5.2 | 8.5 | 11.0 | 14.5 |
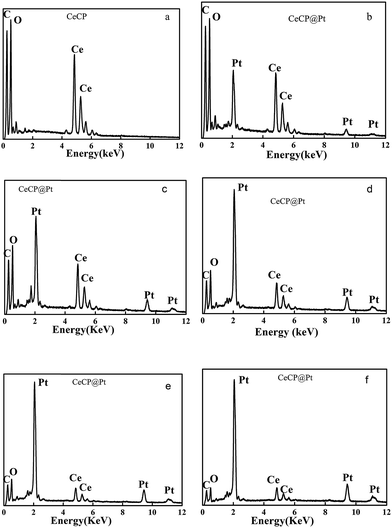
Energy dispersive X-ray spectroscopy (EDS) has been used to analyze the elements. The obtained EDS spectra are shown in Fig. 3. Fig. 3a is the control for CeCP with peaks for C at 0.235 keV, O at 0.52 keV, and Ce at 4.85 and 5.28 keV.10 The spectra in Fig. 3b–f are the results of the CeCP@Pt samples with different loading of Pt. The peaks for Pt appeared in the spectra at 2.66, 9.44, and 11.13 keV,10 confirming the deposition of Pt on CeCP. With loading more Pt, the peak intensity of Pt is relatively increased as shown in Fig. 3b–f. The percentage of Pt is indicated in the brackets of the subtitle, which was determined by inductively coupled plasma (ICP) atomic emission spectrometric analysis.
X-ray photoelectron spectroscopy (XPS) spectra were also measured for the samples as shown in Fig. 4. For the CeCP@Pt samples, the Pt peaks appeared. With more Pt deposited on CeCP, the peak intensity for Pt was increased. The oxidation states of the Pt nanoparticles were analyzed by Pt 4f core-level XPS, which were fitted by spin–orbit split 4f7/2 and 4f5/2 components (Fig. 5). The fractions of Pt0 (71.4 eV and 74.8 eV), Pt2+ (72.4 eV and 76.8 eV), and Pt4+ (75.2 eV and 78.6 eV) were determined by measuring the areas of the respective peaks and are listed in Table 2. Pt0 is the predominant species on the surface of CeCP@Pt, the oxidized Pt species was slightly decreased with the increase of Pt loading. The oxygen in the high-valence Pt species might come from the ambient air.
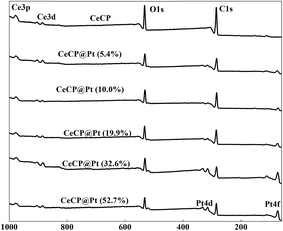 | ||
| Fig. 4 XPS spectra for CeCP@Pt with different percentage of Pt. The numbers in brackets indicate the weight percentage of Pt. | ||
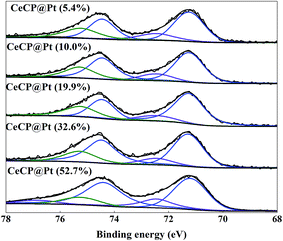 | ||
| Fig. 5 The Pt 4f regions of the XPS spectrum of the series CeCP/Pt catalysts. The numbers in brackets indicate the weight percentage of Pt. | ||
| Samples | Pt0 fractions Pt0/(Pt0 + Pt2+ + Pt4+) |
|---|---|
| a The numbers in brackets indicate the weight percentage of Pt. | |
| CeCP@Pt (5.4%) | 70.1% |
| CeCP@Pt (10.0%) | 70.1% |
| CeCP@Pt (19.9%) | 72.3% |
| CeCP@Pt (32.6%) | 73.4% |
| CeCP@Pt (52.7%) | 73.2% |
The N2 adsorption and desorption isotherms of CeCP are shown in Fig. 6a. The BET specific surface area of CeCP is 28.0 m2 g−1 with pore volumes of 0.10 cm3 g−1. The crystalline structures of the prepared CeCP were analyzed using a powder XRD technique (Fig. 6b). The sharp peak at 2θ = 17.4 indicates that the prepared CeCP was crystalline, which was coincident with previously reports in the literature.27,28 Fig. 6c shows the FTIR spectrum for CeCP. The characteristic peaks at 1612–1557 and 1435–1373 cm−1 are ascribed to the stretching vibrations νassy(–COO–) and νsym(–COO–) of the carboxylate ions, and 531 cm−1 is due to the Ce–O stretching vibration.29
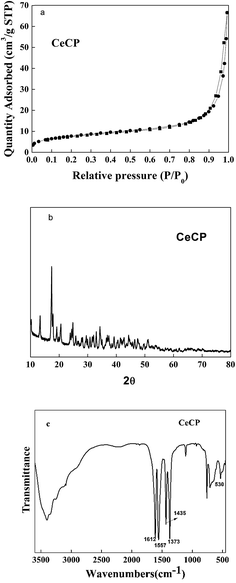 | ||
| Fig. 6 (a) N2 adsorption and desorption isotherms measured at 77 K for CeCP; (b) XRD pattern of CeCP; (c) FTIR spectrum of CeCP. | ||
3.2. Catalyzing the oxidation of HMF
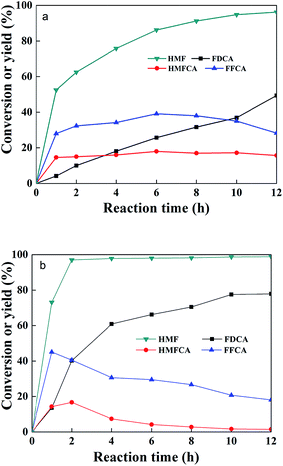
The catalytic oxidation of HMF into FDCA in water at 70 °C was carried out with 2 equivalents NaOH at atmospheric pressure. The substrate conversion and intermediate and final products are shown in Fig. 7. During the reaction, the intermediate products of HMFCA, DFF, and FFCA were monitored by HPLC. It was found that only HMFCA was detected without any trace of DFF. It is indicated that the oxidation of HMF was accomplished through the pathway with HMFCA as the intermediate (Scheme 1). At temperatures lower than 70 °C, the FDCA yield could not be higher than 90%. A high reaction temperature facilitates the oxidation of HMF into FDCA, for example the FDCA yield 94% was obtained at 100 °C for 12 h,30 88% at 120 °C for 10 h,31 98% 90 °C for 14 h,32 95% at 80 °C for 24 h, and 100% at 90 °C for 4 h.33 In this work, the yield of FDCA was 96.2% at 70 °C after 12 h reaction.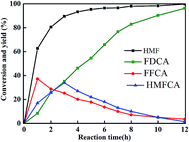 | ||
| Fig. 7 Results of HMF oxidation in the water. Reactions: 4 mg ml−1 CeMOF@Pt, 50 mM HMF, O2 flow rate 30 ml min−1, 2 equivalent NaOH, reaction temperature 70 °C and time 12 h. | ||
To investigate the effect of NaOH amount on the yield of FDCA, the oxidation of HMF into FDCA was carried out at 70 °C with a constant flow rate of 30 ml min−1 for oxygen, and different amounts of anhydrous NaOH were used (Fig. 8). The optimal amount of NaOH is 2 equivalents. When NaOH was decreased from 2 equivalents to 1 equivalent, the FDCA yield was reduced from 96.2% to 59.45%. When NaOH was increased from 2 equivalents to 3 and 4 equivalents, the FDCA yields were reduced from 96.2% to 80.59% and 68.5%, respectively. These results demonstrated that the amount of NaOH has a significant effect on the yield of FDCA, an appropriate amount of base (NaOH) is required to obtain the highest yield of FDCA. The intermediates HMFCA and FFCA and the target product FDCA are acids. The molecules of these acidic chemicals have a strong tendency to associate each other and form precipitates. The added NaOH can neutralize the acidic chemicals, increasing their solubility in water once generated. Thus, addition of NaOH can effectively prevent the formation of precipitates on the surface of CeCP@Pt. The function of NaOH can also explain that water is better than other solvents, including toluene, DMSO, DMF, and ethanol, for the oxidation of HMF. CeCP@Pt has the highest catalysis efficiency in water than in other solvents, in terms of HMF conversion and FDCA yield (Fig. 9). NaOH can be better dissolved in water than in other solvents. The acidic chemicals HMFCA, FFCA, and FDCA can be better neutralized by NaOH in water than in other solvents.
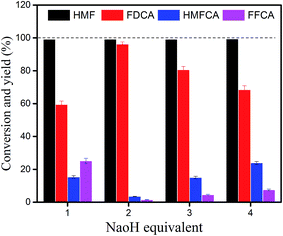 | ||
| Fig. 8 Effect of NaOH concentration on the conversion of HMF and yield of FDCA. Reaction conditions: 1.0 mg ml−1 CeCP@Pt, oxygen flow rate 30 ml min−1, HMF 50 mM, at 70 °C for 12 h. | ||
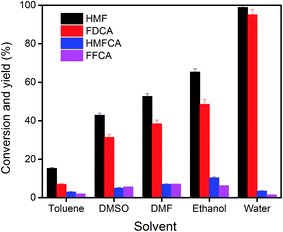 | ||
| Fig. 9 HMF oxidation in various solvents. Reaction conditions: 4.0 mg ml−1 CeCP@Pt, oxygen flow rate 30 ml min−1, HMF 50 mM, at 70 °C for 12 h, 2 equivalents of NaOH. | ||
Different amounts of catalysts were used for the oxidation of HMF, from 1.0 mg ml−1 to 4.0 mg ml−1. HMF was almost completely converted for the four samples (Fig. 10). The yield of FDCA was dependent on the amount of catalyst used. With 1.0 mg ml−1 CeCP@Pt, the yield of FDCA was 80.2%. This yield was increased to 96.2% by using 4.0 mg ml−1 CeCP@Pt. However, the difference in FDCA yield was not so significant between the catalyst amounts of 1.0 mg ml−1 and 4.0 mg ml−1. The results in Fig. 10 indicate that with relatively low amount of catalyst, the yield of FDCA is also acceptable.
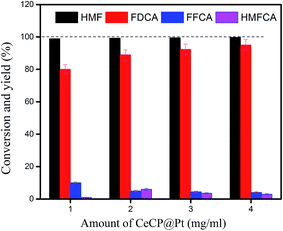 | ||
| Fig. 10 Oxidation of HMF using different amounts of catalyst. Reaction conditions: oxygen flow rate 30 ml min−1, HMF 50 mM, at 70 °C for 12 h, 2 equivalents of NaOH. | ||
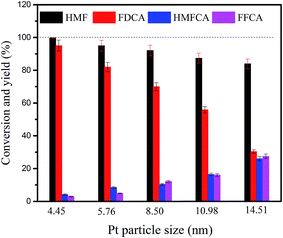
The effect of the size of Pt particle of CeCP@Pt on the HMF conversion and product yields is shown in Fig. 11. Both the HMF conversion and FDCA yield under the catalysis of CeCP@Pt (4.45 nm) are higher than that catalyzed by CeCP@Pt with Pt particle size larger than 4.45 nm. The results indicate that the deposited Pt with a smaller particle size is favorable to have a higher catalysis efficiency in terms of HMF conversion and FDCA yield. It is possibly because that with smaller Pt particles, there are more unsaturated active sites on the surface of the catalyst, conferring the catalyst a better activity.32
Turnover frequency (TOF) has been commonly used to compare different catalysts. Herein TOF is defined as the number of HMF molecules converted per atom of exposed platinum on the surface per unit time. TOF for the CeCP@Pt catalysts is listed in Table 3. Obviously, the TOF number is decreased with the Pt particle size. It is because that with smaller Pt particles, there are more active sites on the surface of the catalyst, conferring the catalyst a better activity.
| Catalysts | TOF (s−1) | HMF conversion (%) | Pt dispersion |
|---|---|---|---|
| CeCP@Pt (4.5 nm) | 0.177 | 59.3 | 0.168 |
| CeCP@Pt (5.2 nm) | 0.166 | 43.8 | 0.143 |
| CeCP@Pt (8.5 nm) | 0.153 | 36.0 | 0.128 |
| CeCP@Pt (11.0 nm) | 0.075 | 18.2 | 0.118 |
| CeCP@Pt (14.5 nm) | 0.071 | 15.1 | 0.109 |
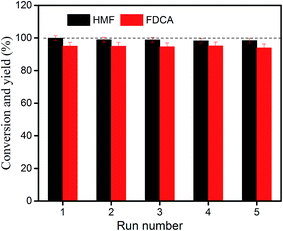
To investigate the reusability of CeCP@Pt, the catalyst was reused for catalyzing the HMF oxidation. After washing with water and subsequently ethanol, the catalyst was dried and reutilized in a new catalysis cycle. Each reuse of CeCP@Pt was carried out at 70 °C for 12 h with 2 equivalents of NaOH. Fig. 12 shows the results of reuse of CeCP@Pt for five times. The conversion of HMF was 98.2% after five cycles, and the yields of FDCA were from initial 96.2% to 95.3% of the fifth cycle. The results in Fig. 12 demonstrated that the CeCP@Pt catalyst can be reused at least five times without significant loss of activity. The leaching of Pt from CeCP@Pt was also detected by ICP atomic emission spectrometric analysis. It was demonstrated that Pt leaching was negligible after five cycles of reuse of CeCP@Pt, indicating a good stability of the catalyst.
Fig. 13 shows the results of HMF oxidation in water catalyzed by other two catalysts: Pt supported on CeO2 that was derived from the CeCP calcination (Pt@CeOcal2), Pt deposited on commercial CeO2 (Pt@CeOcom2). The FDCA yields were 49.4% and 77.9% for Pt@CeOcal2 and Pt@CeOcom2, respectively. However, these yields are lower than 96.2% that was achieved by CeCP@Pt (Fig. 7). Comparison of the results in Fig. 13 and 7 demonstrated the advantage of the catalyst CeCP@Pt over the catalysts Pt@CeOcal2 and Pt@CeOcom2.
4. Conclusions
Cerium coordination polymer (CeCP) was synthesized with 1,3,5-benzenetricarboxylic acid as the ligand, and platinum nanoparticles were formed in situ on CeCP. The CeCP@Pt catalysts were utilized for selective oxidation of high concentration HMF into FDCA. The yield of FDCA could reach 96.2% after 12 h of reaction at 70 °C in water at atmospheric pressure. Furthermore, this catalyst can be reused at least five times without significant activity loss. After five recycles, the leaching of Pt from CeCP@Pt was negligible. This work demonstrated the advantages of the CeCP@Pt catalyst, including easy preparation at mild condition, application at relative low temperature and at atmospheric pressure, catalyzing the oxidation of HMF with a high concentration, and reuse with a high stability.Acknowledgements
This work was supported by The National Science Foundation of China (21476023).References
- S. Alipour, Green Chem., 2016, 18, 4990–4998 RSC.
- Y. Wang, S. De and N. Yan, Chem. Commun., 2016, 52, 6210–6224 RSC.
- K. Luo, Y. Wang, J. Yu, J. Zhu and Z. Hu, RSC Adv., 2016, 6, 87013–87020 RSC.
- Y. Jiang, A. J. J. Woortman, G. O. R. A. van Ekenstein, D. M. Petrović and K. Loos, Biomacromolecules, 2014, 15, 2482–2493 CrossRef CAS PubMed.
- J. Deng, X. Liu, C. Li, Y. Jiang and J. Zhu, RSC Adv., 2015, 5, 15930–15939 RSC.
- M. E. Davis, Top. Catal., 2015, 58, 405–409 CrossRef CAS.
- N. K. Gupta, S. Nishimura, A. Takagaki and K. Ebitani, Green Chem., 2011, 13, 824–827 RSC.
- Z. Zhang, J. Zhen, B. Liu, K. Lv and K. Deng, Green Chem., 2015, 17, 1308–1317 RSC.
- S. E. Davis, B. N. Zope and R. J. Davis, Green Chem., 2012, 14, 143–147 RSC.
- Y. Zhang, Z. Xue, J. Wang, X. Zhao, Y. Deng, W. Zhao and T. Mu, RSC Adv., 2016, 6, 51229–51237 RSC.
- X. Han, L. Geng, Y. Guo, R. Jia, X. Liu, Y. Zhang and Y. Wang, Green Chem., 2016, 18, 1597–1604 RSC.
- L. Prati, A. Villa, M. Schiavoni, S. Campisi and G. M. Veith, ChemSusChem, 2013, 6, 609–612 CrossRef PubMed.
- N. K. Gupta, S. Nishimura, A. Takagaki and K. Ebitani, Green Chem., 2011, 4, 824–827 RSC.
- S. E. Davis, B. N. Zope and R. J. Davis, Green Chem., 2012, 1, 143–147 RSC.
- D. J. Chadderdon, L. Xin, J. Qi, Y. Qiu, P. Krishna, K. L. More and W. Z. Li, Green Chem., 2014, 16, 3778–3786 RSC.
- B. Liu, Y. Ren and Z. Zhang, Green Chem., 2015, 17, 1610–1617 RSC.
- S. E. Davis, L. R. Houk, E. C. Tamargo, A. K. Datye and R. J. Davis, Catal. Today, 2011, 160, 55–60 CrossRef CAS.
- O. Casanova and A. Corma, ChemSusChem, 2009, 2, 1138–1144 CrossRef CAS PubMed.
- P. Verdeguer, N. Merat and A. Gaset, J. Mol. Catal., 1993, 85, 327–344 CrossRef CAS.
- S. Siankevich, G. Savoglidis, Z. Fei, G. Laurenczy, D. T. L. Alexander, N. Yan and P. J. Dyson, J. Catal., 2014, 315, 67–74 CrossRef CAS.
- W. Q. Niu, D. Wang, G. H. Yang, J. Sun, M. B. Wu, Y. Yoneyama and N. Tsubaki, Bull. Chem. Soc. Jpn., 2014, 87, 1124–1129 CrossRef CAS.
- P. Vinke, W. V. Poel and V. BikkumH, Studies in Surface Science and Catalysis, Elsevier, Amsterdam, 1991, vol. 59, pp. 385–394 Search PubMed.
- R. Sahu and P. L. Dhepe, React. Kinet., Mech. Catal., 2014, 112, 173–187 CrossRef CAS.
- H. A. Ait Rass, N. Essayem and M. Besson, Green Chem., 2013, 15, 2240–2251 RSC.
- H. A. Ait Rass, N. Essayem and M. Besson, ChemSusChem, 2015, 8, 1206–1217 CrossRef CAS PubMed.
- Z. Z. Miao, T. X. Wu, J. W. Li, T. Yi, Y. B. Zhang and X. G. Yang, RSC Adv., 2015, 5, 19823–19829 RSC.
- K. Liu, H. You, G. Jia, Y. Zheng, Y. Huang, Y. Song, M. Yang, L. Zhang and H. Zhang, Cryst. Growth Des., 2010, 10, 790–797 CAS.
- Y. Xiong, S. Chen, F. Ye, L. Su, C. Zhang, S. Shen and S. Zhao, Chem. Commun., 2015, 51, 4635–4638 RSC.
- S. Maiti, A. Pramanik and S. Mahanty, Chem. Commun., 2014, 50, 11717–11720 RSC.
- X. Wan, C. Zhou, J. Chen, W. Deng, Q. Zhang, Y. Yang and Y. Wang, ACS Catal., 2014, 4, 2175–2185 CrossRef CAS.
- G. Yi, S. P. Teong and Y. Zhang, Green Chem., 2015, 18, 979–983 RSC.
- C. Zhou, W. Deng, X. Wan, Q. Zhang, Y. Yang and Y. Wang, ChemCatChem, 2015, 7, 2853–2863 CrossRef CAS.
- H. Chen, J. Zhou and J. Deng, Polym. Chem., 2016, 7, 125–134 RSC.
| This journal is © The Royal Society of Chemistry 2017 |


