
 Open Access Article
 This Open Access Article is licensed under a
 Creative Commons Attribution 3.0 Unported Licence
Rhodamine 6G hydrazone with coumarin unit: a novel single-molecule multianalyte (Cu2+ and Hg2+) sensor at different pH value†
Zhou-Qing Xu ,
Xian-Jie Mao,
Yuan Wang*,
Wei-Na Wu*,
Pan-Dong Mao,
Xiao-Lei Zhao,
Yun-Chang Fan and
Hui-Jun Li*
,
Xian-Jie Mao,
Yuan Wang*,
Wei-Na Wu*,
Pan-Dong Mao,
Xiao-Lei Zhao,
Yun-Chang Fan and
Hui-Jun Li*
College of Chemistry and Chemical Engineering, Henan Polytechnic University, Jiaozuo 454000, P. R. China. E-mail: wangyuan08@hpu.edu.cn; wuwn08@hpu.edu.cn; lihuijunxgy@hpu.edu.cn
First published on 1st September 2017
Abstract
A rhodamine derivative was synthesised via the hydrazone formation of rhodamine 6G hydrazide with 7-diethylamino-3-(1-hydroxy-3-oxobut-1-enyl)-2H-chromen-2-one. As a colourimetric and ratiometric fluorescent probe, the derivative exhibited high selectivity towards Cu2+ in neutral aqueous media. Moreover, the probe sensed Hg2+ with fluorescence enhancement at pH 10. The binding process was confirmed via UV-vis absorption, fluorescence measurements, 1H NMR, mass spectroscopy and density functional theory calculation. To validate the applicability of the probe, the probe was used to detect Cu2+ and Hg2+ ions in actual water samples. The application of the fluorescent sensor in monitoring intracellular Cu2+ in Hela cells has also been demonstrated.
Introduction
Cu2+ has an important role in the biological systems of plants, living cells and humans. High Cu2+ concentrations, however, cause oxidative stress and disorders that are associated with neurodegenerative diseases, such as Alzheimer's, Wilson's and Menke's diseases.1–3 Given the significant physiological relevance and associated biomedical implications of Cu2+, methods for the highly selective and sensitive detection of Cu2+ ions are crucial.4–6 Cu2+ ions have been detected using several analytical techniques, including atomic absorption spectrometry,7 inductively coupled plasma atomic emission spectrometry,8 voltammetry and electrochemical methods.9,10 Nonetheless, these methods are complex, time consuming and/or need special equipment. In addition, they require complicated sample preparation and Cu2+ extraction via tissue or cell destruction; therefore, these methods are unsuitable for living biosystems.11 Due to their high selectivity and sensitivity, fluorescent probes have been widely applied in recent years for the detection of anions, cations and biological molecules and for real-time imaging.11–14The rhodamine framework is extensively used as a chemosensor due to its excellent photophysical properties, such as long absorption and emission wavelengths, high fluorescence quantum yield, high extinction coefficient and high photostability.15 Selective chemiluminescence, colorimetric and fluorescence turn-on rhodamine-based sensors, especially rhodamine hydrazones for Cu2+ have been successfully developed.15–30 Nevertheless, various factors, such as instrumental efficiency, environmental condition and probe concentration, interfere with the performance of turn-on probes.31,32 Accordingly, some ratiometric fluorescent probes for Cu2+ containing rhodamine and coumarin,33,34 indole,35,36 cyanine,37 pyrene38 or naphthalimide32 groups have been reported to alleviate this problem through guest-induced fluorescence resonance energy transfer (FRET) or bond energy transfer (BET) mechanism. Some of these probes, however, require complicated synthesis procedures that involve harsh reaction conditions and expensive chemicals.32
A novel design concept of a single chemosensor for multiple analytes has recently emerged.18 The detection methods for numerous metal ions with differential responses are more efficient and less expensive than one-to-one analytical methods.38–41 Hg2+ is one of the most toxic metal ions. When present in soil or effluent water, Hg2+ is assimilated and converted by lower-order aquatic organisms into methylmercury, which is one of the most potent neurotoxins to humans.42–46 Therefore, the development of a new fluorescent probe for the simultaneous detection of Cu2+ and Hg2+ is highly desirable.
Although many rhodamine-based dual-function fluorescent chemosensors for Cu2+ and Hg2+ are available,18,34,39,47,48 the selective detection of Cu2+ and Hg2+ at different pH conditions is rarely reported.48 Coumarin dye exhibits excellent photochemical and photophysical properties, and has a low toxicity to the environment and the human body. Several coumarin-based chemosensors exhibit effective fluorescence enhancement for the recognition of Hg2+.49,50 Meanwhile, some coumarin β-diketones have been used as on-off fluorescent chemosensors to selectively detect Cu2+.51,52 Thus, in this paper, we report RC1 (Scheme 1). Under neutral conditions, RC1 acts as a ratiometric fluorescent probe for Cu2+ via hydrolysis. In a basic environment (pH 10), RC1 acts as a fluorescence-enhanced probe towards Hg2+ via the coordination mechanism. RC1 is easily prepared via a simple Schiff base condensation reaction. The application of the fluorescent sensor was further used for detecting Cu2+ and Hg2+ ions in actual water samples, and for imaging of Cu2+ in living cells.
 | ||
| Scheme 1 Synthesis route of the sensor RC1. | ||
Experimental section
Materials and instrumentation
Solvents and starting materials for synthesis were purchased commercially and used as received. Rhodamine 6G hydrazide and 7-diethylamino-3-(1-hydroxy-3-oxobut-1-enyl)-2H-chromen-2-one were synthesized according to the literature methods.27,51 The melting point of the probe is determined on an XT4-100X microscopic melting point apparatus (made in Beijing, China). Elemental analyses were carried out on an Elemental Vario EL analyzer. 1H NMR and 13C NMR spectra are recorded on a Bruker AV400 NMR spectrometer in DMSO-d6 solution. The UV spectra were recorded on a Purkinje General TU-1800 spectrophotometer. Fluorescence spectra were determined on a Varian CARY Eclipse spectrophotometer, in the measurements of emission and excitation spectra the pass width is 5 nm. ESI-MS spectra were obtained on a Bruker Daltonics Esquire 6000 mass spectrometer. The X-ray diffraction measurement for RC1·1.5CH3CN was performed on a Bruker SMART APEX II CCD diffractometer equipped with a graphite monochromatized MoKα radiation (λ = 0.71073 Å) by using φ–ω scan mode. Semi-empirical absorption correction was applied to the intensity data using the SADABS program.53 The structure was solved by direct method and refined by full matrix least-square on F2 using the SHELXTL-97 program.54 All non-hydrogen atoms were refined anisotropically. Except for one half of crystal CH3CN, all the other H atoms were positioned geometrically and refined using a riding model.Synthesis of RC1
A quantity of rhodamine 6G hydrazide (428 mg, 1 mmol) was added to a CH3CN solution (20 mL) containing 7-diethylamino-3-(1-hydroxy-3-oxobut-1-enyl)-2H-chromen-2-one (301 mg, 1 mmol). The mixture was refluxed for 12 h with three drops of acetic acid. The separated solid was filtered, washed with CH3CN, and then recrystallized in CH3CN solution. Yield 45%. Mp 212–216 °C. Anal. calc. for C43H45N5O5: C, 72.55; H, 6.37; N, 9.84. Found: C, 72.66; H, 6.22; N, 10.02%. 1H NMR (400 MHz, DMSO-d6), δ (ppm): 11.75 (s, 1H, NH), 8.42 (s, 1H, aryl-H), 7.98–8.00 (d, 1H, aryl-H, J = 7.2 Hz), 7.64–7.74 (m, 3H, aryl-H), 7.19–7.21 (d, 1H, aryl-H, J = 2.0 Hz), 6.79–6.81 (dd, 1H, aryl-H, J = 7.2, 2.0 Hz), 6.58–6.59 (d, 1H, aryl-H, J = 7.2 Hz), 6.32 (s, 2H, aryl-H), 6.27–6.28 (d, 3H, 2aryl-H & CH), 5.23–5.26 (t, 2H, 2NH–CH2, J = 5.2 Hz), 3.50–3.55 (q, 4H, 2CH2, J = 7.2 Hz), 3.17–3.23 (m, 4H, 2CH2), 1.98 (s, 6H, 2CH3), 1.26–1.30 (t, 6H, 2CH3, J = 7.2 Hz), 1.17–1.20 (t, 6H, 2CH3, J = 6.8 Hz). ESI-MS: m/z = 712.3800 for [M + H]+, 356.6962 for [M + 2H]2+. Crystal data for RC1·1.5CH3CN (C46H49.5N6.5O5, Fig. 1): crystal size: 0.10 × 0.10 × 0.04 mm, triclinic, space group P![[1 with combining macron]](https://www.rsc.org/images/entities/char_0031_0304.gif) . a = 10.543(8) Å, b = 11.218(9) Å, c = 19.322(16) Å, α = 85.354(17)°, β = 74.292(15)°, γ = 78.481(16)°, V = 2155(3) Å3, Z = 2, T = 296(2) K, θ = 1.85–25.00°, 10
. a = 10.543(8) Å, b = 11.218(9) Å, c = 19.322(16) Å, α = 85.354(17)°, β = 74.292(15)°, γ = 78.481(16)°, V = 2155(3) Å3, Z = 2, T = 296(2) K, θ = 1.85–25.00°, 10![[thin space (1/6-em)]](https://www.rsc.org/images/entities/char_2009.gif) 993 reflections measured, 7551 unique (Rint = 0.0892). Final residual for 530 parameters and 7551 reflections with I > 2σ(I): R1 = 0.0731, wR2 = 0.1166 and GOF = 1.028.
993 reflections measured, 7551 unique (Rint = 0.0892). Final residual for 530 parameters and 7551 reflections with I > 2σ(I): R1 = 0.0731, wR2 = 0.1166 and GOF = 1.028.
 | ||
| Fig. 1 The crystal structure of RC1·1.5CH3CN, symmetry code: (i) 3 − x, 2 − y, −z. | ||
General UV-vis and fluorescence spectra measurements
The spectral analyses were accomplished at room temperature in CH3CN/H2O (9/1, v/v, pH = 7.4) solution for Cu2+ detection, while in CH3CN/H2O (9/1, v/v, pH = 10.0) solution in the case of Hg2+. The concentration of the probe RC1 for UV-vis and fluorescence measurement was 5 μM. Solutions of metal ions were prepared with nitrate or chloride salts in CH3CN. UV-vis and fluorescence spectrophotometric titration were conducted directly in 2 mL cuvette by successive addition of corresponding chemical reagent using a microliter syringe. Upon addition of every aliquot, the solution was well mixed then the spectrum was measured.Results and discussions
Detection of Cu2+ in CH3CN/H2O (9/1, v/v, pH = 7.4) solution using RC1
The selectivity of the RC1 probe for various metal cations was investigated. As shown in Fig. 2, the free RC1 sensor (5 μM) in CH3CN/H2O (9/1, v/v, pH = 7.4) solution features two absorption bands at 300 and 445 nm, which could be assigned to the π–π* transition of rhodamine in a spirocycle-closed form and to the coumarin moiety,27,51 respectively. Upon the addition of 5 equiv. Cu2+ to the RC1 solution, the mixture exhibited a significant absorbance at 520 nm corresponding to the orange colour. However, in the case of other metal cations, only trivalent metal ions (Al3+, Cr3+ and Fe3+) induced a slight absorbance enhancement at 520 nm (approximately 14% of Cu2+ in the case of Fe3+). Other cations, such as Ag+, Ca2+, Cd2+, Co2+, Hg2+, K+, Mg2+, Mn2+, Na+, Ni2+, Pb2+ and Zn2+ ions, exerted almost no influence on the absorption of RC1. This result indicated that under neutral conditions, RC1 is a visible colourimetric probe that is selective for Cu2+.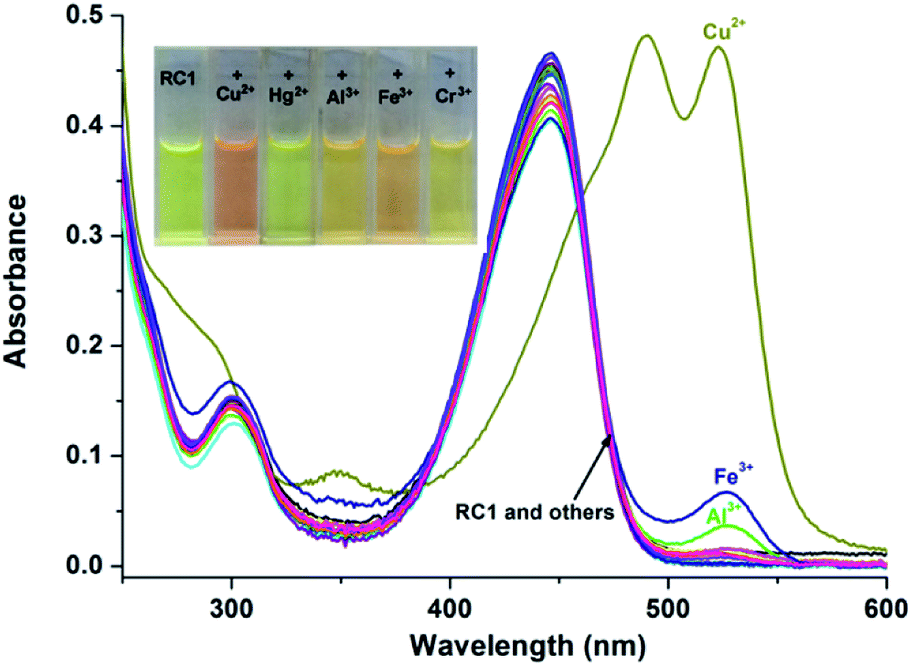 | ||
| Fig. 2 UV-vis spectra of 5 μM probe RC1 in CH3CN/H2O (9/1, v/v, pH = 7.4) solution with 5 equiv. of metal ions: Ag+, Al3+, Ca2+, Cd2+, Co2+, Cr3+, Cu2+, Fe3+, Hg2+, K+, Mg2+, Mn2+, Na+, Ni2+, Pb2+ and Zn2+ ions and blank. The inset shows the change of the color with the addition of Cu2+ to RC1 solution. | ||
Under excitation at 445 nm, the free RC1 probe displayed one fluorescence emission band at 498 nm (Fig. 3) because of the coumarin fluorophore.31,51 Upon the addition of 5 equiv. Cu2+, the emission band at 498 nm drastically decreased. By contrast, the other metal ions exerted no influence on the same emission band. In addition, Cu2+ caused a clear fluorescence enhancement of RC1 at 550 nm, corresponding to the yellow colour under a 365 nm UV lamp. The strong Lewis acidity of Al3+, Cr3+ and Fe3+ likely induced the hydrolytic cleavage of the imine bond, thus triggering the fluorescence emission of RC1 at 550 nm.55 The variety of fluorescence intensity ratio F550/F498, however, is highly selectively for Cu2+ (Fig. S1, ESI†). Therefore, RC1 is also a ratiometric fluorescent probe towards Cu2+.
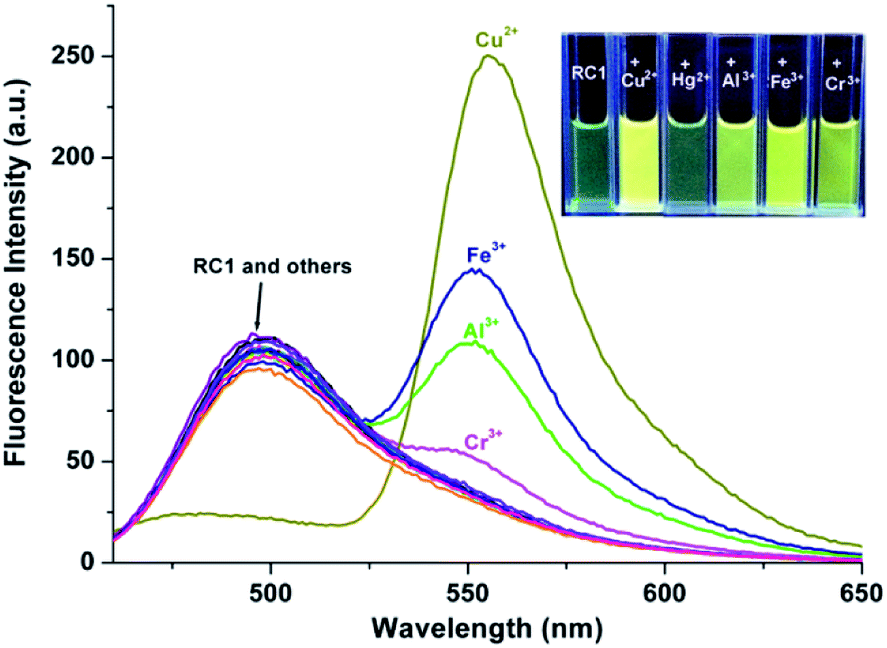 | ||
| Fig. 3 Fluorescence emission spectra of 5 μM probe RC1 in CH3CN/H2O (9/1, v/v, pH = 7.4) solution with 5 equiv. of metal ions: Ag+, Al3+, Ca2+, Cd2+, Co2+, Cr3+, Cu2+, Fe3+, Hg2+, K+, Mg2+, Mn2+, Na+, Ni2+, Pb2+ and Zn2+ ions and blank, excitation wavelength was 445 nm. The inset shows the change of the color with the addition of Cu2+ to RC1 under 365 nm UV lamp. | ||
To obtain further information on the binding form of the RC1 sensor with Cu2+, absorption and fluorescence spectrum titrations were performed. As shown in Fig. 4, the absorbance peak at 520 nm was significantly enhanced upon the gradual addition of up to 8 equiv. Cu2+ to 5 μM RC1 sensor in CH3CN/H2O (9/1, v/v, pH = 7.4) solution; this result indicated that the spirolactam ring opened due to Cu2+ addition.28 Moreover, upon the addition of Cu2+, the absorbance at 350 and 294 nm gradually increased, whereas that at 445 nm decreased. The three isosbestic points at 461, 385 and 335 nm suggested that RC1 may decompose into several components that exist in equilibrium.55 Furthermore, the absorbance at 520 nm (Fig. 4, inset) increased linearly over the Cu2+ concentration range of 0–30 μM.
 | ||
| Fig. 4 Absorption spectra of 5 μM probe RC1 upon the addition of Cu2+ (0–8 equiv.) in CH3CN/H2O (9/1, v/v, pH = 7.4) solution. The inset shows the linear response range of the absorbance at 520 nm as a function of Cu2+ concentration (0–30 μM). | ||
The FRET pathway was completely suppressed in the free probe RC1 probe, and only an emission maximum near 498 nm was observed when the probe was excited at 445 nm. The emission at 498 nm decreased upon the addition of <1 equiv. Cu2+. However, upon the addition of >1 equiv. Cu2+, the emission band with a λmax near 498 nm decreased and was accompanied by the generation of a new fluorescence band at 550 nm (Fig. 5). The linear response range of the fluorescence intensity ratios (F550/F498) covered a Cu2+ concentration range of 8–15 μM (Fig. 5, inset). Evidently, the binding of the receptor to Cu2+ induced the FRET process, which produced an intense rhodamine-based yellow emission, i.e., energy transfer from coumarin to xanthene resulted from ringopening, thus increasing the overlap integral between the coumarin and xanthene moieties (Fig. S2, ESI†).
 | ||
| Fig. 5 Fluorescence emission spectra of 5 μM probe RC1 upon the addition of Cu2+ (0–5 equiv.) in CH3CN/H2O (9/1, v/v, pH = 7.4) solution. The inset shows the linear response range of the fluorescence intensity ratio at 550 and 498 nm (F550/F498) as a function of Cu2+ concentration (8–15 μM). Excitation wavelength was 445 nm. | ||
Results of the titration experiment revealed that the fluorescence calibration values were normalised between the minimum and the maximum intensities. A linear regression curve was then fitted to the normalised data, and the point at which the regression curve crossed the ordinate axis was considered as the detection limit.24 Results showed that the detection limit of RC1 for Cu2+ is 6.88 μM (Fig. S3, ESI†), which is considerably lower than the standard value for Cu2+ (20 μM) in drinking water recommended by the U.S. EPA.47 This result indicated that the RC1 sensor has potential applications as a Cu2+ detector in live cell or water samples.
Detection of Hg2+ in CH3CN/H2O (9/1, v/v, pH = 10.0) solution using RC1
Highly selective probes for Hg2+, which exhibit positive responses instead of fluorescent quenching upon analyte binding, are preferred to promote sensitivity.34 In CH3CN/H2O (9/1, v/v, pH = 10.0) solution, RC1 displayed high selectivity towards Hg2+ due to emission enhancement. The other tested ions exhibited no significant fluorescence changes (Fig. 6). Upon the addition of approximately 17 equiv. Hg2+ to 5 μM RC1·CH3CN/H2O (9/1, v/v, pH = 10.0) solution, the emission band centered at 498 nm (with an excitation wavelength at 445 nm) developed and slightly blue shifted to 490 nm (Fig. 7). Fluorescence intensity increased linearly in the Hg2+ concentration range of 0–20 μM (Fig. 7, inset) and the detection limit of RC1 for Hg2+ was 2.96 μM (Fig. S4, ESI†). Moreover, Job's plot experiment, which was evaluated from the absorption spectra, suggested that the binding of RC1 to Hg2+ is of 1:1 stoichiometry. The emission intensity was at its peak when the molecular fraction of Hg2+ was close to 0.5 (Fig. S5, ESI†). Fitting data to the Benesi–Hildebrand expression showed that the binding constant of RC1 with Hg2+ was 3.34 × 10⁴ M−1 with a good linear relationship (R = 0.99768, Fig. S6 and ESI†).
 | ||
| Fig. 6 Fluorescence emission spectra of 5 μM probe RC1 in CH3CN/H2O (9/1, v/v, pH = 10.0) solution with 5 equiv. of metal ions: Ag+, Al3+, Ca2+, Cd2+, Co2+, Cr3+, Cu2+, Fe3+, Hg2+, K+, Mg2+, Mn2+, Na+, Ni2+, Pb2+ and Zn2+ ions and blank, excitation wavelength was 445 nm. The inset shows the change of the color with the addition of Hg2+ to RC1 under 365 nm UV lamp. | ||
 | ||
| Fig. 7 Fluorescence emission spectra of 5 μM probe RC1 upon the addition of Hg2+ (0–17 equiv.) in CH3CN/H2O (9/1, v/v, pH = 10.0) solution. The inset shows the linear response range of the fluorescence intensity at 498 nm as a function of Hg2+ concentration (0–20 μM). Excitation wavelength was 445 nm. | ||
Reaction mechanism of RC1 with Cu2+ and Hg2+
To explore the reaction mechanism of RC1 with Cu2+ or Hg2+, ESI-MS analysis (Fig. S7 and S8, ESI†) was performed. Results showed that upon the addition of Cu2+ to an acetonitrile solution of RC1, peaks were observed at m/z 429.2259 and 415.2105, which were assigned to rhodamine 6G hydrazide and rhodamine 6G acid, respectively. This result indicated that Cu2+ facilitates the hydrolysis of RC1, which results in the colour change and visible fluorescence emission at 550 nm (Scheme 2). The hydrolysis mechanism has been demonstrated by Czarnik et al.2 The fluorescence emission of the coumarin moiety at 498 nm was quenched by excess Cu2+ ions but negligibly changed in the presence of Al3+, Cr3+ and Fe3+, although these three ions could also catalyse the RC1 hydrolysis. This result is in agreement with that in literature.51,52 However, the peaks of Hg2+ at m/z 948.2655 were attributed to the [RC1 + Hg + Cl]+ complex. The differences in the 1H NMR spectra of RC1 and RC1 + Hg2+ are also depicted in Fig. S9, ESI.† Upon the addition of Hg2+, the proton peaks at 8.423, 6.583–6.590 and 6.785–6.814 ppm, which are attributable to the coumarin moieties in RC1, shifted to the high field, whereas the peak at 6.320 ppm that belongs to rhodamine shifted to low field. Therefore, RC1 could chelate Hg2+ through the O atom of coumarin 3-acyl group, thereby forming a 1:1 complex (Scheme 2). In addition, the slight shifts showed that the Hg–O coordination bond is relatively weak. It should be noted that there exists strong intramolecular N–H⋯O hydrogen bond between the N atom of rhodamine hydrazone and O atom of 3-carbonyl of coumarin (N⋯O distance being 2.627(5) Å), which will restrict the coordination of Hg2+ ions under neutral condition. On the contrary, according to the literature, the carbonyl of rhodamine hydrazone of RC1 is prefer to participate the coordination with Cu2+ ions,58 thus leading to the hydrolysis process.
 | ||
| Scheme 2 The proposed reaction mechanism of RC1 with Cu2+ and Hg2+. | ||
To understand the configuration of RC1 and the [RC1 + Hg + Cl]+ complex, we performed density functional theory (DFT) calculations.56 As shown in Fig. 8, the structure of RC1 clearly exhibits the distinct spirolactam ring formation of the rhodamine moiety with only coumarin fluorescence emission. In the [RC1 + Hg + Cl]+ structure, Hg2+ coordinated with the O atom of the coumarin 3-acyl group and one chloride anion, and the Hg–O and Hg–Cl bond lengths were 2.169 and 2.386 Å, respectively. The coordination of the acyl O atom in the 3-position increased its electron withdrawing effect; consequently, the fluorescence intensity of coumarin (accompanied by a slight blue shift) considerably increased through the enhanced ICT process.50
 | ||
| Fig. 8 Optimized structures and HOMO/LUMO of RC1 and RC1–Hg2+ complex by DFT calculation. | ||
The spatial distributions and orbital energies of the HOMO and LUMO of RC1 and the [RC1 + Hg + Cl]+ complex were also generated (Fig. 8). The HOMO and LUMO of the RC1–Hg2+ complex were more stable than those of RC1. HOMO and LUMO were both centered on the coumarin moiety in RC1. In the case of the RC1–Hg2+ complex, HOMO localised on half of the xanthene backbone. By contrast, the π electrons in the LUMO of the RC1–Hg2+ complex were located around the Hg2+ centre. The calculated energy gap between the HOMO and LUMO of the RC1–Hg2+ complex was 1.34 eV, which is significantly lower than that of RC1 (3.46 eV). This result revealed that the binding of Hg2+ to the probe stabilizes the system.
Effect of environmental factors and kinetic assay
The pH value is the primary factor that affects the response of the rhodamine-based chemosensor.28 The spectrum response of RC1 (5 μM) with or without Cu2+/Hg2+ (5 equiv. of each) in CH3CN/H2O (9/1, v/v) solutions with different pH values was evaluated at room temperature. Results showed that RC1 detected Cu2+ and Hg2+ ions under relatively acidic (pH 4.0–7.6, Fig. S10, ESI†) and basic (pH 10.0–11.0, Fig. S11, ESI†) conditions, respectively. The interference of the coexistent metal cations was also studied. Results showed that except for Al3+, Cr3+ and Fe3+, the coexistent metal cations, including Ag+, Ca2+, Cd2+, Co2+, Hg2+, K+, Mg2+, Mn2+, Na+, Ni2+, Pb2+ and Zn2+ ions, hardly affected the detection of Cu2+ (Fig. S12, ESI†). By contrast, the coexistent metal cations exerted no influences on Hg2+ detection (Fig. S13, ESI†).The chemosensor property of short response time is as important as high sensitivity and selectivity.37 To monitor the target metal ions in real time, the time courses of response to fluorescence changes in RC1 (5 μM) with 5 equiv. of Cu2+ or Hg2+ were investigated. As shown in Fig. S14 in ESI,† the fluorescence ratio (F550/F498) immediately increased in Cu2+ and stabilised within 1 min, which is a significantly shorter analysis time for Cu2+ detection than with the rhodamine B hydroxylamide probe (response time, 2 h).29 By contrast, the fluorescence intensity of RC1 + Hg2+ stabilised after 2 min (Fig. S15 and ESI†), which indicated faster detection than with the glyoxylic acid rhodamine B hydrazone probe (response time, 1 h).57
Reversibility is an important aspect in the wide application of a chemical sensor for Cu2+ or Hg2+ detection in specific environments. Thus, we carried out reversibility experiments. As shown in Fig. S16 and ESI,† EDTA chelation with Cu2+ recovered coumarin fluorescence but did not influence the rhodamine emission of RC1 + Cu2+ at 550 nm. This result provided further evidence for the hydrolysis process of RC1 with Cu2+. By contrast, when 5 equiv. Na2EDTA was added to 5 μM RC1 probe in CH3CN/H2O (9/1, v/v, pH = 10.0) solution with 5 equiv. Hg2+, the fluorescence of the system was quenched. The consecutive additions of Hg2+ and Na2EDTA revealed that this on/off cycle could be repeated (Fig. S17 and ESI†). This observation confirmed that the Hg2+ and Na2EDTA recognition processes are reversible and supported the coordination reaction of RC1 with Hg2+.
Fluorescence imaging of intercellular Cu2+
The ability of the fluorescence chemosensor RC1 to detect Cu2+ in Hela cells was examined. The cells were supplemented with RC1 (10 μM) in Dulbecco's modified Eagle's medium (DMEM) supplemented with 10% fetal bovine serum for 0.5 h at 37 °C, leading to intense fluorescence in the blue channel (Fig. 9a) and weak fluorescence in the green channel (Fig. 9b). However, treatment of Cu2+ (20 μM) with RC1-loaded cells elicited a partial fluorescence decrease in the blue channel (Fig. 9e) and strong fluorescence in the green channel (Fig. 9f). The results suggest that sensor RC1 can be used to image intracellular Cu2+ in living cells. | ||
| Fig. 9 Bright field and fluorescence images of Hela cells stained with the probe RC1. Only the probe RC1: (a) fluorescence image from the blue channel; (b) fluorescence image from the green channel; (c) bright field image; (d) an overlay of the fluorescent blue and green channels and bright-field images. In the presence of Cu2+: (e) fluorescence image from the blue channel; (f) fluorescence image from the green channel; (g) bright field image; (h) an overlay of the fluorescent blue and green channels and bright-field images. | ||
Practical applications
To verify the practical applicability of the sensors, the standard addition method was utilized to detect Cu2+ or Hg2+ in distilled water (Kangshifu brand drinking water obtained from the local supermarket) and natural water (obtained from XinYue Lake of Henan Polytechnic University).33 Briefly, 0.2 mL Cu2+- or Hg2+-spiked water sample was mixed with 1.8 mL CH3CN. The pH value was adjusted to 7.4 and 10.0 for the detection of Cu2+ and Hg2+, respectively. Subsequently, 10 μL of 1 mM probe-CH3CN solution was added, and the fluorescence spectra were recorded. Cu2+ and Hg2+ concentrations were calculated using the equation shown in Fig. 4 (inset) and 6 (inset), respectively. The obtained recovery was 91.4–98.8%, which indicated the appreciable practicality of the presented sensor (Table 1).| Analyte | Sample | Spiked (μM) | Founda (μM) | Recovery (%) |
|---|---|---|---|---|
| a Average value of three determinations.b Kangshifu Drinking water (obtained from the local supermarket): [K+] = 25.64–700 μM; [Mg2+] = 4.17–203.12 μM; [Cl−] = 281.69–769 μM; [SO42−] = 4.17–71 μM.c Obtained from XinYue Lake of Henan Polytechnic University. | ||||
| Cu2+ | Distilled water | 0 | 0 | — |
| 10 | 9.68 ± 0.15 | 96.8 | ||
| 15 | 14.44 ± 0.08 | 94.1 | ||
| Drinking waterb | 0 | 0 | — | |
| 10 | 9.52 ± 0.15 | 95.2 | ||
| 15 | 14.39 ± 0.12 | 95.9 | ||
| Natural waterc | 0 | 0 | — | |
| 10 | 9.48 ± 0.35 | 94.8 | ||
| 15 | 13.98 ± 0.17 | 93.2 | ||
| Hg2+ | Distilled water | 0 | 0 | — |
| 5 | 4.86 ± 0.04 | 97.2 | ||
| 10 | 9.88 ± 0.06 | 98.8 | ||
| Drinking water | 0 | 0 | — | |
| 5 | 4.77 ± 0.05 | 95.4 | ||
| 10 | 9.66 ± 0.08 | 96.6 | ||
| Natural water | 0 | 0 | — | |
| 5 | 4.58 ± 0.06 | 91.6 | ||
| 10 | 9.52 ± 0.05 | 95.2 | ||
Conclusion
We developed an effective fluorescent ratiometric probe for Cu2+-containing rhodamine and coumarin dyes under neutral condition. The probe could sense Hg2+ with fluorescence enhancement at high pH value. Furthermore, the detection of Cu2+ and Hg2+ ions in actual water samples was demonstrated.Conflicts of interest
There are no conflicts to declare.Acknowledgements
This work was supported in part by the National Natural Science Foundation of China (No. 21001040, No. 21404033, No. 21401046), the Joint Program for Fostering Talents of National Natural Science Foundation of China and Henan Province (No. U1304202 and U1604124), the Education Department of Henan Province (No. 15B150016, 2014GGJS-045, 15HASTIT002 and 16A150010), the Science and Technology Department of Henan Province (No. 152102210343 and 162300410011).Notes and references
- S. Angupillai, J.-Y. Hwang, J.-Y. Lee, B. A. Rao and Y.-A. Son, Sens. Actuators, B, 2015, 214, 101 CrossRef CAS.
- V. Dujols, F. Ford and A. W. Czarnik, J. Am. Chem. Soc., 1997, 119, 7386 CrossRef CAS.
- O. García-Beltrán, N. Mena, L. C. Friedrich, J. C. Netto-Ferreira, V. Vargas, F. H. Quina, M. T. Núñez and B. K. Cassels, Tetrahedron Lett., 2012, 53, 5280 CrossRef.
- C. Liu, X. Jiao, S. He, L. Zhao and X. Zeng, Org. Biomol. Chem., 2017, 15, 3947 CAS.
- D. Maity and T. Govindaraju, Chem.–Eur. J., 2011, 17, 1410 CrossRef CAS PubMed.
- K. Huang, Y. Yue, X. Jiao, C. Liu, Q. Wang, S. He, L. Zhao and X. Zeng, Dyes Pigm., 2017, 143, 379 CrossRef CAS.
- T. S. Seeger, F. C. Rosa, C. A. Bizzi, V. L. Dressler, E. M. M. Flores and F. A. Duarte, Spectrochim. Acta, Part B, 2015, 105, 136 CrossRef CAS.
- Y. Liu, P. Liang and L. Guo, Talanta, 2005, 68, 25 CrossRef CAS PubMed.
- A. A. Ensafi, T. Khayamian, A. Benvidi and E. Mirmomtaz, Anal. Chim. Acta, 2006, 561, 225 CrossRef CAS.
- J. Wang, D. Larson, N. Foster, S. Armalis, J. Lu, R. Xu, K. Olsen and A. Zirino, Anal. Chem., 1995, 37, 1481 CrossRef.
- X. Chen, T. Pradhan, F. Wang, J. S. Kim and J. Yoon, Chem. Rev., 2012, 112, 1910 CrossRef CAS PubMed.
- Y. Yang, Q. Zhao, W. Feng and F. Li, Chem. Rev., 2013, 113, 192 CrossRef CAS PubMed.
- M. H. Lee, J. S. Kim and J. L. Sessler, Chem. Soc. Rev., 2015, 44, 4185 RSC.
- H. Zhu, J. Fan, B. Wang and X. Peng, Chem. Soc. Rev., 2015, 44, 4337 RSC.
- X. Zhang, Y. Shiraishi and T. Hirai, Org. Lett., 2007, 9, 5039 CrossRef CAS PubMed.
- M. Yu, M. Shi, Z. Chen, F. Li, X. Li, Y. Gao, J. Xu, H. Yang, Z. Zhou, T. Yi and C. Huang, Chem.–Eur. J., 2008, 14, 6892 CrossRef CAS PubMed.
- L. Huang, F.-P. Hou, P. Xi, D. Bai, M. Xu, Z. Li, G. Xie, Y. Shi, H. Liu and Z. Zeng, J. Inorg. Biochem., 2011, 105, 800 CrossRef CAS PubMed.
- L. Tang, F. Li, M. Liu and R. Nandhakumar, Spectrochim. Acta, Part A, 2011, 78, 1168 CrossRef PubMed.
- L. Huang, F. Chen, P. Xi, G. Xie, Z. Li, Y. Shi, M. Xu, H. Liu, Z. Ma, D. Bai and Z. Zeng, Dyes Pigm., 2011, 90, 265 CrossRef CAS.
- M.-Z. Tian, M.-M. Hu, J.-L. Fan, X.-J. Peng, J.-Y. Wang, S.-G. Sun and R. Zhang, Bioorg. Med. Chem. Lett., 2013, 23, 2916 CrossRef CAS PubMed.
- F. Ge, H. Ye, J.-Z. Luo, S. Wang, Y.-J. Sun, B.-X. Zhao and J.-Y. Miao, Sens. Actuators, B, 2013, 181, 215 CrossRef CAS.
- M. Li, H.-S. Lv, J.-Z. Luo, J.-Y. Miao and B.-X. Zhao, Sens. Actuators, B, 2013, 188, 1235 CrossRef CAS.
- M. Yu, R. Yuan, C. Shi, W. Zhou, L. Wei and Z. Li, Dyes Pigm., 2013, 99, 887 CrossRef CAS.
- S. Goswami, D. Sen, A. K. Das, N. K. Das, K. Aich, H.-K. Fun, C. K. Quah, A. K. Maity and P. Saha, Sens. Actuators, B, 2013, 183, 518 CrossRef CAS.
- H. Kim, B. A. Rao, J. W. Jeong, S. Mallick, S.-M. Kang, J. S. Choi, C.-S. Lee and Y.-A. Son, Sens. Actuators, B, 2015, 210, 173 CrossRef CAS.
- E. Wang, Y. Zhou, Q. Huang, L. Pang, H. Qiao, F. Yu, B. Gao, J. Zhang, Y. Min and T. Ma, Spectrochim. Acta, Part A, 2016, 152, 327 CrossRef CAS PubMed.
- Y. Wang, H.-Q. Chang, W.-N. Wu, W.-B. Peng, Y.-F. Yan, C.-M. He, T.-T. Chen, X.-L. Zhao and Z.-Q. Xu, Sens. Actuators, B, 2016, 228, 395 CrossRef CAS.
- P. Xi, J. Dou, L. Huang, M. Xu, F. Chen, Y. Wu, D. Bai, W. Li and Z. Zeng, Sens. Actuators, B, 2010, 148, 337 CrossRef CAS.
- X. Chen, J. Jia, H. Ma, S. Wang and X. Wang, Anal. Chim. Acta, 2009, 632, 9 CrossRef CAS PubMed.
- M. Kumar, N. Kumar, V. Bhalla, P. R. Sharma and T. Kaur, Org. Lett., 2012, 14, 406 CrossRef CAS PubMed.
- L. Yuan, W. Lin, B. Chen and Y. Xie, Org. Lett., 2012, 14, 432 CrossRef CAS PubMed.
- J. Tang, S. Ma, D. Zhang, Y. Liu, Y. Zhao and Y. Ye, Sens. Actuators, B, 2016, 236, 109 CrossRef CAS.
- L. Yuan, W. Lin, K. Zheng and S. Zhu, Acc. Chem. Res., 2013, 46, 1462 CrossRef CAS PubMed.
- G. He, X. Zhang, C. He, X. Zhao and C. Duan, Tetrahedron, 2010, 66, 9762 CrossRef CAS.
- B. Muthuraj, R. Deshmukh, V. Trivedi and P. K. Iyer, ACS Appl. Mater. Interfaces, 2014, 6, 6562 CAS.
- C. Kar, M. D. Adhikari, A. Ramesh and G. Das, Inorg. Chem., 2013, 52, 743 CrossRef CAS PubMed.
- Z.-H. Xu, H.-W. Wang, X.-F. Hou, W.-L. Xu, T.-C. Xiang and C.-Z. Wu, Sens. Actuators, B, 2014, 201, 469 CrossRef CAS.
- Y. Zhou, F. Wang, Y. Kim, S.-J. Kim and J. Yoon, Org. Lett., 2009, 11, 4442 CrossRef CAS PubMed.
- L. Wang, J. Yan, W. Qin, W. Liu and R. Wang, Dyes Pigm., 2012, 92, 1083 CrossRef CAS.
- L. Liu, A. Wang, G. Wang, J. Li and Y. Zhou, Sens. Actuators, B, 2015, 215, 388 CrossRef CAS.
- V. K. Gupta, N. Mergu and L. K. Kumawat, Sens. Actuators, B, 2016, 223, 101 CrossRef CAS.
- Y.-K. Yang, K.-J. Yook and J. Tae, J. Am. Chem. Soc., 2005, 127, 16760 CrossRef CAS PubMed.
- M. Wang, J. Wen, Z. Qin and H. Wang, Dyes Pigm., 2015, 120, 208 CrossRef CAS.
- J. Ni, B. Li, L. Zhang, H. Zhao and H. Jiang, Sens. Actuators, B, 2015, 215, 174 CrossRef CAS.
- Q. Zhou, Z. Wu, X. Huang, F. Zhong and Q. Cai, Analyst, 2015, 140, 6720 RSC.
- G. Li, G. Gao, J. Cheng, X. Chen, Y. Zhao and Y. Ye, Luminescence, 2016, 31, 992 CrossRef CAS PubMed.
- X. Zeng, L. Dong, C. Wu, L. Mu, S.-F. Xue and Z. Tao, Sens. Actuators, B, 2009, 141, 506 CrossRef CAS.
- N. I. Georgiev, M. D. Dimitrova, A. M. Asiri, K. A. Alamry and V. B. Bojinov, Dyes Pigm., 2015, 115, 172 CrossRef CAS.
- S. Guha, S. Lohar, I. Hauli, S. K. Mukhopadhyay and D. Das, Talanta, 2011, 85, 1658 CrossRef CAS PubMed.
- Y. Jiao, L. Zhou, H. He, J. Yin and C. Duan, Talanta, 2017, 162, 403 CrossRef CAS PubMed.
- W.-J. Xu, D.-Q. Qi, J.-Z. You, F.-F. Hu, J.-Y. Bian, C.-X. Yang and J. Huang, J. Mol. Struct., 2015, 1091, 133 CrossRef CAS.
- H.-Q. Chang, X.-L. Zhao, W.-N. Wu, L. Jia and Y. Wang, J. Lumin., 2017, 182, 268 CrossRef CAS.
- G. M. Sheldrick, SADABS, University of Göttingen, Germany, 1996 Search PubMed.
- G. M. Sheldrick, SHELX-97, Program for the Solution and the Refinement of Crystal Structures, University of Göttingen, Germany, 1997 Search PubMed.
- W. N. Wu, P. D. Mao, L. Jia, Y. Wang and Z. Q. Xu, Spectrochim. Acta, Part A, 2016, 166, 44 CrossRef CAS PubMed.
- M. J. Frisch, G. W. Trucks, H. B. Schlegel, G. E. Scuseria, M. A. Robb and J. R. Cheeseman, Gaussian 09, Revision D.01, Gaussian, Inc., Wallingford CT, 2013 Search PubMed.
- X. Zhang and Y.-Y. Zhu, Sens. Actuators, B, 2014, 202, 609 CrossRef CAS.
- L.-F. Zhang, J.-L. Zhao, X. Zeng, L. Mu, X.-K. Jiang, M. Deng, J.-X. Zhang and G. Wei, Sens. Actuators, B, 2011, 160, 662 CrossRef CAS.
Footnote |
| † Electronic supplementary information (ESI) available: 1H NMR ESI-MS spectrum and other additional figures for the probe. CCDC 1509525. For ESI and crystallographic data in CIF or other electronic format see DOI: 10.1039/c7ra05424f |
| This journal is © The Royal Society of Chemistry 2017 |