DOI:
10.1039/C7RA05346K
(Review Article)
RSC Adv., 2017,
7, 31189-31203
Recent advances in surface plasmon-driven catalytic reactions
Received
11th May 2017
, Accepted 9th June 2017
First published on 16th June 2017
Abstract
Surface plasmons, the free electrons' collective oscillations, have been used in the signal detection and analysis of target molecules, where the local surface plasmon resonance (LSPR) can produce a huge EM field, thus enhancing the SERS signal. However, another novel application of surface plasmons has been discovered in the photocatalysis field. In this review we will mainly discuss the occurrence of the oxidation reaction of amino group molecules and the reduction reaction of nitro group molecules with the assistance of hot electrons from noble metal surface plasmon decay. Meanwhile, these catalytic reactions can be probed by SERS and TERS technology in different conditions. The results show that hot electrons play a significant role in the field of surface plasmon-driven catalytic reactions. Subsequently, we further discuss the priority selectivity of plasmon-driven surface catalytic redox reactions. We discover that the reduction reaction of the nitro group is prior to the oxidation reaction of the amino group in the atmosphere and in an aqueous environment. Finally, we believe that plasmon-driven catalytic reactions can be applied on a large scale in medicine and electronics in the future.
 Xin Ren | Xin Ren was born in Heilongjiang, China. He received his Master degree in optical physics from the Capital Normal University in 2015 and is now a PhD candidate. His current research is concentrated on piezoelectric optoelectronics and the in situ SERS study of plasmon-driven catalytic reactions. |
 En Cao | En Cao is a PhD candidate at School of Physics and Electronics, Shandong Normal University (SDNU). His current research interests focus on tip-enhanced Raman spectroscopy, surface-enhanced Raman spectroscopy (SERS) and plasmon-driven chemical reactions. |
 Weihua Lin | Weihua Lin is a PhD candidate at Beijing Key Laboratory for Magneto-Photoelectrical Composite and Interface Science, School of Mathematics and Physics, The University of Science and Technology Beijing. Her current research interests focus on tip-enhanced Raman spectroscopy (TERS), electrochemical SERS, super-capacitors, and plasmon-driven chemical reactions. |
 Yuzhi Song | Yuzhi Song is an Associate Professor at School of Physics and Electronics, Shandong Normal University (SDNU). He received his BS degree in 2004 and MSc degree in 2006 from SDNU. He obtained his PhD degree in 2011 from Department of Chemistry, University of Coimbra (UC) in Portugal. He worked as a postdoc at UC from 2011 to 2012. His current research interests include molecule reaction dynamics, surface enhanced Raman spectroscopy and plasmon-driven chemical reactions. |
 Jingang Wang | Jingang Wang is a PhD candidate at the Department of Chemistry and Physics, Liaoning University, China. His current research interests are the properties and applications of two-dimensional (2D) materials and plasmon-driven chemical reactions. |
1. Introduction
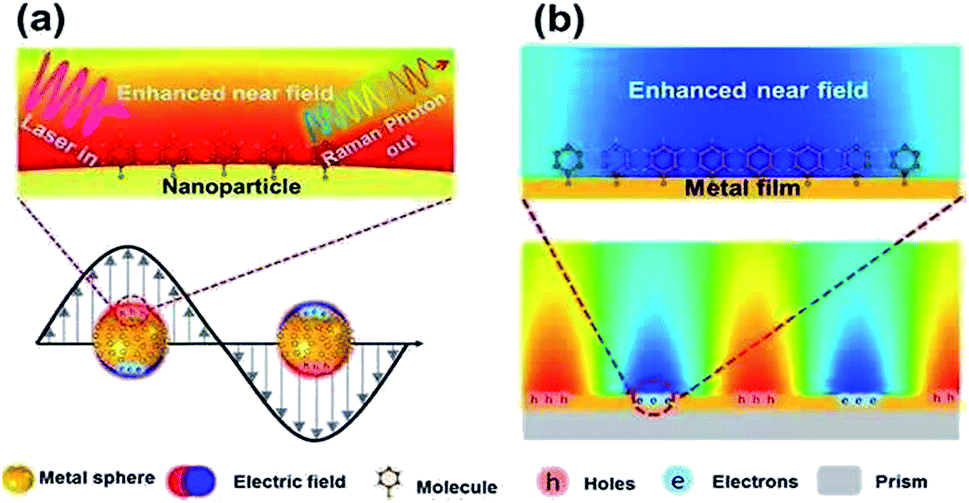
Surface plasmons (SPs) can be described as the collective oscillation of free electrons, produced near the interface between a metal and a dielectric.1–3 The phenomenon dubbed surface plasmon polarization (SPP) can be observed along the interface when a certain frequency of photons matches the inherent frequency of the electrons.4,5 The SPP can generate an enhanced electromagnetic field evanescing in the form of radiation or absorption. Generally, SPP can mainly be found in two forms: localized surface plasmons and propagating surface plasmons (see Fig. 1), which are widely used to investigate surface-enhanced Raman scattering (SERS) on noble metal nanostructures.6 However, limited time and shortcomings in spatial resolution impede their extensive application in the field of nanotechnology. Luckily, tip-enhanced Raman scattering (TERS)7 can overcome the above-mentioned shortcomings because of the enhanced electromagnetic field at the controlled gap, and has drawn more and more attention for detection and analysis.8
 |
| | Fig. 1 Sketches of local (a) and propagating (b) surface plasmons generated from different noble mental nanostructures.5 | |
Catalysts, as assistance agents, play a significant role in chemical reactions. However, reported catalysts are mono-functional and inefficient as the chemical reaction process occurs. Hence, it is urgently needed to discover bi-functional and efficient catalysts for investigating surface catalytic reactions. Surface plasmons serve as a desirable alternative candidate because of an obviously prominent property, that they can provide more electrons to accelerate the rate of chemical reactions. Recently, a surface plasmon-driven redox process, without any other additional catalysts, has drawn tremendous attention in the field of photocatalysis.9–22 Plasmons serving as a stable and efficient “catalyst” can induce the occurrence of an oxidation–reduction reaction by “hot electrons” which come from the surface plasmon radioactive decay.15–17 These hot electrons are transferred to the excited state of molecules absorbed on the surface of noble metal nanostructures to provide the activation energy to prompt the chemical reaction. Simultaneously, the monitoring of a surface plasmon-driven redox reaction can be achieved by taking advantage of SERS or TERS technology.23,24 Extensive experimental results and theoretical analysis have been conducted on the surface catalytic reaction of PATP (p-aminothiophenol), 4-nitrobenzenethiol (4-NBT) and other candidate molecules (see Fig. 2) by SPs generated on the noble metal nanostructure interface. It has been experimentally and theoretically verified that the PATP molecule or 4-NBT molecule can be converted to p,p′-dimercaptoazobenzene (DMAB) by surface plasmons, which corresponds to the oxidation reaction of amino groups and the reduction reaction of nitro groups. Moreover, other chemical processes, such as water decomposition and hydrogen dissociation, have been widely investigated by SERS.25,26
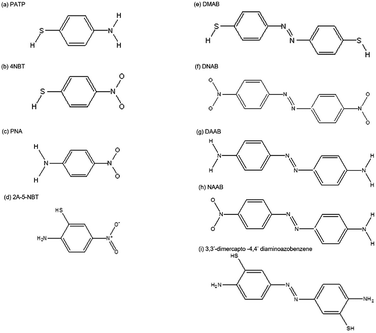 |
| | Fig. 2 Molecular structures. (a) PATP, (b) 4-NBT, (c) PNA, (d) 2A-5-NBT, (e) DMAB, (f) DNAB, (g) DAAB, (h) NAAB and (i) 3,3′-dimercapto-4,4′-diaminoazobenzene. | |
In this review, we will report the surface plasmon-driven catalytic reactions of molecules containing amino or nitro groups in the atmosphere, in aqueous solution and in a high vacuum, as probed by SERS and TERS technology.
2. Surface plasmon-driven catalytic oxidation reactions
2.1 Surface plasmon-driven catalytic oxidation reactions by SERS in an atmospheric environment
SERS, as a noninvasive technique, has been used qualitatively and quantitatively to investigate the fingerprint vibrational information of target molecules. Electromagnetic enhancement and chemical enhancement have been widely accepted mechanisms in SERS, so far. In general, every Raman peak of a molecule is enhanced by local surface plasmon resonance, which is analyzed by an electromagnetic enhancement mechanism. But partial Raman peaks of molecules are selectively enhanced due to their change in electron structure, which is elucidated by the chemical enhancement mechanism.28
PATP serving as a probe molecule has attracted much attention because of its strong interaction with the noble metal nanostructure, sensitive optical signal, and potential applications in electronics circuitries.29–32 SERS spectra of PATP were first reported by Osawa et al. on a rough silver electrode. Several additional lines were discovered during the SERS detection of PATP and interpreted by a chemical enhancement mechanism in SERS.33 These additional peaks were firstly assigned to the b2 symmetry mode. Subsequently, Wu and coworkers forecast theoretically that these additional peaks come from a new product, namely DMAB. This is produced from dimerization of PATP absorbed on silver nanoparticles.34 But some researchers still persist in repeating the statement of Osawa. In 2010, Tian et al. discovered experimentally and theoretically that PATP adsorbed on a rough Ag electrode can be coupled to DMAB without the assistance of any additional catalysts during the SERS detection of PATP (see Fig. 3).27 Hence, the development of a version of SERS as a noninvasive technique has become a great challenge in the field of analytical chemistry. At the same time, Sun et al. independently reported time-dependent SERS spectra of PATP converted to DMAB by local SPs.28 The surface-catalyzed reaction assisted by surface plasmons, dubbed a surface plasmon-driven catalysis reaction, can be probed by in situ SERS in the atmosphere. Compared with normal Raman spectra, three additional Raman peaks appear in the SERS spectra of PATP absorbed on Ag particles, which center on 1143 cm−1, 1390 cm−1, and 1432 cm−1. They are attributed to symmetric vibrational modes: ag12, ag16, ag17 rather than asymmetric vibrational modes: bu from ref. 28. In other words, the new peaks are assigned to the β (C–H) bond and γ (N![[double bond, length as m-dash]](https://www.rsc.org/images/entities/char_e001.gif) N) bond after two PATP molecules have been dimerized to DMAB.34,35 So we cannot elucidate the three new peaks by a charge-transfer chemical enhancement mechanism. This result offers a novel avenue for preparing oligomer probe molecules and for investigating a surface catalytic reaction. The discovery of the surface plasmon-driven catalytic reaction of PATP to DMAB by local SPs has had an important effect on the field of analytic chemistry and catalytic chemistry.
N) bond after two PATP molecules have been dimerized to DMAB.34,35 So we cannot elucidate the three new peaks by a charge-transfer chemical enhancement mechanism. This result offers a novel avenue for preparing oligomer probe molecules and for investigating a surface catalytic reaction. The discovery of the surface plasmon-driven catalytic reaction of PATP to DMAB by local SPs has had an important effect on the field of analytic chemistry and catalytic chemistry.
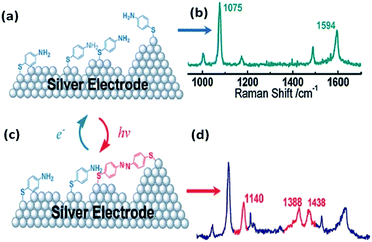 |
| | Fig. 3 Schematic illustration of the dimerization process of PATP (a and b) adsorbed on silver electrode to DMAB (c and d).27 | |
Later, Xu et al. investigated the plasmon-driven reversible process of PATP to DMAB by SPs generated from a single Ag microsphere.36 In this report, the flow rate of the gas was controlled by a self-designed gas flow cell.21 As Fig. 4(a) shows, the reversible reaction of PATP to DMAB is monitored by the C–H band and NN band appearing or disappearing in the SERS spectra. The corresponding schematic of PATP to DMAB is also illustrated in Fig. 4(b), where O2 is regarded as an electron acceptor in the oxidation process and H2 is considered as a proton donor in the reduction process. The specific reduction reactions of molecules with amino groups will be discussed later.
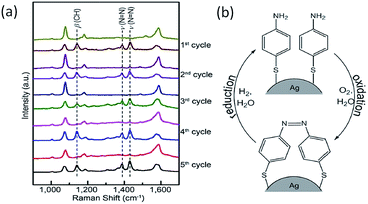 |
| | Fig. 4 SERS spectra (a) and schematic illustration (b) of the reversible reactions of PATP to DMAB.36 | |
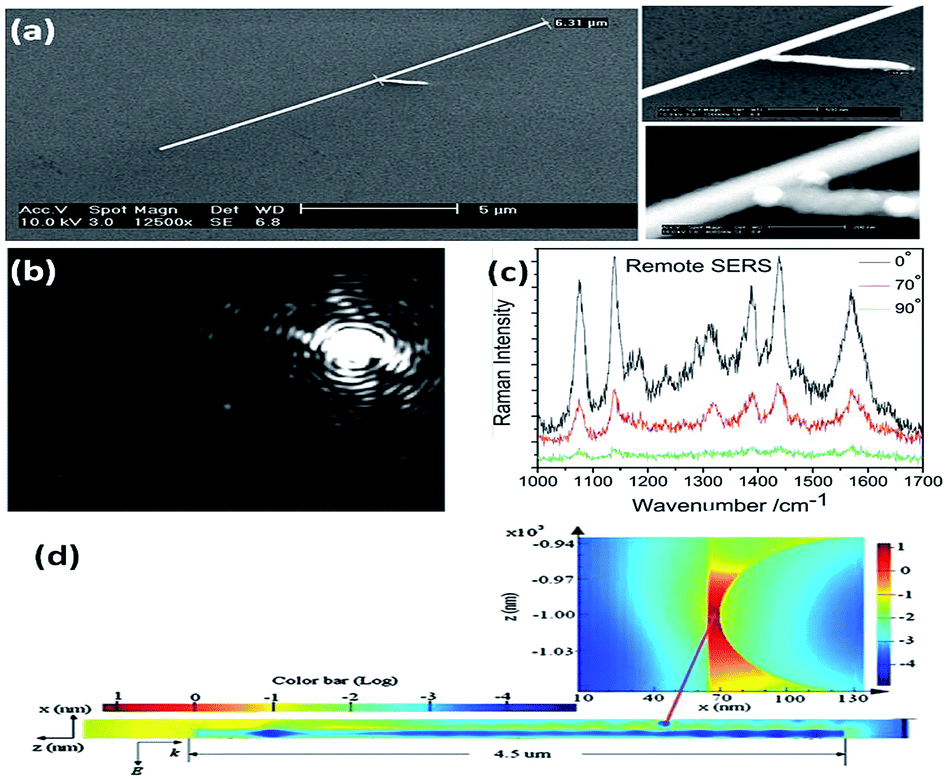
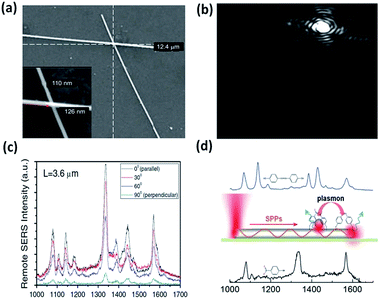
The aforementioned SERS experiments cannot be made selectively in cell detection, because the incident light directly illuminates the sample and the emitted signals are collected from all the spots. In addition, a higher intensity laser might damage the cell or chemically modify the targeted molecules.37 To get rid of the influence of laser intensity on living cells, remote polarization-dependent excitation is applied in plasmon-driven surface catalytic reactions. A plasmon waveguide is firstly induced at one end of a nanowire, which then propagates along its surface, and is finally coupled to promote the catalytic reaction at the other end. Sun et al. discovered that PATP can be converted to DMAB by assisted-surface plasmon-driven polaritons at the remote end of a nanowire.28 Raman spectra of aggregated PATP present different intensities near the gap between the nanowire and the nanoparticle when a polarization-dependent laser illuminated one end of the nanowire (Fig. 5). The intensity of the SERS spectra is strongest when the polarization of the incident laser is parallel to the axis of the nanowire. This provides indirect evidence that PATP can be catalyzed to DMAB by a plasmon waveguide generated from the remote excitation of nanowires in living cells.
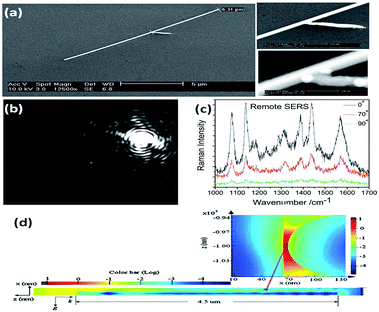 |
| | Fig. 5 (a) The SEM of nanowires and enlarged junction. (b) The dark field image of a nanowire illuminated by laser at an angle of 0° between the direction of polarization and the axis of the nanowire. (c) Raman spectra of DMAB illuminated with different remote-excitation angles. (d) Simulated field distribution of propagating surface plasmons along the nanowire and at the gap near the nanoparticle.37 | |
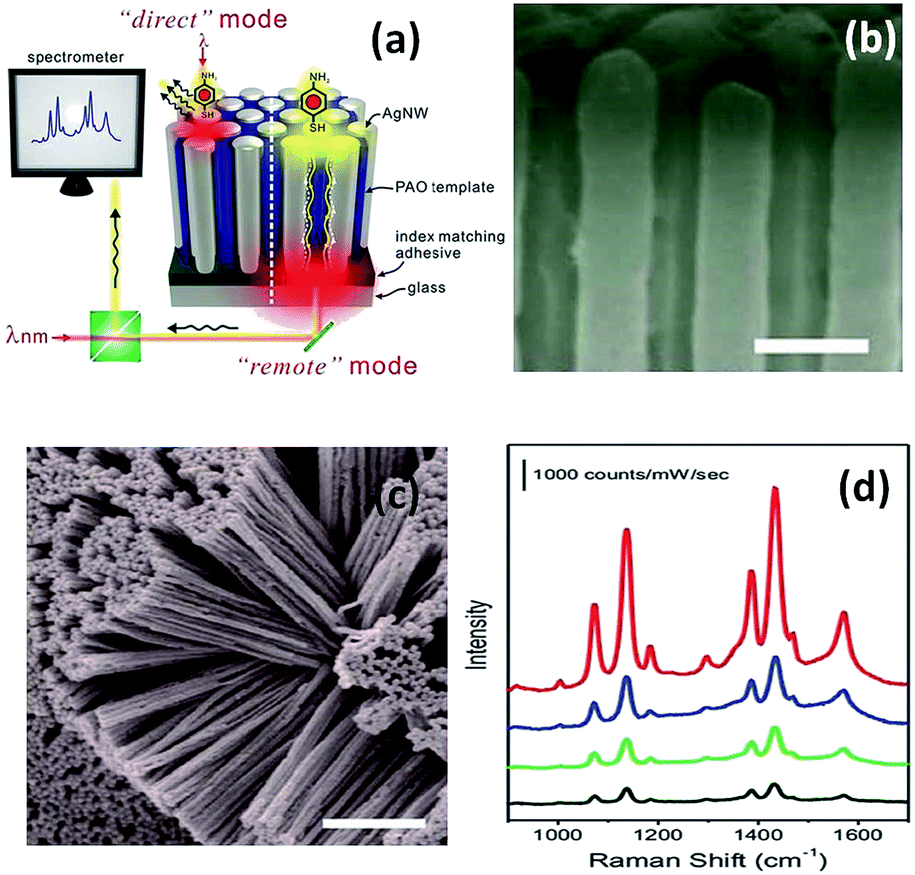
Later in 2012, a nanoarray was designed to improve the efficiency of the remote-excitation catalytic reaction due to an enhanced electromagnetic field between the nanowire gaps. The experimental measurement setup is shown in Fig. 6(a). Firstly, the incident laser illuminated one end of the Ag nanowire array clusters, and then SERS spectra of PATP deposited on the other end of the Ag nanowire array clusters could be collected, as shown in Fig. 6(d). It was noted that reflection can be decreased by matching with an index-suitable adhesive at the substrate–system interfaces. Fig. 6(b) and (c) present the uniform silver nanowire array clusters. As an ultrasensitive sensor, the silver nanowire array coated on an optical fiber can be used to probe molecule signals in living cells by remote-excitation technology.38 The novel system was also used in water decomposition and plasmon-induced catalytic reactions.39–41
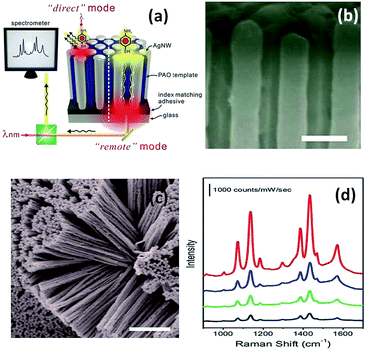 |
| | Fig. 6 (a) Sketch of PATP induced on a silver nanowire array system. (b) Top view of 3D Ag nanowire array, and (c) SEM image of messy silver nanowire array. (d) SERS spectra of PATP induced in the different positions.38 | |
Furthermore, some other ways that PATP is coupled to DMAB have also been widely studied by the SERS technique in different geometrical structures. A plasmon-induced catalytic reaction of PATP to trans-DMAB rather than cis-DMAB by SPs reveals different results for the different nanostructure compositions. For example, PATP can be catalyzed to DMAB on pure Ag film, as shown in Fig. 7(a), but it cannot be converted to DMAB on pure Au film, as shown in Fig. 7(b). In addition, the catalytic reaction of PATP to DMAB can occur in the gap between Ag nanoparticles and Ag film, as shown in Fig. 7(c), but cannot occur in the gap between Ag nanoparticles and Au film, as shown in Fig. 7(d).43 These experimental results are consistent with Wu's theoretical work.42
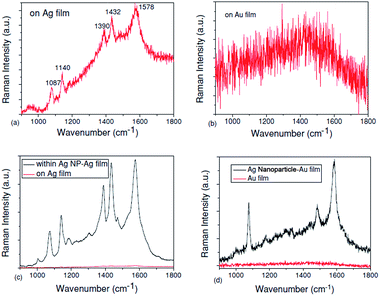 |
| | Fig. 7 (a) Raman spectra of PATP located on Ag film, (b) Raman spectra of PATP located on Au film, (c) Raman spectra of PATP located in the gap between Ag nanoparticles and Ag film and (d) Raman spectra of PATP located in the gap between Ag nanoparticles and Au film.43 | |
2.2 Plasmon-driven catalytic oxidization reaction in an aqueous environment
To overcome the shortcomings caused by instability and contamination in the atmospheric environment, many researchers attempt to investigate the catalytic oxidization reaction by employing home-made setups in an aqueous environment. The aforementioned experiments were conducted in a neutral ambient environment.44,45 So we introduced the catalytic oxidization reaction of PATP in a non-neutral aqueous environment.46 Sun et al. discovered that acidic or alkaline conditions can efficiently control plasmon-driven surface catalytic reactions. For example, PATP can be converted to DMAB in a pH = 10 solution (see Fig. 8(a) and (b)), but cannot be dimerized in pH = 3 solution containing Au and Ag nanoparticles (see Fig. 8(c) and (d)). So, we can control the occurrence of a surface catalytic reaction by adjusting the pH value of the solution. Furthermore, a time-dependent surface catalytic reaction was also conducted in solutions of different pH by Gabudean et al.47
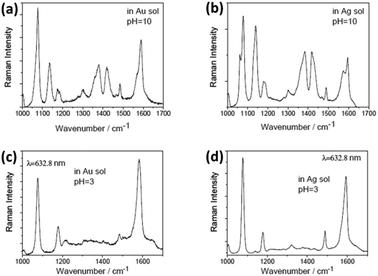 |
| | Fig. 8 SERS spectrum of DMAB at pH = 10 (a) in Au solution (b) in Ag solution. SERS spectrum of PATP at pH = 3 (c) in Au solution (d) in Ag solution.46 | |
2.3 Plasmon-driven catalytic oxidization reaction by TERS
In general, tip-enhanced Raman spectroscopy (TERS) has much higher sensitivity and spatial resolution than SERS during the signal detection of molecules.48–51 For TERS, localized surface plasmons are generated between a sharp metal tip and a metal substrate to detect a molecular signal by overcoming the diffraction limit of light. Recently, more and more scientists have used the TERS technology to realize plasmon catalysis reactions and a non-linear effect.52–54 As a typical and compelling example, Merlen et al. performed the plasmon-driven catalytic reaction of conversion of PATP into DMAB by TERS (see Fig. 9(a)).57 More spectral information is presented in TERS than in previous SERS.55,56 The result reveals that PATP is dimerized into DMAB by hot electrons generated from the nanogap between the tip and the substrate. Mapping information of PATP and DMAB was observed at different points and white and black positions represent different intensities in Fig. 9(c). There is a stronger intensity in bright positions than in dark positions. The corresponding TERS spectra of PATP and DMAB are displayed in Fig. 9(d). The result indicates that PATP can be converted to DMAB on the Au substrate because of the appearance of obvious peaks at 1390 cm−1 and 1440 cm−1. This provides direct evidence that plasmon intensity between the tip and the substrate plays a key role when the surface catalytic reaction Raman spectra of PATP and DMAB are simulated, which is consistent with the experimental results in Fig. 9(b).
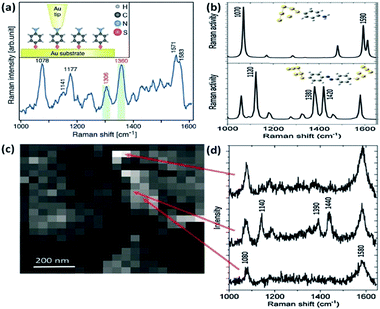 |
| | Fig. 9 (a) Schematic illustration of PATP located between tip and Au substrate. (b) Raman spectra of PATP (above) and DMAB (below) absorbed on Au nanoparticles by DFT. (c) TERS mapping for different positions, and (d) Raman spectra of the mapping for different positions.57 | |
Excitingly, the reverse process of PATP dimerization to DMAB was also performed by TERS under acidic conditions.58 DMAB can be selectively snipped to PATP by plasmon scissors which are hot electrons generated between the tip and the substrate under the illuminating conditions. A schematic of DMAB snipped to PATP by HV-TERS is shown in Fig. 10(a). There is no obvious change with strong laser power (100%) and different illumination times (0 min and 60 min) in the TERS of PATP, while DMAB is not converted to PATP at a weak laser power (1%), as shown in Fig. 10(b). Generally speaking, the potential energy surface of DMAB is firstly attached by hot electrons produced from the tip plasmon decay to decrease the reaction barrier, and then additional energy is used to selectively snip the NN bond of DMAB when the reaction energy provided from the hot electrons is over the dissociation energy under the laser illumination, as shown in Fig. 10(c) and (d).
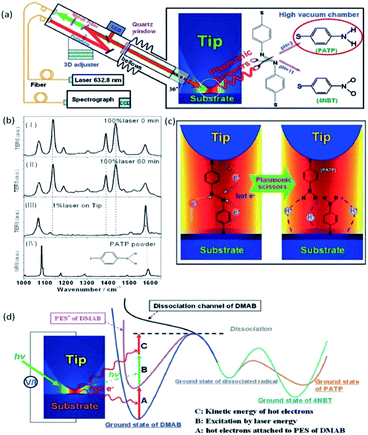 |
| | Fig. 10 (a) Schematic of DMAB separated by HV-TERS as plasmonic scissors. (b) TERS and NR spectra under different conditions. TERS spectra of DMAB at 0 (I) and 60 min (II), TERS of PATP on the tip with 1% power excitation for 60 min (III) NRS of PATP powder (IV). (c) Dynamic process of DMAB dissociating to PATP by HV-TERS. (d) Schematic of the process paths of DMAB dissociated to PATP.58 | |
2.4 Plasmon-driven catalytic oxidization reaction on metal/graphene hybrids
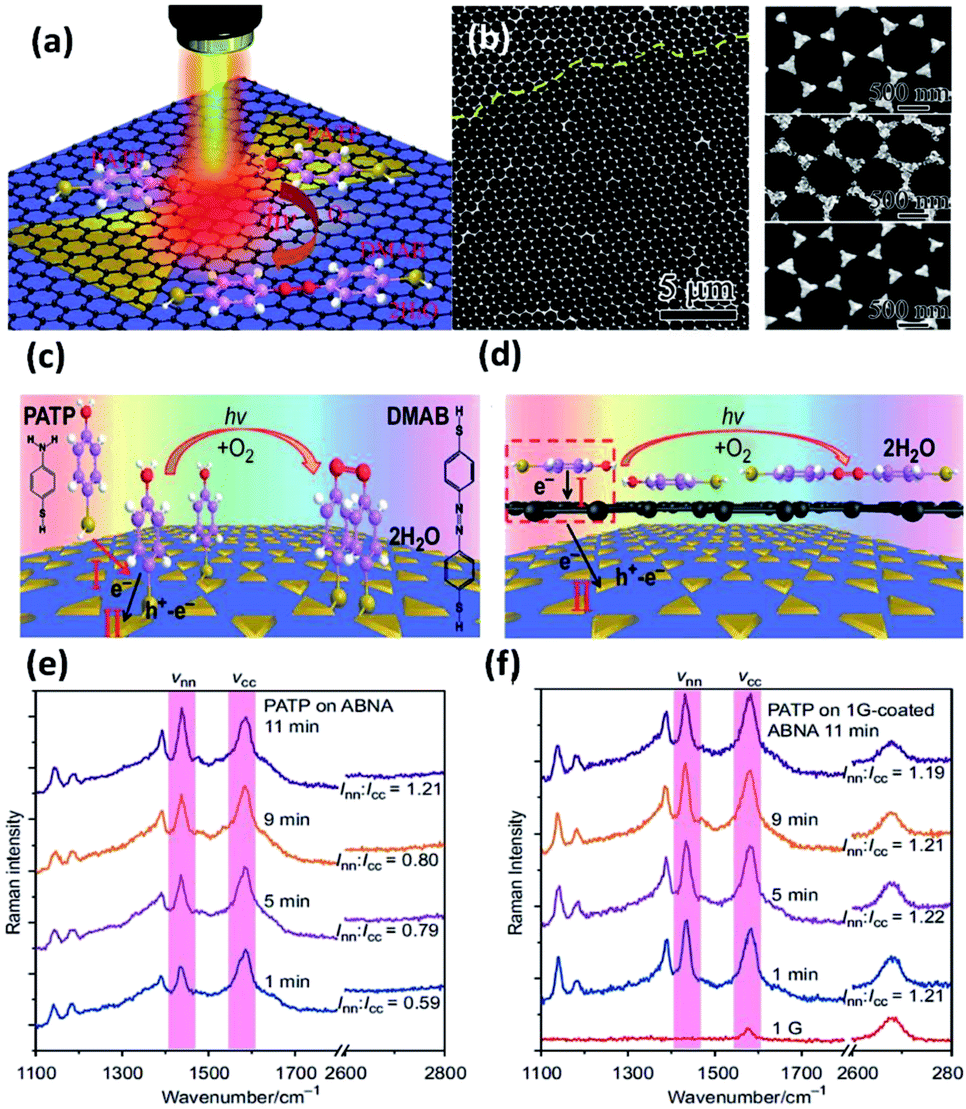
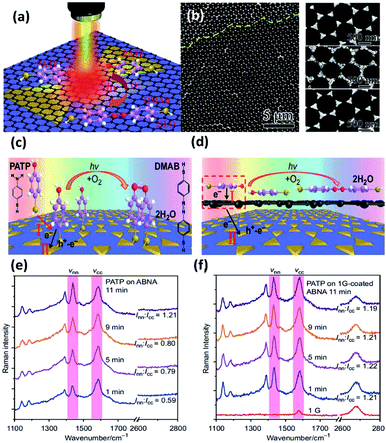
As a compelling and promising SERS hybrid, graphene–plasmon structures have attracted vast interest in surface-enhanced Raman scattering.60–62 However, the plasmon-driven catalytic reaction employing graphene is still ambiguous. So, studies of reaction kinetic processes are being urgently performed to clarify the mechanism of the catalytic reaction. Recently, Sun et al. fabricated silver bowtie nanoantenna arrays (SBNAs) covered with graphene to investigate the catalyzed reaction of PATP to DMAB.59 A schematic illustration of the dimerization reaction of PATP to DMAB on a graphene–SBNAs hybrid is depicted in Fig. 11(a). Large-area graphene coated on uniformly ordered SBNAs is used to protect the metal nanostructure from surface damage by means of distinct electronic density (see Fig. 11(b)). The result demonstrates that PATP can be vertically absorbed on the silver nanostructure surface by thiol groups without graphene. However, they are arranged in parallel when the graphene is coated on the silver nanoantenna surface. The main reason is the contribution of delocalized π electrons (Fig. 11(c) and (d)). Thus, the induced strong dipole can accelerate the electron transfer from single-layer graphene to PATP. The phenomenon is monitored by in situ Raman spectra of PATP, in which the ratio Inn/Icc represents the efficiency of the catalytic reaction, where Inn and Icc represent the Raman intensities of the NN bond and C–C bond, respectively. To reach the same value (Inn/Icc = 1.21), the catalytic reaction time of PAPT converted to DMAB is reduced to 1 min on single-layer graphene-coated SBNAs (see Fig. 11(e)). Nevertheless, it is completed on pure SBNAs after 11 min (see Fig. 11(f)). Meanwhile, the charge densities of PATP are simulated on bi-layer graphene-coated Ag nanostructures. This simulated data shows that electrons can easily reach the top of the bi-layered graphene, but find it very hard to transfer to the silver bowtie arrays and the bottom of the bi-layered graphene. In other words, the bi-layered graphene-coated silver cluster is inefficient in enhancing the plasmon-driven catalytic reaction. This shows that single-layer graphene can be employed as an enhancer rather than an inert covering layer.
 |
| | Fig. 11 (a) Schematic illustration of PATP converted to DMAB on single-layer graphene mediated silver nanoantenna arrays. (b) SEM image of silver bowtie nanoantenna arrays coated with large-area graphene; schematic illustration of the conversion reaction of PATA absorbed on (c) nanoantenna arrays which are uniformly designed and (d) graphene mediated SERS substrates; time-dependent SERS spectra of plasmon-induced catalytic reaction of PATP on (e) nanoantenna arrays and (f) graphene mediated nanoantenna arrays.59 | |
Moreover, the aforementioned two-dimensional graphene-base compositions have the disadvantages of a frangible surface and low specific surface area.63–67 To acquire a high-intensity plasmon coupling effect, Zhao et al. designed a three-dimensional nanostructure (see Fig. 12(a) and (b)), graphene-nanosheet and Ag-nanoparticles, which were used to investigate the graphene-based plasmon-induced oxidation reaction. Compared with both pure Ag nanoparticles and single graphene-coated Ag nanoparticles, the Raman spectra of 3D graphene-nanosheet/Ag-nanoparticles structures show the higher efficiency of the enhanced plasmon-driven catalytic reaction (see Fig. 12(e)). SEM images of the three different structures are shown in Fig. 12(c) and (d). Graphene can provide more electrons to participate in collective electron oscillations to decrease the reaction barrier. Hence, hot electrons coming from graphene can contribute more active energy to catalyze PATP to DMAB in the nanogap between the nanosheets. A corresponding enhanced mechanism was calculated by FDTD and the related report can be seen in ref. 68. This indicates that flower-like graphene nanosheets coated on Ag nanoparticles can effectively catalyze PATP to DMAB among the sheets, and graphene plays a synergetic role in the surface plasmon-driven catalytic reaction.
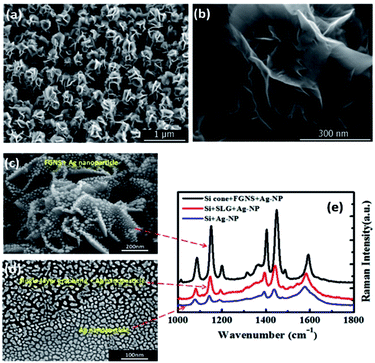 |
| | Fig. 12 (a) SEM image of the flower-like graphene nanoarray. (b) A high-resolution enlarged image of the graphene nanosheets. (c) SEM image of an Ag nanoparticle coated 3D graphene nanosheet substrate. (d) The single-layer graphene covered Ag nanoparticles (top) and Ag nanoparticles (bottom). (e) SERS spectra of the surface catalytic reaction processes of PATP to DMAB on the three corresponding substrates.68 | |
3. Plasmon-driven surface catalytic reduction reaction
3.1 Plasmon-driven surface catalytic reduction reaction by SERS in atmosphere conditions
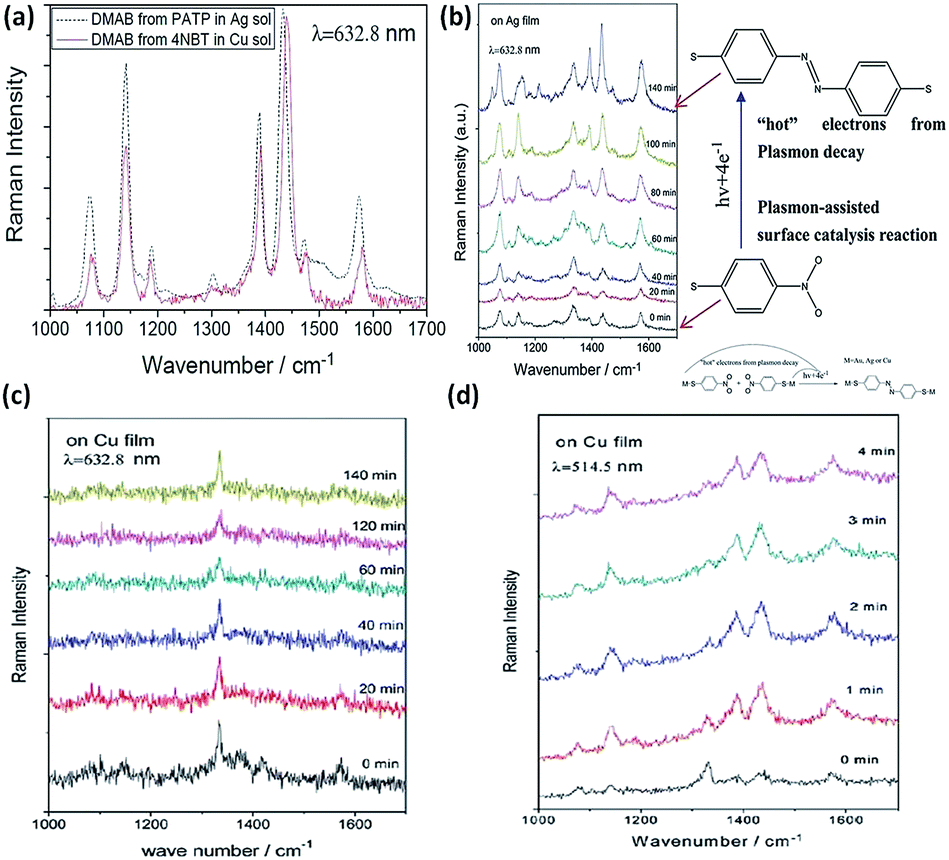
The plasmon-driven reduction reaction is another typical catalytic reaction, in which the hot electrons coming from plasmon decay can convert target molecules to new products in a nanoscale chemical reaction. Compared to PATP, the plasmon-driven surface catalysis reaction of 4-NBT displays similar Raman SERS spectra (Fig. 13(a)). So it is inferred that the product of the reaction employing the noble metal is DMAB. A subsequent report proves that 4-NBT is also converted to DMAB by hot electrons generated from plasmon decay.69 From the chemical point of view, dimerization of 4-NBT to DMAB is a reduction reaction during the SERS detection of 4-NBT. This indicates that surface plasmons also play a key role in the surface catalytic reaction; meanwhile the discovery of the kinetic process of 4-NBT to DMAB broadens the field of surface catalytic reactions. Sun. et al. showed that the kinetic process of 4-NBT to DMAB is affected by substrate species, laser wavelength, and illumination time (see Fig. 13(b)). The surface catalytic reaction of 4-NBT to DMAB on the Cu film cannot occur, although the time is prolonged up to 2 h with excitation at 632.8 nm (see Fig. 13(c)). However, the Raman characteristic peaks of DMAB are observed within several minutes with excitation at 514.5 nm (Fig. 13(d)). This indicates that the excitation wavelength can affect the occurrence of the reduction reaction of 4-NBT to DMAB. The corresponding reaction mechanism can be seen in the inset of Fig. 13(b). Moreover, the catalytic reaction can occur on Ag film in no time and cannot occur on Au film over a long time.9 These reported results show that the coupling reaction of nitro groups is intensively influenced by substrate species, laser wavelength, and illumination time.70–74 An additional report shows that the plasmon-driven catalytic reaction of 4-NBT is also dependent on the laser power. The intensity of the surface plasmons is highest when the laser wavelength matches the collective oscillation frequency of the electrons. Some other reports also demonstrate that 4-NBT can be converted to PATP under an atmosphere of N2-saturated H2O.36 It is necessary to classify the true nature of 4-NBT to DMAB rather than PATP. This is outside the range of the plasmon-driven reduction reaction when 4-NBT is dimerized to DMAB with additional reducing agents. Moreover, Sun et al. found that functional groups of molecules can be removed and decorated by the so-called ‘Plasmon scissors’.58 Subsequently, the reduction reaction of Fe3+ to Fe2+ was also witnessed with the help of hot electrons coming from sliver nanoparticles.75 Halas et al. reported that the dissociation of H2 can be realized with the aid of hot electrons generated from Au nanoparticles.25,76 The above reports clearly indicate that plasmon-driven catalytic reactions is a new research field, which might initiate an avenue into the investigation of novel catalytic techniques.
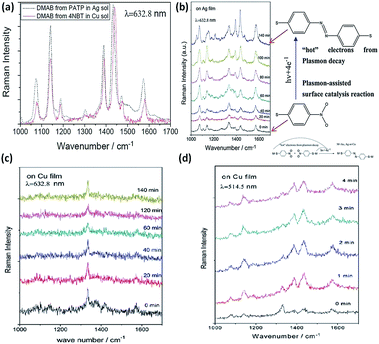 |
| | Fig. 13 (a) SERS spectra of catalytic reaction of PATP in Ag solution and 4NBT in Cu solution with an excitation wavelength of 633 nm. (b) Conversion of 4-NBT to DMAB with an excitation of 633 nm on Ag film. Time-dependent surface catalytic reaction of 4-NBT on Cu film with excitation of 633 nm (c) and excitation of 514.5 nm (d).9 | |
Currently, remote excitation surface-catalytic reduction has also been realized by propagating plasmons.77–79 A plasmon waveguide used as a nanoantenna can induce 4-NBT to DMAB at a junction due to the massive EM field contribution. Fig. 14(a) shows the SEM images of crossed-Ag nanowires with diameters of 110 nm and 126 nm. The tiny white spot appears at the junction where propagating SPPs can be efficiently coupled in a light-emitting manner (Fig. 14(b)). The occurrence of DMAB characteristic peaks demonstrates that the surface catalytic process can be controlled by induced plasmons with different incident polarization excitations (Fig. 14(c)). The intensity of the Raman characteristic peaks of DMAB reach a maximum value when the polarization direction of the incident laser is parallel to the nanowire axis. SPPs propagating along the nanowire can efficiently induce the occurrence of the surface catalytic reduction reaction. The corresponding catalytic mechanism can be seen from Fig. 14(d).
 |
| | Fig. 14 (a) SEM image of intersecting Ag nanowires. (b) Dark field image of crossed Ag nanowires. The big white spot is incident light and the tiny spot is the emitting light. (c) The polarization-dependent remote surface catalytic reaction of 4-NBT. (d) Schematic illustration of 4-NBT converted to DMAB by propagating SPPs, where the surface plasmons exit at one terminal and the Raman signal is collected at the other terminal of an Ag nanowire.77 | |
3.2 Plasmon-driven surface catalytic reduction reaction by SERS in an aqueous condition
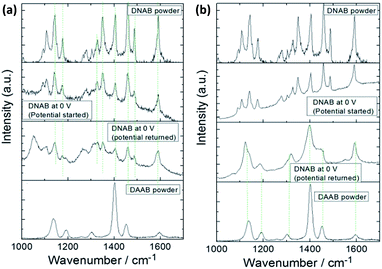
Fig. 15(a) shows that DNAB is catalyzed to DAAB with excitation at 532 nm in an aqueous environment with the potential increasing. At a potential of 0 V, the reduction reaction cannot occur; however, it can happen when the potential is decreased to −1.2 V and then returns to 0 V (see Fig. 15(a) and (b)) because the external electric potential can prompt the occurrence of the reduction reaction.80–84 The potential-dependent surface catalytic reaction is also investigated with excitation at a wavelength of 785 nm. But there are no obvious changes in the whole potential changing process. Hence, the plasmon-driven reduction reaction is influenced by laser wavelength. In the other words, the plasmon-driven chemical reaction depends strongly on the local surface plasmon resonance (LSPR) in an electrochemical environment. In 2014, Cui et al. found that the intensity of LSPR with excitation at a wavelength of 785 nm is less than that at a wavelength of 532 nm.81 Thus, the plasmon-driven reduction reaction is difficult with excitation at a wavelength of 785 nm. The intensity of the surface plasmons plays a key role in the plasmon-driven catalytic reaction in an aqueous environment.
 |
| | Fig. 15 Comparison of the experimental and theoretical Raman spectra of DNAB excited at 532 nm (a) and 785 nm (b).81 | |
3.3 Plasmon-driven surface catalytic reduction reaction by TERS
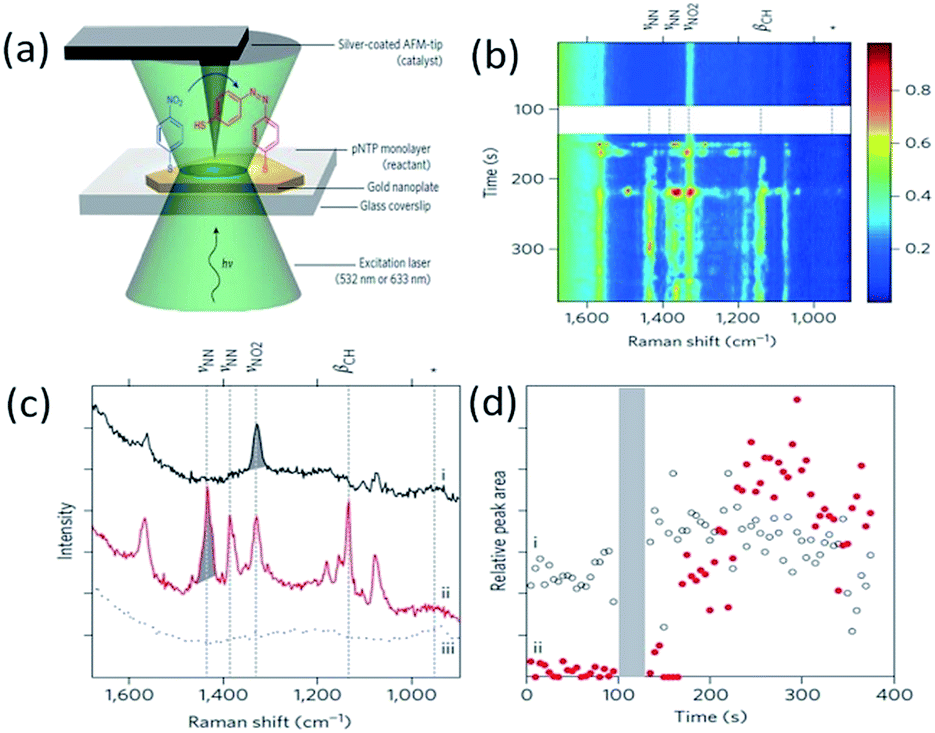
The plasmon-driven catalytic reduction reaction of 4-NBT to DMAB was investigated by TERS technology in an atmospheric environment in 2012.53 As a typical example, Lantman et al. found that the feature peaks of DMAB can be observed by TERS during the detection of 4-NBT placed between the Ag-coated tip and the Au substrate. This indicates that 4-NBT is catalyzed to DMAB by hot electrons generated from the tip plasmon decay (see Fig. 16(a)). Moreover, all of the 4-NBT was immediately converted to DMAB by TERS with excitation with a 532 nm laser alone. Subsequently, the catalytic reaction of 4-NBT to DMAB was performed with a combination of excitation at two wavelengths, where the wavelength of a 633 nm laser is used to measure the molecular signal, and then the wavelength of a 532 nm laser is used to activate the reaction. The reaction product can be confirmed from its Raman feather peaks (see Fig. 16(b)–(d)), and the theoretical simulation can be seen in ref. 55.
 |
| | Fig. 16 (a) Schematic of catalytic reaction of 4-NBT to DMAB shown by AFM-TERS. (b) and (c) Time dependent TERS spectra of DMAB at the incident wavelength of 633 nm. (d) Peak areas as a function of time for the peak at 1338 cm−1.53 | |
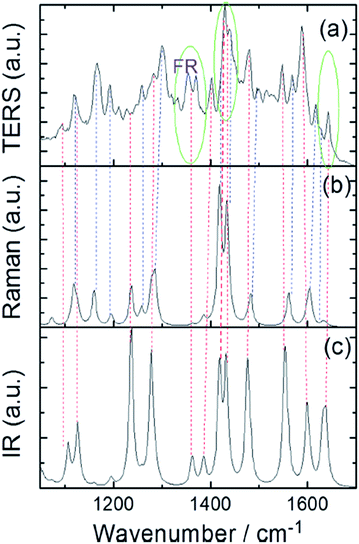
To offer a clean chemical environment, a high-vacuum TERS system is widely used in chemical analysis to prevent contamination by other molecules.86,87 As Fig. 17(a) shows, the TERS system is placed in a vacuum chamber. Sun et al. performed the power-dependent Raman spectra of the catalytic reaction of 4-NBT in the HV-TERS system.85 There are almost no changes in the TERS signals of a molecule with less than 3% laser intensity excitation. 4-NBT is partially catalyzed to DMAB when the laser intensity is increased to 10%. That is to say: 4-NBT and DMAB coexist. However, 4-NBT molecules are completely converted to DMAB when the laser intensity is raised further to 100%. More interestingly, there is no change in the TERS signals of the molecules when the laser intensity is returned to 0.5%. This result provides indirect evidence that it is an irreversible reaction, with the variation in the incident intensity shown in Fig. 17(b).
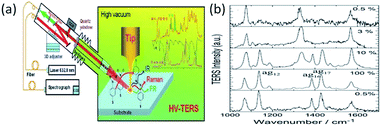 |
| | Fig. 17 (a) Schematic of, the chemical reaction by HV-TERS setup and corresponding Raman and IR spectra. (b) Intensity-independent conversion reaction of 4-NBT to DMAB, when 100% laser power is about 2 mW.85 | |
Another an interesting study has also been reported by Sun et al. in which molecules of 2,4-dinitrobenzenethiol containing nitro groups located at different positions can be selectively catalyzed by HV-TERS.88 The result reveals that 4,4′-nitro groups can be coupled to NN stretching modes on the Ag substrate in the SERS spectrum and richer information is seen in the TERS spectrum (Fig. 18).
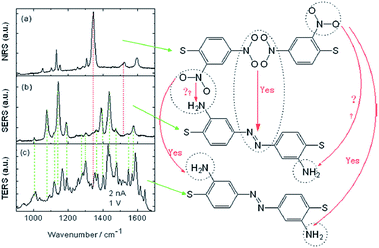 |
| | Fig. 18 (a) Normal Raman spectrum of 2,4-DNBT powder, (b) SERS spectrum of 2,4-DNBT, and (c) TERS spectrum of 2,4-DNBT on an Ag substrate. The bias voltage is 1 V and the tunnelling current is 2 nA in TERS.88 | |
To further to confirm the identity of the reaction product, experimental and simulated TERS spectra are first used to analyze the ultimate product, which indicates that 2,4-DNBT is catalyzed to a DMAB derivative by judgment of its Raman-active modes (Fig. 19(a) and (b)). Then, the product (2,2′-DAAB) is ultimately confirmed by analysis of its IR-active modes (Fig. 19(a) and (c)).
 |
| | Fig. 19 (a) Simulated TERS, (b) Raman and (c) infrared spectra of DMAB derivative.88 | |
3.4 Surface plasmon-driven catalytic reduction reaction on metal–graphene hybrids
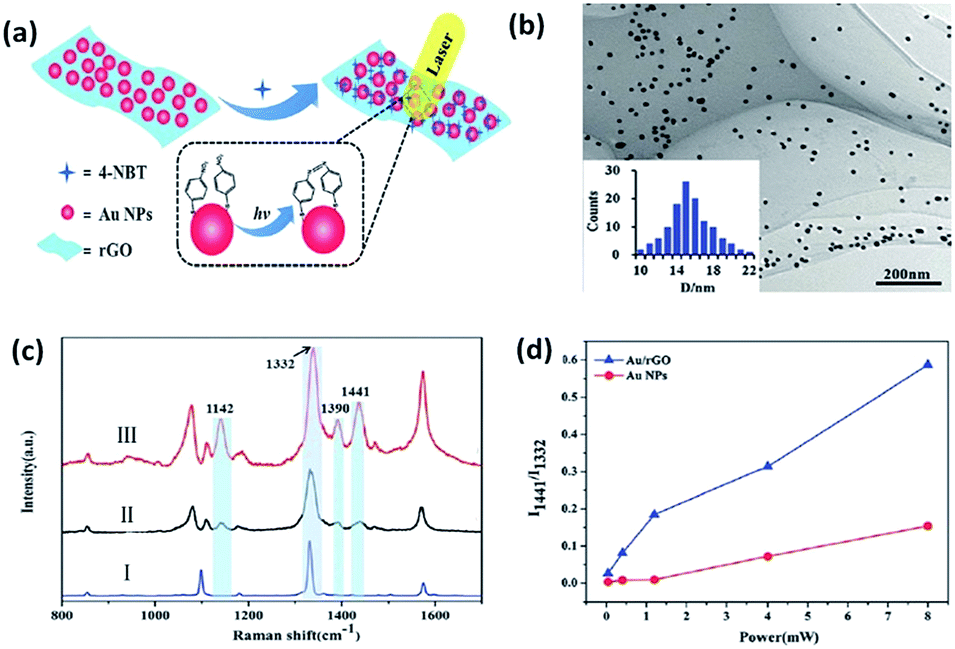
Recently, bi-functional nanocomposites have drawn more and more attention in the field of catalytic reactions because of the discovery of a novel way to probe and control the catalysis of molecules by surface plasmons with the development of SERS.89–94 A combination of a noble metal and graphene is considered to be a sensitive substrate to prompt the catalytic reaction of 4-NBT. Lang et al. investigated whether a graphene-based nanocomposite (Au/rGO) exhibited a lower power threshold and higher catalytic efficiency than pure Au nanoparticles toward the reduction reaction of 4-NBT (Fig. 20(a)).59 As Fig. 20(b) shows, Au nanoparticles are uniformly distributed on the reduced graphene oxide (rGO) surface and the average size of these nanoparticles is 14.5 nm. Raman spectra are conducted to monitor the occurrence of the reduction reaction of 4-NBT. Firstly, three feature peaks of the 4-NBT molecule are observed on pure substrate in part I in Fig. 20(c), which correspond to the S–C bond, N–O bond and C–C bond of the benzene ring, respectively. Compared with the other two parts: II and III in Fig. 20(c), an additional three new peaks are observed at 1141 cm−1, 1390 cm−1 and 1441 cm−1, respectively, which firmly indicate that 4-NBT is transformed to DMAB on Au nanoparticles (part II) and Au–rGO nanocomposite (part II). However, the Raman intensities of the three new peaks are much higher on the Au–rGO nanocomposite than on the Au nanoparticles alone. Thus, the Au/GO substrate is more efficient at catalysing the reduction reaction of 4-NBT to DMAB. The same conclusion can be derived from Fig. 20(d). Moreover, another reduction reaction of PNP molecules containing nitro groups to PAP was also investigated in a graphene/Au hydrogel. PNP absorbed on graphene can quickly obtain the electrons from Au nanoparticles. This strongly indicates that the synergetic effect of graphene is very important in a graphene-assisted plasmon-driven catalytic reaction.
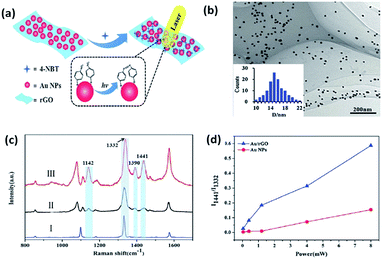 |
| | Fig. 20 (a) Schematic illustration of surface plasmon-driven catalytic process of 4-NBT to DMAB. (b) TEM images of rGO-covered Au nanoparticles. (c) Raman spectrum of 4-NBT powder (I) absorbed on Au nanoparticles (II) and Au/rGO nanocomposites (III). (d) Intensity ratios of two specific Raman peaks at 1332 and 1441 cm−1 as a function of laser power with an incident wavelength of 647 nm.59 | |
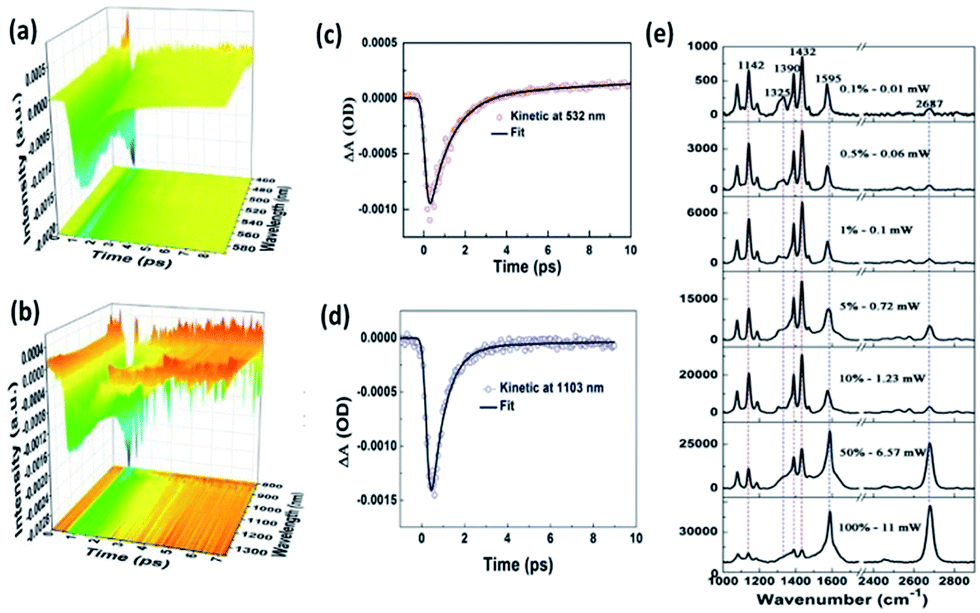
As we know, the conversion efficiency of plasmon-to-electron serves as a key factor to control the occurrence rate of the surface catalytic reaction. For the efficiency detection of plasmon-driven reactions, Furube et al. investigated the ultrafast dynamics process of a plasmon-driven catalytic reaction by femtosecond transient absorption spectroscopy on a gold–TiO2 hybrid substrate.95–98 Recently, Ding and co-workers showed that the plasmon-to-electron conversion efficiency was increased three-fold on a silver–graphene composite over that on gold–TiO2 hybrids. The main reason is that a silver–graphene composite has a high density and long lifetime.99 As Fig. 21(e) shows, the catalytic reaction of 4-NBT converted to DMAB can occur with the aid of plasmon–graphene hybrids even at a weak laser intensity. Meanwhile, the lifetime of plasmon-induced hot electrons is also seen in the Vis and NIR region in Fig. 21(a)–(d).
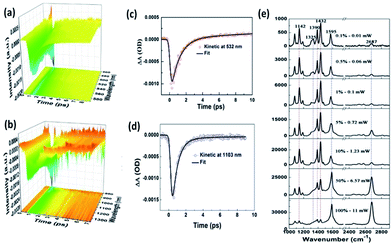 |
| | Fig. 21 (a) Ultrafast transient absorption spectroscopy of Ag nanowires coated on graphene in visible light. (b) The fitted dynamic curve at 532 nm. (c) Ultrafast transient absorption spectroscopy of Ag nanowires coated on graphene in the NIR region. (d) The fitted dynamic curve at 1103 nm. (e) Laser power-dependent GERS spectra of 4-NBT on monolayer graphene with 532 nm excitation.99 | |
4. Selectivity of plasmon-driven surface catalytic redox reaction
4.1 Selectivity of plasmon-driven surface catalytic redox reaction in an atmospheric environment
The oxidation reactions of either molecules containing amino groups or the reduction reactions of molecules containing nitro groups have already been discussed in the previous two parts, respectively. But the priority selectivity of plasmon-driven catalytic reactions of molecules simultaneously containing amine and nitro groups has not yet been introduced. So we will discuss the selectivity of plasmon-driven catalytic reactions in this part. Recently, PNA has served as one of the best candidates for the priority study of redox reactions in different environments. Firstly, Cui et al. reported that PNA is selectively dimerized to DAAB rather than DNAB on a roughened Ag electrode in an aqueous environment. However, Zhao et al. theoretically calculated that PNA will be converted to DNAB on an Ag cluster in an atmospheric environment.101 Subsequently, Ding et al. verified that PNA can be preferentially dimerized to DAAB rather than DNAB on a graphene-mediated metal nanostructure in air (Fig. 22(a)). These results have been firmly testified by mapping intensity images and their SERS spectra, which are illustrated in Fig. 22(b)–(d). The detailed analysis can be seen in ref. 102.
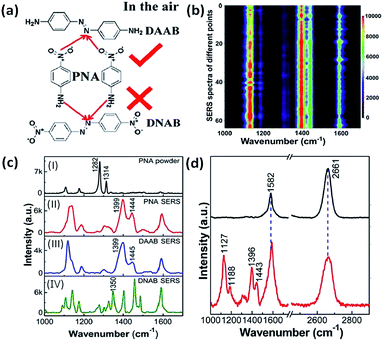 |
| | Fig. 22 (a) Molecular structure of conversion of PNA to DAAB rather than DNAB. (b) 2D mapping image of PNA, in which red represents high intensity and dark represents low intensity. (c) Normal Raman spectrum of PNA powder (I), SERS spectrum of PNA (II), of DAAB (III) and of DNAB (IV) on the AgNPs. (d) SERS spectrum of graphene coated on AgNPs (top) and of PNA converted to DAAB on the G/AgNP substrate (bottom).102 | |
4.2 Selectivity of plasmon-driven surface catalytic redox reactions in an aqueous environment
In 2015, Ding et al. discovered that plasmon-driven selective reduction reactions have several advantages in an aqueous environment rather than in the atmosphere.103 The reaction product, 2-amino-5-nitrobenzenethiol (2A-5-NBT), is stable in aqueous environments and unstable in the atmosphere. Fig. 23(d) demonstrates that the intermediate product (3,3′-dimercapto-4,4′-diaminoazobenzene) can revert to 2A-5-NBT in the atmosphere (Fig. 2(i)). The stability of the expected product can be confirmed by measuring the time-dependent SERS in an aqueous environment (Fig. 23(b)) and in an atmospheric environment (Fig. 23(c)).100 The acquisition time of each spectrum is 90 seconds, and the time interval is 3 minutes.
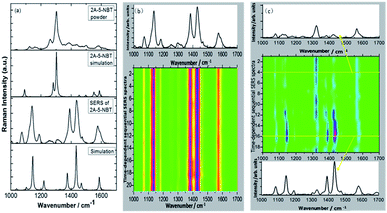 |
| | Fig. 23 (a) Experimental and simulated normal Raman spectra and the SERS spectra of 2A-5-NBT and expected products in an aqueous environment. (b) Time-dependent SERS spectra in an aqueous environment. (c) Time-dependent SERS spectra in an atmospheric environment.100 | |
In an aqueous environment, the 2A-5-NBT molecule can be stably coupled to 3,3′-dimercapto-4,4′-diaminoazobenzene. Similarly, Cui et al. discovered that PNA is converted to DAAB in an aqueous environment and that the final product is very stable. From the result it can be concluded that the reduction reaction of the nitro group has preference over the oxidation reaction of the amino group in an aqueous environment (Fig. 24(a)). The catalytic reactions of PNA were probed by E-SERS with the potential changing from 0 V to −1.2 V in a neutral, acidic or alkaline environment. Fig. 24(b) shows that the plasmon-driven reduction reactions are stable in aqueous environments of different pH. This differs from the chemical reactions in the atmosphere because oxygen in the atmospheric environment can affect the plasmon-driven surface catalytic reaction. So the priority selectivity of plasmon-driven oxidation and reduction reactions is determined by the external environment. Here, oxygen is a very important factor influencing plasmon-driven catalytic reactions in an ambient environment,80 because oxygen can promote the amino group oxidation process. Whereas, amine oxidation is limited in an aqueous environment. This is why the plasmon-driven oxidation reaction is favored over the reduction reaction in the atmosphere, but the reduction reaction occurs prior to the oxidation reaction in an aqueous environment.103
 |
| | Fig. 24 (a) Comparison between experimental Raman spectra of PNA and the products DAAB excited at 532 nm. (b) SERS spectra of potential-dependent catalytic reaction of PNA with excitation at 532 nm at different pH values. (c) Experimental and simulated Raman spectra of DAAB with excitation at 532 nm.104 | |
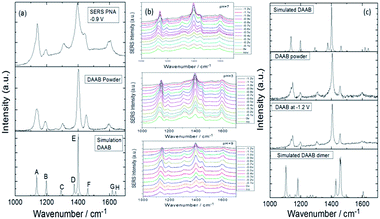
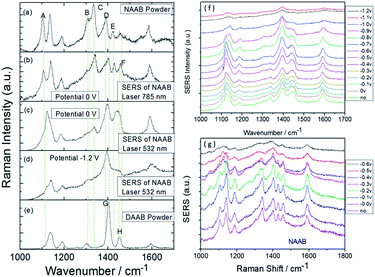
Interestingly, 4-nitro-4′-aminoazobenzene (NAAB) containing a nitro group and an amino group, as a novel and suitable candidate, was also used to investigate the priority of the plasmon-driven redox reaction in aqueous conditions.82 The result reveals that the occurrence of a potential-dependent electrochemical reduction reaction is prior to the oxidation reaction, as can be seen by comparing Fig. 25(a) and (c), where Fig. 25(c) was extracted from the electrochemical SERS spectra of NAAB at an external electric potential from 0 V to −1.2 V with 532 nm laser excitation. Furthermore, the product DAAB is very stable and cannot revert to NAAB in an aqueous environment (Fig. 25(d)), as can be seen by comparing it with the normal Raman spectra of DAAB powder. Also the reduction reaction cannot occur with excitation at 785 nm at the potential of 0 V (Fig. 25(b)). This result confirms that the LSPR has an important influence on the surface plasmon-driven electrochemical reaction.
 |
| | Fig. 25 (a–e) Experimental and theoretical Raman spectra of NAAB. Electrochemical SERS spectra of NAAB with excitation at 532 nm (f) and 785 nm (g) excitation at different potentials.82 | |
Although the surface plasmon resonance intensity of the roughened Ag substrate is very weak with laser excitation at a wavelength of 785 nm,81 the NAAB molecule can be still catalyzed to DAAB at a potential of −0.6 V in an aqueous environment.83,84 This is due not only to the influence of increasing potential, but also to the contribution of the molecular resonance. NAAB is seen as being in a pre-resonant mode compared with the resonant mode of DAAB and DNAB (see Fig. 26) at 785 nm. Fig. 26 presents three absorption spectra of DAAB, DNAB and NAAB. The molecular resonance peak of DAAB is around 410 nm and that of DNAB is around 350 nm. They are both far from the 532 nm from Fig. 26(a) and (b). So DAAB and DNAB have only the normal Raman mode without the resonant mode with laser excitation at 532 nm. By comparing the absorption spectra of the three molecules, DNAB is in the pre-resonant mode in SERS, while NAAB is in resonant Raman mode with excitation at 532 nm. Thus, the molecular resonance has a great influence on the plasmon-driven catalytic reaction.
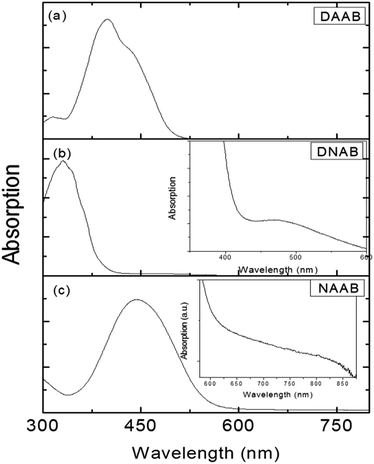 |
| | Fig. 26 (a) Absorption spectrum of DAAB, (b) absorption spectrum of DNAB, and (c) absorption spectrum of NAAB.104 | |
5. Plasmon–exciton coupling interaction for surface catalytic reactions
Very recently, the plasmon–exciton coupling interaction for surface catalytic reactions has been reported by Sun and co-workers.105,106 The advantages of the plasmon–exciton coupling interaction for surface catalytic reactions over plasmon-driven chemical reactions have been pointed out. The first example is the plasmon–exciton coupling interaction of monolayer MoS2–Ag nanoparticles of different sizes for surface catalytic reactions.105 To confirm the superiority of plasmon–exciton co-driven surface catalytic reactions, we performed contrast experiments on substrates with and without a covering of MoS2, as can be seen in Fig. 27(a). In Fig. 27(b), the two results are combined for visual comparison. The 25 nm Ag NPs are used because of their high catalytic ability. At a lower laser intensity of 0.0015 mW, the ratio of the Raman intensity of the reactant (1338 cm−1) to the product (1432 cm−1) was I1438/I1338 = 0.5 without MoS2 and I1438/I1338 = 2.8 with MoS2. This indicates that the probability of a chemical reaction for molecules directly adsorbed on the Ag NPs is much lower than that for those adsorbed on the MoS2/Ag substrate. When the laser intensity is increased to 0.015 mW, the Raman peak from the 4-NBT almost disappears for the MoS2/Ag hybrid system, while a small peak still exists for the Ag NPs system, which supports the aforementioned conclusion. Moreover, the electric field intensities are obviously different, as indicated by the different SERS intensities for the laser intensities of 0.0015 mW and 0.015 mW. The ratio IMoS2–Ag/IAg ≈ 0.2. The electric field intensity (|E|) decreases as the distance between the molecules and Ag nanoparticles increases due to the addition of the MoS2, and |E|MoS2–Ag/|E|Ag ≈ 0.67, since I ∝ |E|4. When the laser power is increased to 0.15 mW, the intensity of the SERS peak at 1438 cm−1 saturates without the covering of MoS2. With the help of MoS2, saturation does not occur. Although the MoS2 layer weakens the electric field by approximately 30%, the efficiency of the plasmon–exciton co-driven surface catalytic reaction at low laser intensities increases.
 |
| | Fig. 27 (a) The substrate for the contrast experiments and the SERS spectra are shown. There are only Ag NPs on the left, while the NPs are covered by MoS2 on the right. (b) The surface catalytic reactions for the 25 nm NPs with MoS2 (black line) and without MoS2 (red line).105 | |
The second example is the potential-dependent plasmon–exciton interactions of a graphene–exciton hybrid for surface catalytical reactions in electrochemical G-SERS.106 Fig. 28 shows the roughened Ag substrate and the roughened Ag substrate covered by graphene.
 |
| | Fig. 28 (a) and (b) The SEM image of the roughened Ag substrate without and with graphene. The scale bar is 500 nm.106 | |
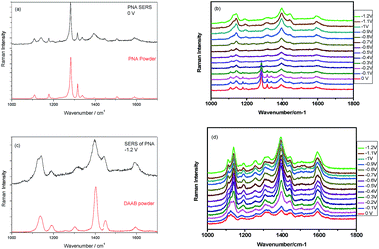
The Raman spectrum of PNA powder and the electrochemical SERS spectrum of PNA without potential can be seen in Fig. 29(a). It is found that their profiles are the same. The potential-dependent electrochemical SERS of PNA can be seen in Fig. 29(b). It is found that from 0 to −0.4 V, the SERS spectrum of PNA is the same as the Raman spectrum of PNA powder, where the vibrational mode at 1282 cm−1 is the –NO2 vibration; while with a further increase in potential, the SERS spectrum of PNA is significantly different from the Raman spectrum of PNA powder, where the vibrational mode of –NO2 disappears when the potential goes from −0.5 to −1.2 V (see Fig. 29(b)). Comparing the SERS spectrum of PNA at −1.2 V in Fig. 29(b) with the Raman spectrum of DAAB powder, we can clearly see that the SERS of PNA at −1.2 V was catalyzed to DAAB by plasmons (see Fig. 29(c)). Using a roughened Ag substrate covered with GQD, as seen in Fig. 28(b), we also measured the potential-dependent electrochemical G-SERS of PNA (see Fig. 29(d)), which are the cases of potentials from 0 V to −1.2 V. The advantage of G-SERS for the surface catalytic reaction is that the PNA can be reduced to DAAB even when the potential is at 0 V, which is much easier than the reduced reaction of PNA to DAAB on a SERS substrate without graphene, as can be seen by comparing Fig. 29(b) and (d).
 |
| | Fig. 29 (a) The Raman spectrum of PNA powder and SERS of PNA. (b) The potential dependent electrochemical SERS from 0 V to −1.2 V. (c) The comparison between DAAB powder and SERS of PNA. (d) The electrochemical G-SERS with potentials from 0 V to −1.2 V. | |
6. Conclusion and outlook
In summary, we have mainly reported that surface plasmon-driven catalytic reaction of molecules with amino or nitro groups can be probed by SERS and TERS in gaseous, aqueous or high-vacuum environments. It can also be seen as a state-of-the-art avenue into investigating the surface chemical reaction. As several typical examples, we chiefly introduced the kinetic mechanism of target molecule DMAB produced from PATP and 4-NBT by the participation of “hot electrons” arising from surface plasmon decay. We discovered that surface plasmons play a key role in the field of surface catalytic reaction processes. Meanwhile, a variety of noble structures were designed to induce an oxidation reaction of PATP or a reduction reaction of 4-NBT conversion to DMAB in different environments, such as Au/Ag nanoparticles, nanowires, nanofilm and graphene-based nanocomposites. Although the plasmon-driven surface catalytic reaction has been widely discussed with experimental and theoretical evidence, the in-depth kinetic mechanism still urgently needs to be discovered and investigated in the future. Furthermore, plasmon-driven catalytic efficiency is relatively low compared with the participation of additional catalysts and the plasmon-driven catalytic reaction is at the exploratory stage. Undoubtedly, improving the catalytic efficiency of plasmon-driven chemical reactions and their application in a large scale are desirable in future studies. We believe that the function of plasmons will draw more and more attention and that a breakthrough can be made with the development of SERS and TERS techniques. Hence, other nanostructures will be designed and exploited to increase the rate of plasmon-driven surface catalytic reactions, investigate time-dependent ultrafast catalysis, detect and treat cancer, and fabricate plasmon circuitry for the next generation of IT.
Acknowledgements
This work was supported by the National Natural Science Foundation of China (Grant No. 11304185, 11374353, 91436102, 11504224, and 11474141), National Basic Research Program of China (Grant number 2016YFA02008000).
References
- R. H. Ritchie, Phys. Rev., 1957, 1, 874–881 CrossRef.
- W. L. Barnes, A. Dereux and T. W. Ebbesen, Nature, 2003, 424, 824–830 CrossRef CAS PubMed.
- N. Zohar, L. Chuntonov and G. Haran, J. Photochem. Photobiol., C, 2014, 21, 26–39 CrossRef CAS.
- J. M. Brockman, B. P. Nelson and R. M. Corn, Annu. Rev. Phys. Chem., 2000, 51, 41–63 CrossRef CAS PubMed.
- J. F. Li, Y. J. Zhang, S. Y. Ding, R. Panneerselvam and Z. Q. Tian, Chem. Rev., 2017, 117, 5002–5069 CAS.
- A. Shiohara, Y. Wang and L. M. Liz-Marzán, J. Photochem. Photobiol., C, 2014, 21, 2–25 CrossRef CAS.
- E. Bailo and V. Deckert, Chem. Soc. Rev., 2008, 37, 921–930 RSC.
- A. Campion and P. Kambhampati, Chem. Soc. Rev., 1998, 27, 241–250 RSC.
- B. Dong, Y. Fang, L. Xia, H. Xu and M. Sun, J. Raman Spectrosc., 2011, 42, 1205–1206 CrossRef CAS.
- M. Sun, Y. Hou and H. Xu, Nanoscale, 2011, 3, 4114–4116 RSC.
- Y. F. Huang, D. Y. Wu, H. P. Zhu, L. B. Zhao, G. K. Liu, B. Ren and Z. Q. Tian, Phys. Chem. Chem. Phys., 2012, 14, 8485–8497 RSC.
- M. Sun, Y. Huang, L. Xia, X. Chen and H. Xu, J. Phys. Chem. C, 2011, 115, 9629–9636 CAS.
- X. J. Chen, G. Cabello, D. Y. Wu and Z. Q. Tian, J. Photochem. Photobiol., C, 2014, 21, 54–80 CrossRef CAS.
- Y. F. Huang, M. Zhang, L. B. Zhao, J. M. Feng, D. Y. Wu, B. Ren and Z. Q. Tian, Angew. Chem., Int. Ed., 2014, 53, 2353–2357 CrossRef CAS PubMed.
- W. Knight, H. Sobhani, P. Nordlander and N. J. Halas, Science, 2011, 332, 702–704 CrossRef PubMed.
- I. Goykhman, B. Desiatov, J. Khurgin, J. Shappir and U. Levy, Nano Lett., 2011, 11, 2219–2224 CrossRef CAS PubMed.
- A. O. Govorov, H. Zhang and Y. K. Gun'Ko, J. Mech. Eng. Autom., 2013, 117, 16616–16631 CAS.
- W. Xie, B. Walkenfort and S. Schlucker, J. Am. Chem. Soc., 2013, 135, 1657 CrossRef CAS PubMed.
- Z. Zhang, T. Deckert-Gaudig, P. Singh and V. Deckert, Chem. Commun., 2015, 51, 3069–3072 RSC.
- A. M. Gabudean, D. Biro and S. Astilean, J. Mol. Struct., 2011, 993, 420–424 CrossRef CAS.
- P. Xu, L. Kang, N. H. Mack, K. S. Schanze, X. Han and H. L. Wang, Sci. Rep., 2013, 3, 2997 CrossRef PubMed.
- Y. F. Huang, D. Y. Wu, H. P. Zhu, L. B. Zhao, G. K. Liu, B. Ren and Z. Q. Tian, Phys. Chem. Chem. Phys., 2012, 14, 8485–8497 RSC.
- K. N. Heck, B. G. Janesko, G. E. Scuseria, N. J. Halas and M. S. Wong, J. Am. Chem. Soc., 2009, 130, 16592–16600 CrossRef PubMed.
- Z. Zhang, L. Chen, M. Sun, P. Ruan, H. Zheng and H. Xu, Nanoscale, 2013, 5, 3249–3252 RSC.
- J. Lee, S. Mubeen, X. Ji, G. D. Stucky and M. Moskovits, Nano Lett., 2012, 12, 5014–5019 CrossRef CAS PubMed.
- S. Mukherjee, F. Libisch, O. Neumann, L. V. Brown, J. Cheng, J. B. Lassiter, E. A. Carter, P. Nordlander and N. J. Halas, Nano Lett., 2017, 13, 240–247 CrossRef PubMed.
- Y. F. Huang, H. P. Zhu, G. K. Liu, D. Y. Wu, B. Ren and Z. Q. Tian, J. Am. Chem. Soc., 2010, 132, 9244–9246 CrossRef CAS PubMed.
- Y. Fang, Y. Li, H. Xu and M. Sun, Langmuir, 2010, 26, 7737–7746 CrossRef CAS PubMed.
- L. Yang, L. Ma, G. Chen, J. Liu and Z. Q. Tian, Chem.–Eur. J., 2010, 16, 12683–12693 CrossRef CAS PubMed.
- K. Ikeda, S. Suzuki and K. Uosaki, Nano Lett., 2011, 11, 1716–1722 CrossRef CAS PubMed.
- C. Farcau and S. Astilean, Chem. Commun., 2011, 47, 3861–3863 RSC.
- D. R. Ward, N. J. Halas, J. W. Ciszek, J. M. Tour, Y. Wu, P. Nordlander and D. Natelson, Nano Lett., 2008, 8, 919–924 CrossRef CAS PubMed.
- M. Osawa, N. Matsuda, K. Yoshii and I. Uchida, J. Phys. Chem., 1994, 98, 12702–12707 CrossRef CAS.
- W. Ji, N. Spegazzini, Y. Kitahama, Y. Chen, B. Zhao and Y. Ozaki, J. Phys. Chem. Lett., 2012, 3, 3204–3209 CrossRef CAS PubMed.
- L. B. Zhao, M. Zhang, Y. F. Huang, C. T. Williams, D. Y. Wu, B. Ren and Z. Q. Tian, J. Phys. Chem. Lett., 2014, 5, 1259–1266 CrossRef CAS PubMed.
- P. Xu, L. Kang, N. H. Mack, K. S. Schanze, X. Han and H. L. Wang, Sci. Rep., 2013, 3, 2997 CrossRef PubMed.
- Y. Fang, Z. Li, Y. Huang, S. Zhang, P. Nordlander, N. J. Halas and H. Xu, Nano Lett., 2010, 10, 1950–1954 CrossRef CAS PubMed.
- S. J. Lee and M. Moskovits, J. Am. Chem. Soc., 2012, 134, 11384–11387 CrossRef CAS PubMed.
- S. Mubeen, J. Lee, N. Singh, S. Krämer, G. D. Stucky and M. Moskovits, Nat. Nanotechnol., 2013, 8, 247–251 CrossRef CAS PubMed.
- J. Lee, S. Mubeen, X. Ji, G. D. Stucky and M. Moskovits, Nano Lett., 2012, 12, 5014–5019 CrossRef CAS PubMed.
- S. Mubeen, G. Hernandezsosa, D. Moses, J. Lee and M. Moskovits, Nano Lett., 2011, 11, 5548–5552 CrossRef CAS PubMed.
- D. Y. Wu, L. B. Zhao, X. M. Liu, R. Huang, Y. F. Huang, B. Ren and Z. Q. Tian, Chem. Commun., 2011, 47, 2520–2522 RSC.
- H. Wang, T. Liu, Y. Huang, Y. Fang, R. Liu, S. Wang, W. Wen and M. Sun, Sci. Rep., 2013, 4, 7087 CrossRef PubMed.
- V. Canpean, M. Iosin and S. Astilean, Chem. Phys. Lett., 2010, 500, 277–282 CrossRef CAS.
- Z. Zhang, S. Sheng, H. Zheng, H. Xu and M. Sun, Nanoscale, 2014, 6, 4903–4908 RSC.
- M. Sun, Z. Zhang, P. Wang, Q. Li, F. Ma and H. Xu, Light: Sci. Appl., 2013, 2, e112 CrossRef CAS.
- A. M. Gabudean, D. Biro and S. Astilean, J. Mol. Struct., 2011, 993, 420–424 CrossRef CAS.
- J. Steidtner and B. Pettinger, Rev. Sci. Instrum., 2007, 78, 103104 CrossRef PubMed.
- M. Sun, Z. Zhang, L. Chen, S. Sheng and H. Xu, Adv. Opt. Mater., 2014, 2, 74–80 CrossRef.
- E. Bailo and V. Deckert, Chem. Soc. Rev., 2008, 37, 921–930 RSC.
- J. Stadler, T. Schmid and R. Zenobi, Nanoscale, 2012, 4, 1856–1870 RSC.
- Z. Zhang, M. Sun, P. Ruan, H. Zheng and H. Xu, Nanoscale, 2013, 5, 4151–4155 RSC.
- E. M. V. S. Lantman, T. Deckertgaudig, A. J. G. Mank, V. Deckert and B. M. Weckhuysen, Nat. Nanotechnol., 2012, 7, 583–586 CrossRef PubMed.
- M. Sun, Y. Fang, Z. Zhang and H. Xu, Phys. Rev. E: Stat., Nonlinear, Soft Matter Phys., 2013, 87, 020401 CrossRef PubMed.
- Y. Huang, Y. Fang, Z. Yang and M. Sun, J. Phys. Chem. C, 2010, 114, 18263–18269 CAS.
- E. M. V. S. Lantman, T. Deckertgaudig, A. J. G. Mank, V. Deckert and B. M. Weckhuysen, Nat. Nanotechnol., 2012, 7, 583–586 CrossRef PubMed.
- A. Merlen, M. Chaigneau and S. Coussan, Phys. Chem. Chem. Phys., 2015, 17, 19134–19138 RSC.
- M. Sun, Z. Zhang, Z. H. Kim, H. Zheng and H. Xu, Chem.–Eur. J., 2013, 19, 14958–14962 CrossRef CAS PubMed.
- Z. Dai, X. Xiao, W. Wu, Y. Zhang, L. Liao, S. Guo, J. Ying, C. Shan, M. Sun and C. Jiang, Light: Sci. Appl., 2015, 4, e342 CrossRef CAS.
- X. Liang, T. You, D. Liu, X. Lang, E. Tan, J. Shi, P. Yin and L. Guo, Phys. Chem. Chem. Phys., 2015, 17, 10176–10181 RSC.
- J. Li, C. Y. Liu and Y. Liu, J. Mater. Chem., 2012, 22, 8426–8430 RSC.
- H. Y. Wu, Y. H. Lai, M. S. Hsieh, S. D. Lin, Y. C. Li and T. W. Lin, Adv. Mater. Interfaces, 2015, 1, 1400119 CrossRef.
- J. Fan, Z. Shi, Y. Ge, J. Wang, Y. Wang and J. Yin, J. Mater. Chem., 2012, 22, 13764–13772 RSC.
- S. Myung, P. T. Yin, C. Kim, J. Park, A. Solanki, P. I. Reyes, Y. Lu, K. S. Kim and K. B. Lee, Adv. Mater., 2012, 24, 6081–6087 CrossRef CAS PubMed.
- S. Bai, J. Ge, L. Wang, M. Gong, M. Deng, Q. Kong, L. Song, J. Jiang, Q. Zhang and Y. Luo, Adv. Mater., 2014, 26, 5689–5695 CrossRef CAS PubMed.
- M. Losurdo, I. Bergmair, B. Dastmalchi, T. H. Kim, M. M. Giangregroio, W. Jiao, G. V. Bianco, A. S. Brown, K. Hingerl and G. Bruno, Adv. Funct. Mater., 2014, 24, 1864–1878 CrossRef CAS.
- K. Balasubramanian, L. Zuccaro and K. Kern, Adv. Funct. Mater., 2014, 24, 6348–6358 CrossRef CAS.
- J. Zhao, M. Sun, Z. Liu, B. Quan, C. Gu and J. Li, Sci. Rep., 2015, 5, 16019 CrossRef CAS PubMed.
- B. Dong, Y. Fang, X. Chen, H. Xu and M. Sun, Langmuir, 2011, 27, 10677–10682 CrossRef CAS PubMed.
- X. Tang, W. Cai, L. Yang and J. Liu, Nanoscale, 2014, 6, 8612–8616 RSC.
- L. Kang, X. Han, J. Chu, J. Xiong, X. He, H. L. Wang and P. Xu, ChemCatChem, 2015, 7, 1004–1010 CrossRef CAS.
- S. L. Van, E. M. P. De Peinder, A. J. G. Mank and B. M. Weckhuysen, ChemPhysChem, 2015, 16, 547–554 CrossRef PubMed.
- L. Kang, P. Xu, B. Zhang, H. Tsai, X. Han and H. L. Wang, Chem. Commun., 2013, 49, 3389–3391 RSC.
- E. M. Van Schrojenstein Lantman, O. L. J. Gijzeman, A. J. G. Mank and B. M. Weckhuysen, ChemCatChem, 2014, 6, 3342–3346 CrossRef CAS PubMed.
- K. Kim, S. H. Lee, J. Y. Choi and K. S. Shin, J. Phys. Chem. C, 2014, 118, 3359–3365 CAS.
- Z. Fang, Y. Wang, Z. Liu, A. Schlather, P. M. Ajayan, F. H. Koppens, P. Nordlander and N. J. Halas, ACS Nano, 2012, 6, 10222–10228 CrossRef CAS PubMed.
- Z. Zhang, Y. Fang, W. Wang, L. Chen and M. Sun, Adv. Sci., 2016, 3, 1500215 CrossRef PubMed.
- P. Song, Y. Li, Y. Li, M. Zhao, L. Liu and M. Sun, Plasmonics, 2013, 8, 249–254 CrossRef CAS.
- A. Dasgupta, D. Singh and G. V. Pavan Kumar, Appl. Phys. Lett., 2013, 103, 189–193 Search PubMed.
- Z. Zhang, P. Xu, X. Yang, W. Liang and M. Sun, J. Photochem. Photobiol., C, 2016, 27, 100–112 CrossRef CAS.
- L. Cui, P. Wang, X. Chen, Y. Fang, Z. Zhang and M. Sun, Sci. Rep., 2014, 4, 7221 CrossRef CAS PubMed.
- L. Cui, P. Wang, Y. Li and M. Sun, Sci. Rep., 2016, 6, 20458 CrossRef CAS PubMed.
- Z. Zhang, T. Deckert-Gaudig, P. Singh and V. Deckert, Chem. Commun., 2015, 51, 3069–3072 RSC.
- X. Zhang, P. Wang, Z. Zhang, Y. Fang and M. Sun, Sci. Rep., 2014, 4, 5407 CrossRef CAS PubMed.
- M. Sun, Z. Zhang, H. Zheng and H. Xu, Sci. Rep., 2012, 2, 647 Search PubMed.
- Z. Zhang, S. Sheng, R. Wang and M. Sun, Anal. Chem., 2016, 88, 9328–9346 CrossRef CAS PubMed.
- Y. R. Fang, Z. L. Zhang and M. T. Sun, Rev. Sci. Instrum., 2016, 87, 033104 CrossRef PubMed.
- M. L. Sun, Z. L. Zhang, L. Chen, Q. Li, S. X. Sheng, H. X. Xu and P. Song, Adv. Mater. Interfaces, 2014, 1, 1300125 CrossRef.
- J. Li, C. Y. Liu and Y. Liu, J. Mater. Chem., 2012, 22, 8426–8430 RSC.
- J. Huang, L. Zhang, B. Chen, N. Ji, F. Chen, Y. Zhang and Z. Zhang, Nanoscale, 2010, 2, 2733–2738 RSC.
- M. Sun and H. Xu, Small, 2012, 8, 2777–2786 CrossRef CAS PubMed.
- Z. Zhang, T. Deckert-Gaudig and V. Deckert, Analyst, 2015, 140, 4325–4335 RSC.
- W. Cai, X. Tang, B. Sun and L. Yang, Nanoscale, 2014, 6, 7954–7958 RSC.
- L. Yang, P. Li and J. Liu, RSC Adv., 2014, 4, 49635–49646 RSC.
- J. Wang, R. A. Ando and P. H. C. Camargo, Angew. Chem., 2015, 54, 6909–6912 CrossRef CAS PubMed.
- J. Y. Chu, et al., ChemCatChem, 2016, 8, 1819–1824 CrossRef CAS.
- A. Furube, L. Du, K. Hara, R. Katoh and M. Tachiya, J. Am. Chem. Soc., 2007, 129, 14852–14853 CrossRef CAS PubMed.
- A. Furube, R. Katoh, T. Yoshihara, K. Hara, S. Murata, H. Arakawa and M. Tachiya, J. Phys. Chem. B, 2004, 108, 12583–12592 CrossRef CAS.
- Q. Ding, Y. Shi, M. Chen, H. Li, X. Yang, Y. Qu, W. Liang and M. Sun, Sci. Rep., 2016, 6, 32724 CrossRef CAS PubMed.
- L. Cui, X. Ren, X. Yang, P. Wang, Y. Qu, W. Liang and M. Sun, J. Raman Spectrosc., 2016, 47, 877–883 CrossRef CAS.
- L.-B. Zhao, X.-X. Liu and D.-Y. Wu, J. Phys. Chem. C, 2016, 120, 1570–1579 CAS.
- Q. Q. Ding, M. D. Chen, Y. R. Fang, Z. L. Zhang and M. L. Sun, J. Phys. Chem. C, 2017, 121, 5225–5231 CAS.
- Q. Ding, M. Chen, Y. Li and M. Sun, Sci. Rep., 2015, 5, 10269 CrossRef CAS PubMed.
- C. Lin, P. Wang, Y. Fang, Y. Li and M. Sun, Sci. Rep., 2015, 5, 11920 CrossRef PubMed.
- X. Yang, H. Yu, X. Guo, Q. Ding, T. Pullerits, R. Wang, G. Zhang, W. Liang and M. Sun, Mater. Today Energy, 2017, 5, 72–80 CrossRef.
- P. Wang, W. Liu, W. Lin and M. Sun, J. Raman Spectrosc., 2017, 48 DOI:10.1002/jrs.5199.
Footnote |
| † Contributed equally. |
|
| This journal is © The Royal Society of Chemistry 2017 |
Click here to see how this site uses Cookies. View our privacy policy here. 
 Open Access Article
 This Open Access Article is licensed under a
  *d
*d