DOI:
10.1039/C7RA05260J
(Paper)
RSC Adv., 2017,
7, 28965-28978
Detailed thermodynamic analysis of the activation parameters for the simple hydrolysis of acetic anhydride in the acetonitrile/water cosolvent system†
Received
9th May 2017
, Accepted 25th May 2017
First published on 2nd June 2017
Abstract
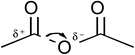
A detailed thermodynamic analysis of the activation parameters for the simple hydrolysis of acetic anhydride in an acetonitrile/water cosolvent system is presented. The activation parameters are obtained using regression analyses of the Eyring rate equation under iso-mole fraction and isodielectric conditions. The iso-mole fraction Eyring plots are linear, indicating the activation enthalpy and entropy are both temperature independent under these conditions. However, the isodielectric Eyring plots are non-linear, and the analysis shows both the activation entropy and activation enthalpy are strongly temperature dependent under isodielectric conditions. The thermodynamic analysis is complemented by linear solvent energy analysis and computational studies of possible transition structures, the latter showing that a concerted six-member ring structure with a single water molecule is the likely transition state.
Introduction
Over the past several decades researchers have conducted extensive work quantifying solvent effects on chemical equilibria, spectroscopic data, and rate processes, and a thorough discussion of this topic is found in Reichardt and Welton's book.1 Perhaps the most widely-used analysis of solvent effects on reaction rates has been multiparametric linear solvent energy relationships (LSER), such as that of Grunwald and Winstein,2,3 and Kamlet and Taft.4–7 The basis of LSER analyses is the parameterization of solvent effects for a suitable reference reaction using a wide range of solvent systems. Solvent effects stem from bulk properties such as relative permittivity, dipole moment, and refractive index, and specific solute–solvent interactions such as polarizability and electron pair donor and acceptor interactions. While the application of LSERs is successful in some systems, it is not so much in others, particularly when analyzing structurally dissimilar systems.1 The variable success of LSERs underscores its inherent empirical nature.8 While this does not detract from the usefulness of LSERs as mechanistic and predictive tools, a more fundamentally based quantitative analysis would serve a powerful complement, and perhaps provide additional information not otherwise tractable with LSER methods.
The most widely-used theory for analyzing reaction rates is the Eyring rate equation, which has proven to be quite adept for analyzing aqueous-phase reaction rate data.9,10 This celebrated theory is based upon the premise of a quasi-equilibrium between the reactant and transition states. The theory has its limitations, particularly in the case of fast reactions, but because of its inherent use of a thermodynamic construct in the form of the activation parameters, it allows for a conventional thermodynamic analysis. To the authors' knowledge an analysis of this kind has not yet been presented in the literature.
Thermodynamic analyses entail analyzing a measurable variable in response to a specified parameter space. A classic example is the response of reaction enthalpies to changes in temperature and pressure. Per the nature of Eyring theory, measuring the response of the activation parameters for a reaction requires that the temperature be part of that parameter space. Any other measurable variable of interest then requires studying the reaction over a suitable range for that variable as well. For studying the effects of a cosolvent system, which is the focus of this work, generating the usual iso-mole fraction Eyring plots is required. But in addition, Eyring plots must be generated in which at least one other measurable solvent parameter is held constant. This type of analysis is certainly not traditional, and requires a more extensive experimental protocol. The benefit of this complementary suite of Eyring analyses is the contributions from the temperature, the mole fraction, and other solvent parameters of interest can be individually analyzed in separate thermodynamic terms.
Because specific solute–solvent interactions cannot be directly measured, bulk properties must instead be chosen in the thermodynamic analysis. The property of choice in this work is the relative permittivity, which often makes a significant contribution to condensed-phase reaction rates, and has received much attention in the literature. Historical work includes a systematic qualitative description by Hughes and Ingold,11–14 and development of various quantitative expressions relating reaction rate constants to the relative permittivity.15–19 For the test reaction, the authors have chosen the simple hydrolysis of acetic anhydride because it has been well characterized,20–23 and has served as a benchmark reaction for certain chemical engineering processes.24 Finally, the authors have chosen the acetonitrile/water cosolvent system for this work. This system is miscible, well characterized, and shows a strong dependence of the relative permittivity on mole fraction.
This work also includes an analysis of the rate data using the LSER equation of Kamlet and Taft,4–7 and results of computational studies of selected transition states. Results of these analyses provide information that complements the thermodynamic analysis.
Theory
Thermodynamic treatment of the Eyring activation parameters
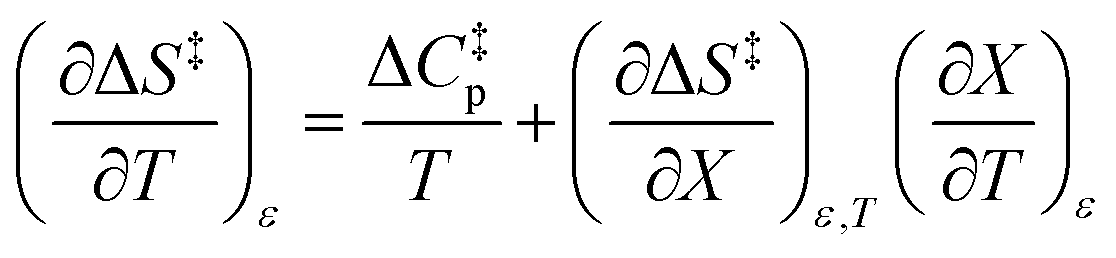
Activation parameters depend upon any variable that affects the energies and entropies of the reactant and transition states. The number of such variables is rather extensive, and individually tracking all of them is experimentally impossible. Among the ones easier to track, and the ones used in this work, are the temperature, cosolvent mole fraction, and relative permittivity. As such, the analysis presented in this article allows the solution relative permittivity to be separately quantified, which is notable since distinguishing bulk medium effects from specific interactive substrate-solvent effects is generally quite difficult.
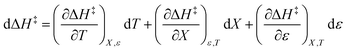
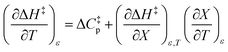
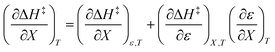
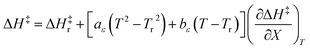
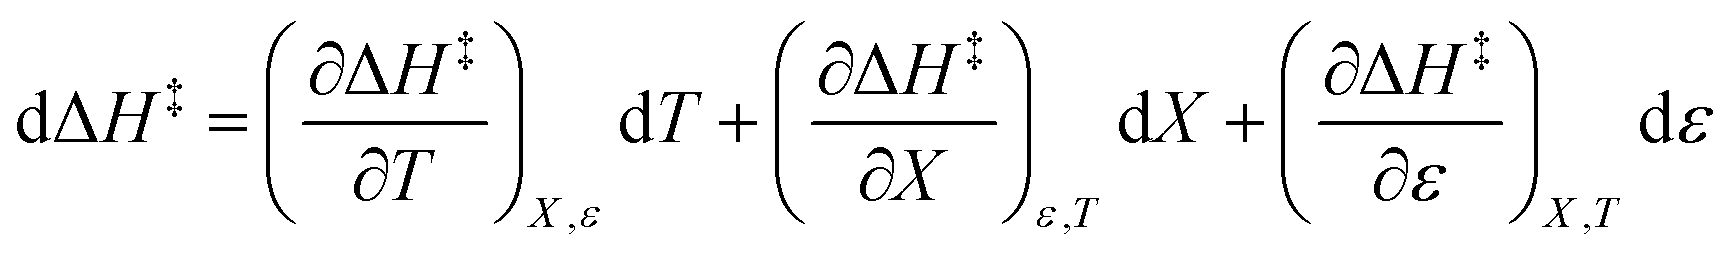
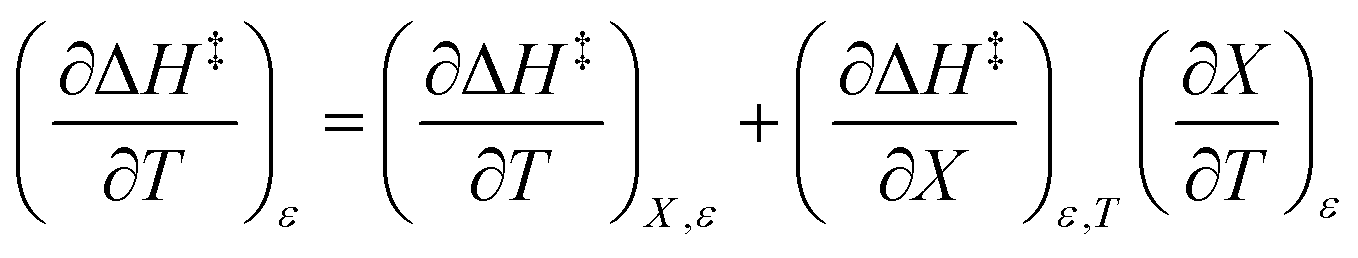
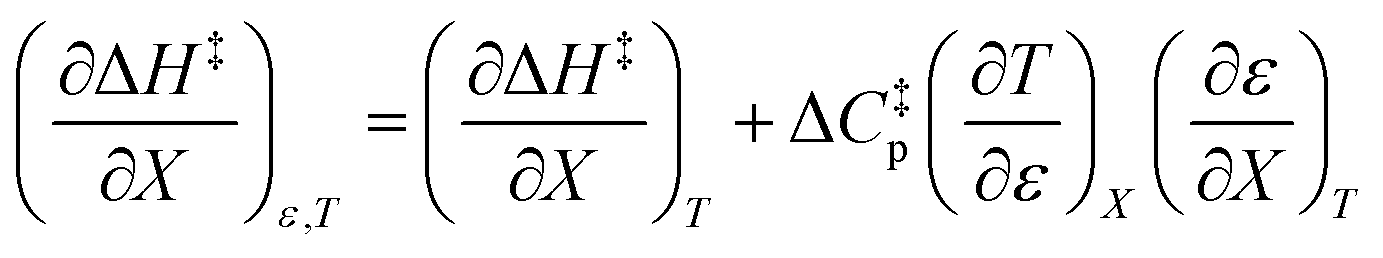
The total differential for the activation enthalpy (ΔH‡) in terms of the temperature (T), the cosolvent mole fraction (X), and the relative permittivity (ε) is:
| |
 | (1) |
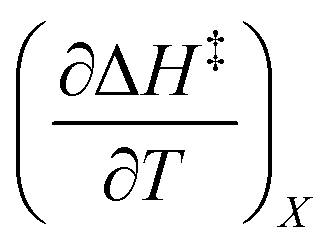
X can be for either component; in this work X is the water mole fraction. Eyring plots require variation in temperature; hence  and
and  are key terms in the analysis. From eqn (1) these terms are:
| |
 | (2) |
| |
 | (3) |
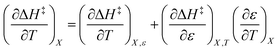
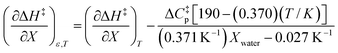
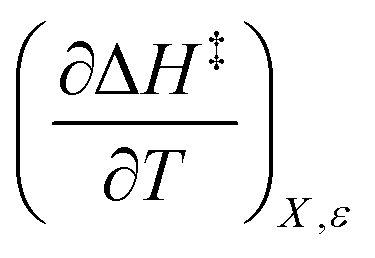
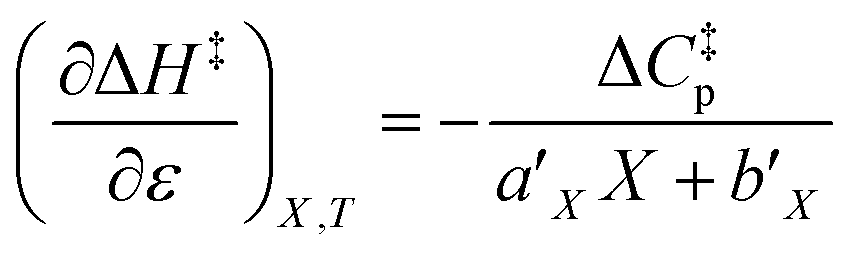
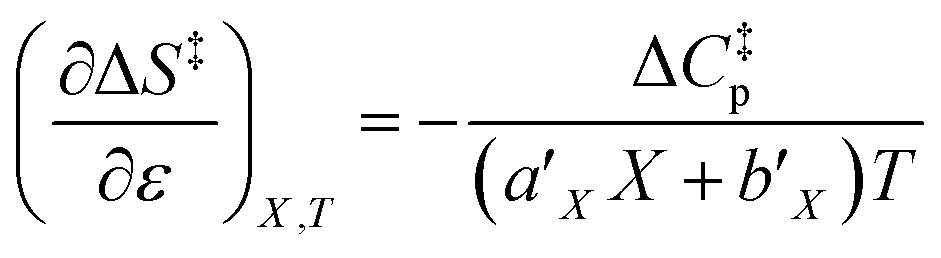
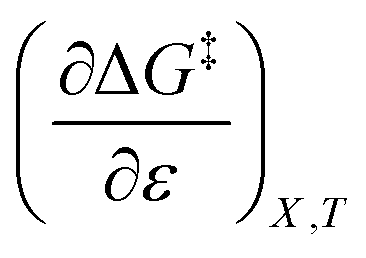
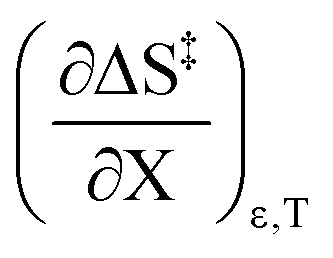
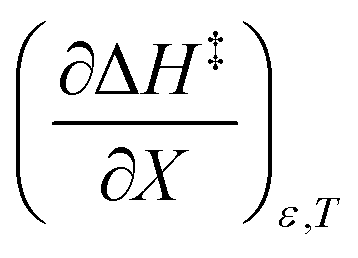
Terms such as  , in which two independent variables are held constant, are hereafter called double constraint differential terms. These terms cannot be directly measured in any single cosolvent system because one independent variable cannot change while the other two are constant. However, they can be functionally related to measurable terms. The values for these double constraint differential terms reveal useful information about the structural and electrostatic nature of the transition state.
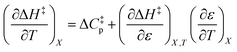
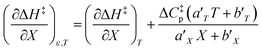
 can be identified as the activation heat capacity (ΔC‡p) under conditions of constant pressure, mole fraction, and relative permittivity. Eqn (2) and (3) therefore become:
| |
 | (4) |
| |
 | (5) |
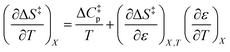
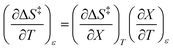
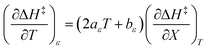
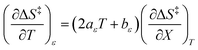
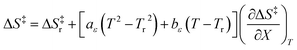
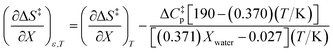
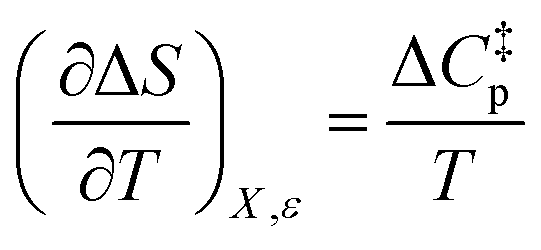
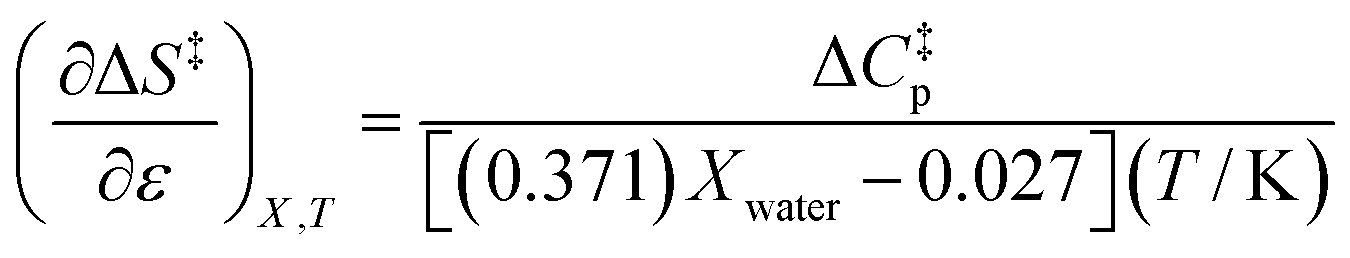
Since 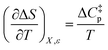 , the companion expressions for the activation entropy are:
| |
 | (6) |
| |
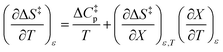 | (7) |
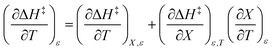
Iso-mole fraction Eyring plots are generally linear, in which case  and
and  are zero. Under these conditions
  and
and  are:
are:
| |
 | (8) |
| |
 | (9) |
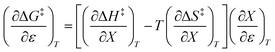
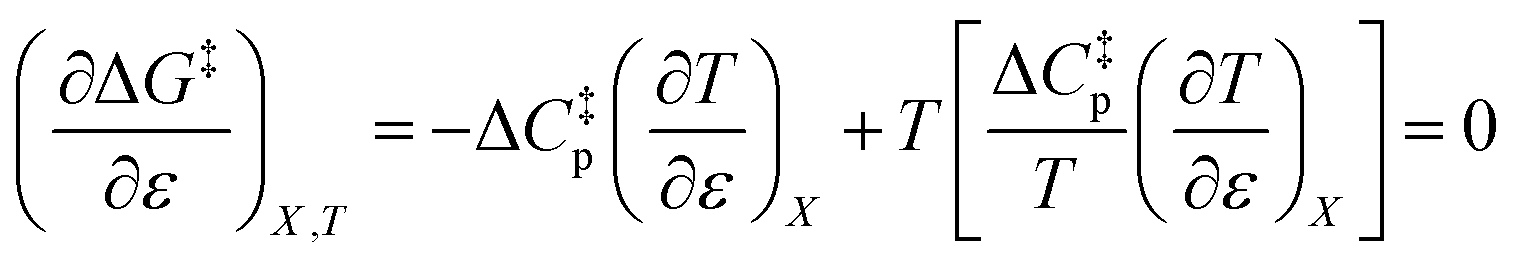
The differential expression for ΔG‡ = ΔH‡ − TΔS‡ under iso-mole fraction and isothermal conditions is:
| |
 | (10) |
Substituting the terms in eqn (8) and (9) into (10) yields:
| |
 | (11) |
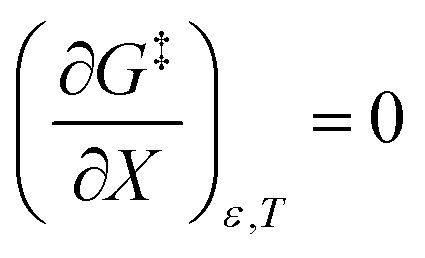
This remarkable result stems from the linearity of the iso-mole fraction Eyring plots, and is entirely general! A similar analysis for linear isodielectric Eyring plots leads to  .
.
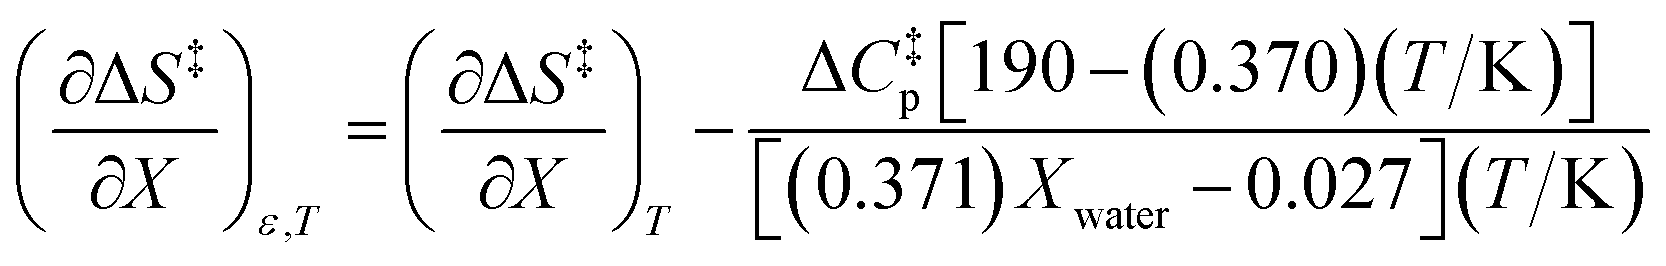
As will be shown, the isodielectric Eyring plots for the reaction system studied in this work are not linear. Whether this is a general trend remains to be determined, as isodielectric Eyring plots are not commonplace in the literature. One explanation for this non-linearity is that either or both terms,  and
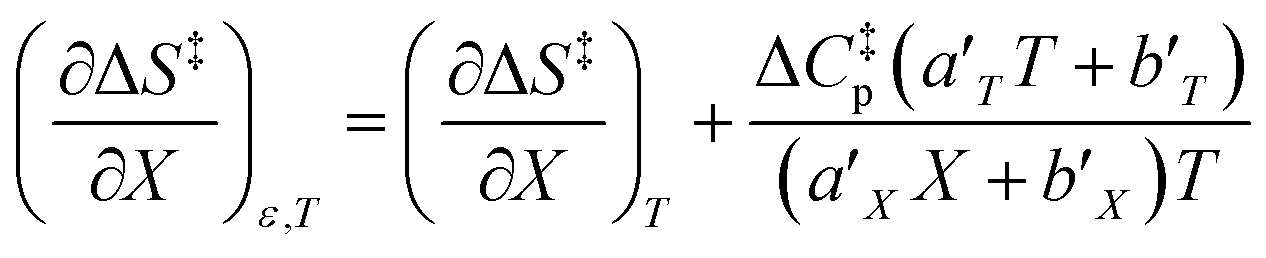
and  , is not zero. However, because of this ambiguity, individual numeric values for these terms cannot be determined from the isodielectric Eyring plots alone. Resolving this ambiguity requires these terms be related to measurable terms from the linear iso-mole fraction plots. The key relationships required for this analysis are derived in the following paragraphs.
Noting that  and
and 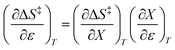 , the expression for
  is:
is:
| |
 | (12) |
As will be shown, the plot of 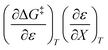 vs. T is linear, hence the slope is
  and the intercept is
  .
.
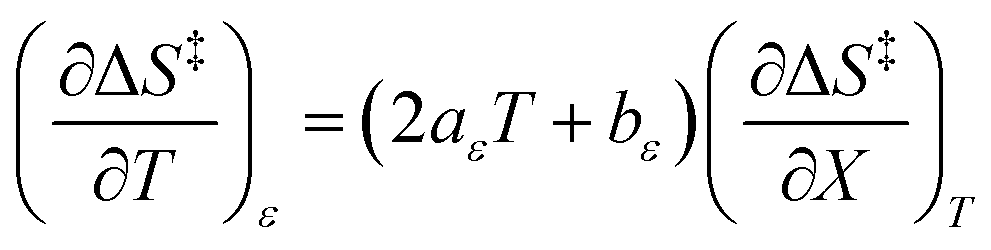
Treating the mole fraction as the independent variable in eqn (1) leads to the following expression:
| |
 | (13) |
Combining eqn (8) and (13) yields:
| |
 | (14) |
Finally, combining eqn (5) and (14) yields:
| |
 | (15) |
Eqn (15) is true provided  . Since
 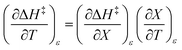 , then it follows that
 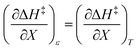 if
if  . The companion expression for
  , which is true if
  , is:
, is:
| |
 | (16) |
Empirical relationships for the cosolvent terms
Expressions for  and
and  can be determined from polynomial regression analyses of experimental data for the cosolvent system. Expressions for
  can then be calculated using the chain rule, or by direct regression analysis of the data using polynomials, as is done in this work. For the thermodynamic analyses, regression polynomials are also required for the rate constants in terms of X for each temperature. The correlation coefficients for the polynomials in this work are generally 0.999 or better, and the “experimentally equivalent” errors in the polynomial fits are presumably comparable to the actual experimental errors.
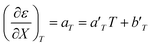
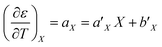
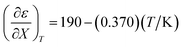
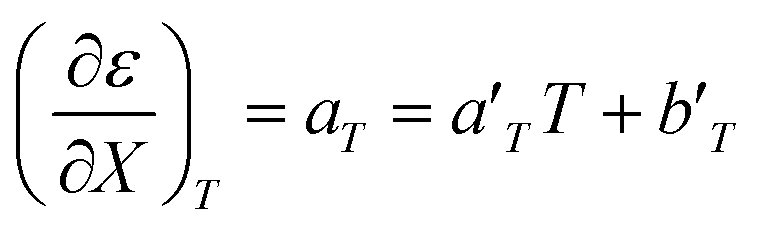
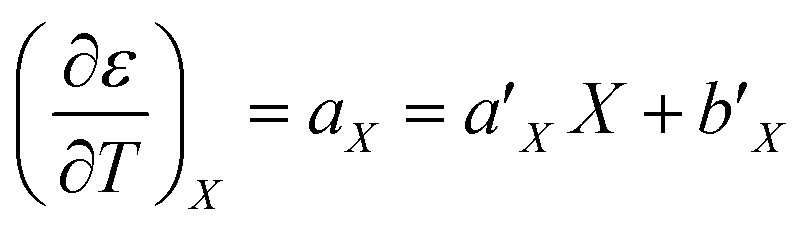
For acetonitrile/water mixtures, linear polynomials are adequate for expressing ε in terms of X and T, but a second-order polynomial is better for expressing X in terms of T. The general expressions where the a's, b's and cε are the polynomial fitting parameters are:
| | |
Xε = aεT2 + bεT + cε
| (19) |
in which the subscript refers to the variable being held constant. In thermodynamics, parameters appearing in equations for which a variable is held constant are generally dependent upon that variable as well. This is the case here, and it is found that
aT and
aX are well represented by linear functions in
T and
X, respectively,
i.e.:
Corresponding expressions for aε and bε are not shown here since they are not necessary for the analysis. From these expressions, the full series of partial derivatives relating ε, T, and X is:
| |
 | (22) |
| |
 | (23) |
| |
 | (24) |
General expressions for the thermodynamic activation terms
Using the polynomials from the previous subsection yields the following general expressions for the double constraint differential terms:| |
 | (25) |
| |
 | (26) |
| |
 | (27) |
| |
 | (28) |
The expressions for  and
and  are:
are:
| |
 | (29) |
| |
 | (30) |
Since the series of iso-mole fraction Eyring plots in this work are linear,  and
and  are independent of T. Therefore, the integrated expressions from eqn (29) and (30) are:
| |
 | (31) |
| |
 | (32) |
in which
Tr is a reference temperature and Δ
H‡r and Δ
S‡r are the values at
Tr.
In addition to temperature-dependent activation parameters, curvature in Eyring plots can be due to several other factors as well. One is the reversible formation of an intermediate. However, in this work this possibility can be summarily ruled out since, as will be shown, the curvature in the isodielectric plots is concave upward. The reversible formation of an intermediate experimentally has been shown to cause a slight downward curvature, and only at temperatures below ∼15 °C for the simple hydrolysis of acetic anhydride.25,26 Another possibility is the effect of the activation heat capacity term. However, it has been the authors' experience that for Eyring plots exhibiting any noticeable curvature, ΔC‡p must be unrealistically large to adequately account for the curvature. This work is no exception, as regression values from the isodielectric plots yield ΔC‡p values on the order of 800 J K−1 mol−1! Another possible explanation is the existence of more than one thermodynamically accessible transition state. The different transition states can either be different in structure with the same molecularity, or have different molecularities. However, computational studies, which are described later, strongly suggest only one accessible transition state exists.
Empirical relationship between the observed rate constant (kobs) and the cosolvent relative permittivity
Assuming a linear dependence of  on ε renders the following expression:in which a and b are empirical parameters. Integrating eqn (33) yields:
| | |
ΔG‡ = ΔG‡1 + (ε − 1)[a + 1/2b(ε + 1)]
| (34) |
in which ΔG‡1 is the activation free energy for ε = 1. Using the Eyring equation, eqn (34) can be recast as:| |
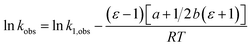 | (35) |
The Eyring model for this work
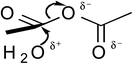
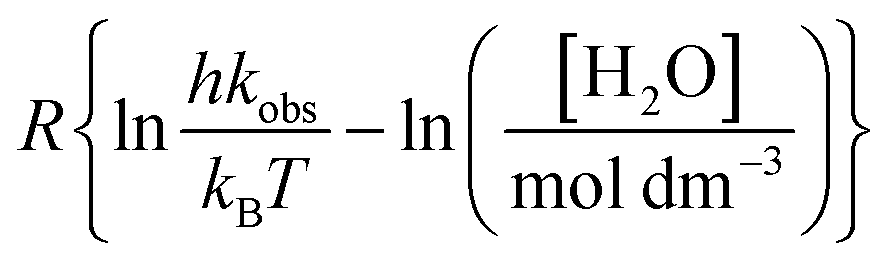
Results of computational studies, discussed in the computational section, clearly show that the transition state contains only one water molecule. Therefore, the observed rate constant, which is pseudo first-order, is:in which k is the second-order Eyring rate constant. The Eyring rate equation can therefore be cast as:| |
 | (37) |
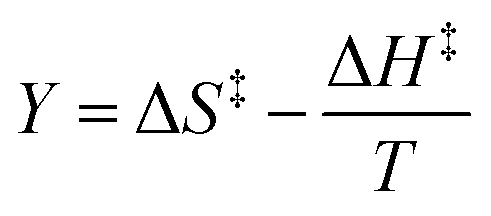
in which Y is  , where kB is Boltzmann's constant and h is Planck's constant. Finally, combining eqn (31), (32), and (37) yields the following expression that is used for the isodielectric Eyring plots generated in this work:
| |
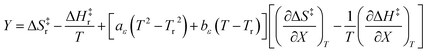 | (38) |
Experimental
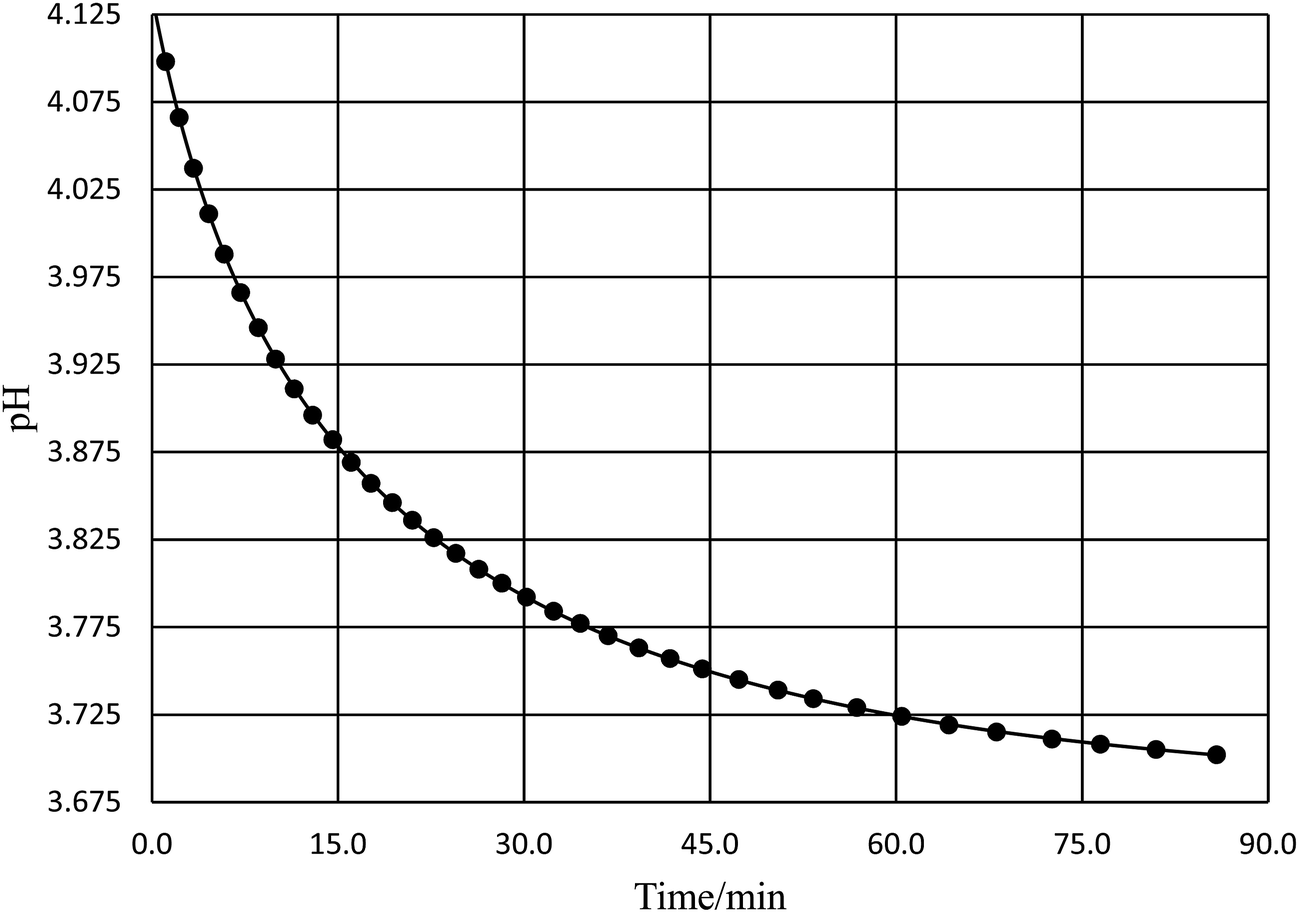
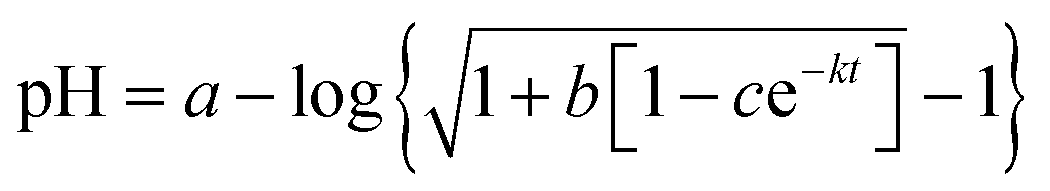
Acetic anhydride (Baker, A.C.S., reagent) and acetonitrile (Fisher Scientific, A.C.S., certified) were used as received. Reaction solutions were prepared solely with deionized water and acetonitrile. Relative permittivity data for the acetonitrile/water solutions was taken from ref. 33. Temperatures were maintained at ±0.01 °C using a water bath and a Thermo Scientific Haake SC 100 water circulator. The water bath was placed on a magnetic stirrer to allow the reaction solutions to be continuously stirred. One drop of acetic anhydride was used per ∼20 mL of solution. The pH technique was used25,26 for acquiring the rate data. For most of the studies the reaction time and the pH were monitored manually. The pH was measured using an Accumet Model 15 pH meter set to read to 0.001 pH unit, and equipped with a Thermo Scientific Orion Ross electrode. The electrode was periodically calibrated using buffer solutions at pH 5.00 and 3.00. The initial pH for the reaction solutions was between 4.0 and 5.0, and the pH ranged from 0.15 to 0.4 pH unit during the course of the reactions. The reactions were monitored at least 2.5 half lives, and each data point was at least triplicate (generally more). Rate constants were measured at 15.0, 20.0, 25.0, 30.0, 35.0, 40.0, 45.0, 50.0, and 55.0 °C for water mole fractions ranging from 0.790 to 1.000. The raw pH-time data was fitted using non-linear regression analysis with the standard non-buffer pH rate expression.26 A typical pH rate curve is shown in Fig. 1. Fifteen to forty data points were taken for each trial, depending upon the half-life, and correlation coefficients ranged from 0.9999 for the faster reactions to 0.99999 or better for the slower reactions.
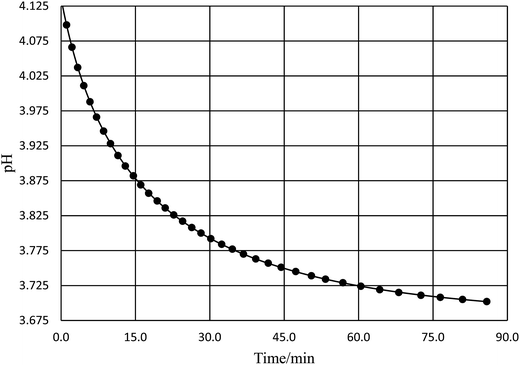 |
| | Fig. 1 A typical plot of pH vs. time for the simple hydrolysis of acetic anhydride. This plot is for the acetonitrile/water system at 36.0 °C and a water mole fraction of 0.8346. The non-linear regression analysis uses the non-buffer version of the pH rate equation, which is,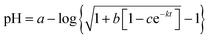 ,25,26 where a, b, c, and k (the rate constant) are the fitting parameters. The analysis result yields k = 0.02676 (±0.00004) min−1 and a correlation coefficient of 0.999997. ,25,26 where a, b, c, and k (the rate constant) are the fitting parameters. The analysis result yields k = 0.02676 (±0.00004) min−1 and a correlation coefficient of 0.999997. | |
Computational results
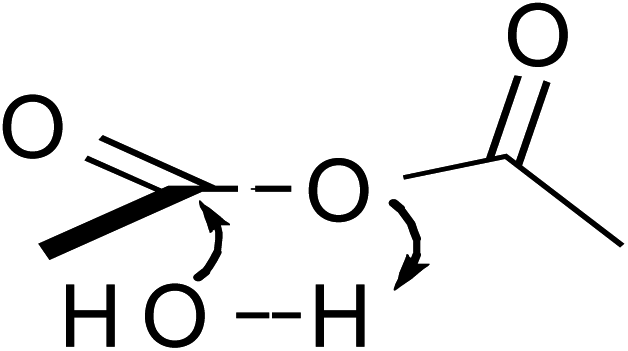
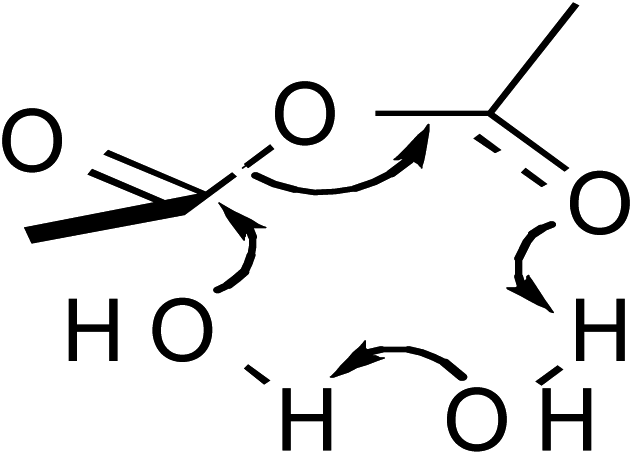
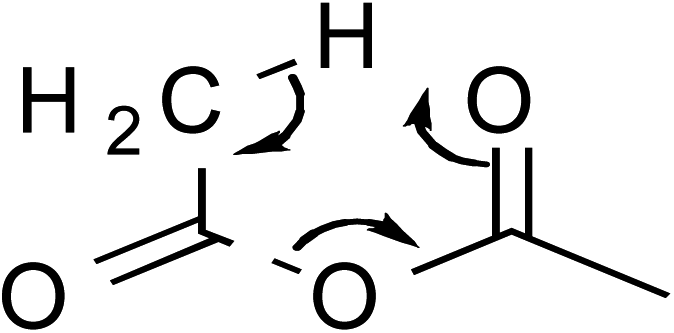
The quantum mechanical computations were conducted using a Spartan Parallel Version27 on a 3.2 GHz dual quad-core MacPro with an SSD drive and 24 GB physical RAM, which was run with a MacOS 10.6.8 booted into the 64-bit kernel. Diligent geometry searches located transition structures A to E as shown in Table 1. These structures possessed a single imaginary frequency.
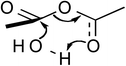
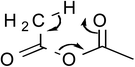
Table 1 Computational results for various transition states (TS) for simple acetic anhydride hydrolysis. See the text for a discussion of the computational methods. The activation free energies are calculated for 25 °C. TS A convergence required use of the SM8 model in the optimization
| TS code |
TS structure |
μ/D (aqueous) |
Products |
ΔH‡/kJ mol−1 |
ΔS‡/J K−1 mol−1 |
ΔG‡/kJ mol−1 |
| A |
 |
14.4 |
CH3CO2− |
97.3 |
−142.3 |
139.7 |
| CH3CO2H2+ |
| B |
 |
1.6 |
2CH3CO2H |
39.9 |
−156.6 |
86.6 |
| C |
 |
8.5 |
2CH3CO2H |
108.6 |
−149.8 |
153.3 |
| D |
 |
4.0 |
2CH3CO2H |
19.8 |
−307.9 |
111.6 |
| H2O |
| E |
 |
5.1 |
CH3CO2H |
146.1 |
3.6 |
145.0 |
| CH2CO |
| F |
 |
— |
CH3CO2− |
— |
— |
191.4 |
| CH3CO+ |
Possible transition states were investigated in vacuo using a variety of methods and basis sets. However, RB3LYP/6-31G* was systematically used to more thoroughly investigate the transition states. This combination of method and basis set generally yields the smallest average deviation from experimental values.28 For instance, the computational value of 63.1 kJ mol−1 for the enthalpy of acetic anhydride hydrolysis obtained with RB3LYP/6-31G* agrees quite well with the literature value of 58.5 kJ mol−1. For this reason, only the computational results from the RB3LYP/6-31G* analyses are shown in Table 1. Nonetheless, other combinations of methods and basis sets consistently show structure B to be have the lowest activation free energy.
Optimizations were also conducted with the SM8 model29 in water, dimethyl sulfoxide, and acetonitrile. Activation parameters were calculated using the optimized reactant and transition states for structures A to E. An upper bound for the activation free energy for structure F was estimated based upon CCSD(T)/cc-pVTZ and G3 energies for the acetyl cation and acetate anion.
Absolute values for the energies of the individual species vary somewhat due to non-compliance with the hyperhomodesmotic criteria.30 However, the activation parameters are calculated from the energy difference between the reaction and transition states, and are expected to have much smaller computational errors.
These computational results clearly support a concerted, one-water molecule transition state, which is contrary to conventional thought that at least two water molecules are structurally involved in the transition state.31,32 Computational results suggest that the entropic cost is too great for the meager energy payoff of adding additional water molecules in the transition state.
Analysis results
Numeric expressions for the thermodynamic terms
Fig. 2 shows the kinetic rate constants plotted as −log(kobs) vs. Xwater. The isothermal, isodielectric, and iso-mole fraction lines are color coded. The rate constants along the iso-mole fraction lines have been analyzed using eqn (37), and the plots are shown in Fig. 3. The iso-mole fraction Eyring plots are all linear, indicating that  and
and  are zero. Table 2 shows the activation enthalpy and entropy from the regression analyses, and the values for the activation free energies at 25 °C.
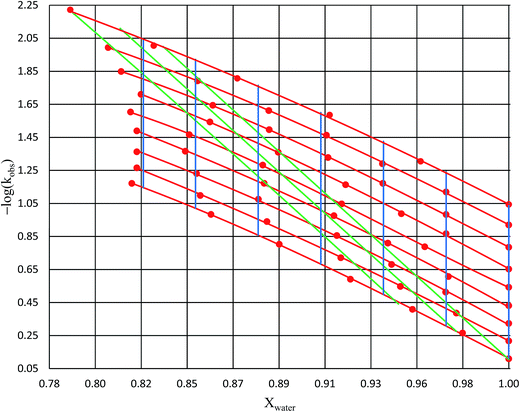 |
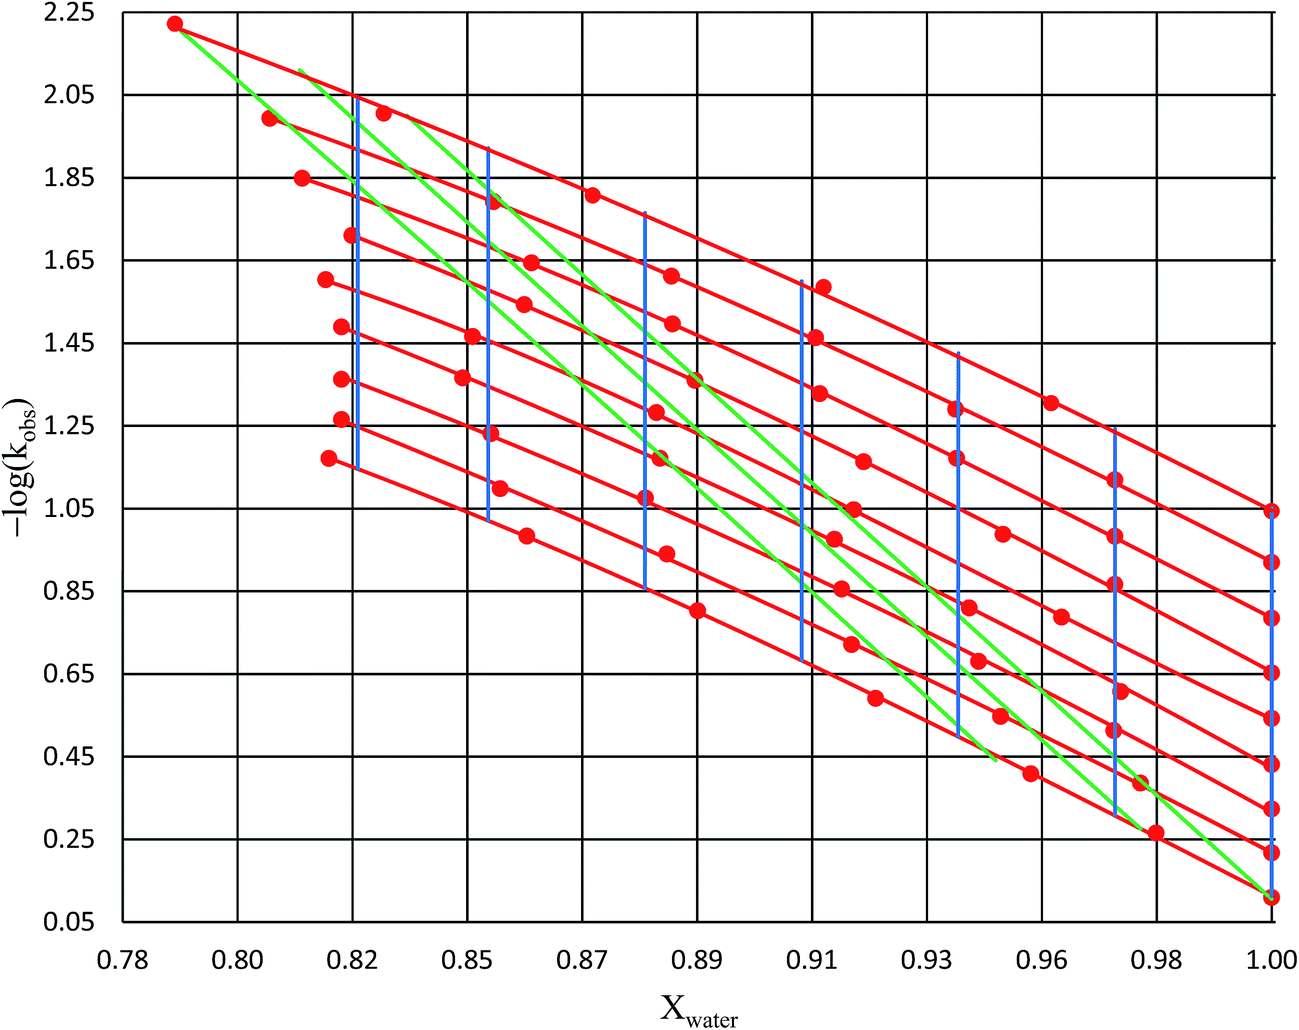
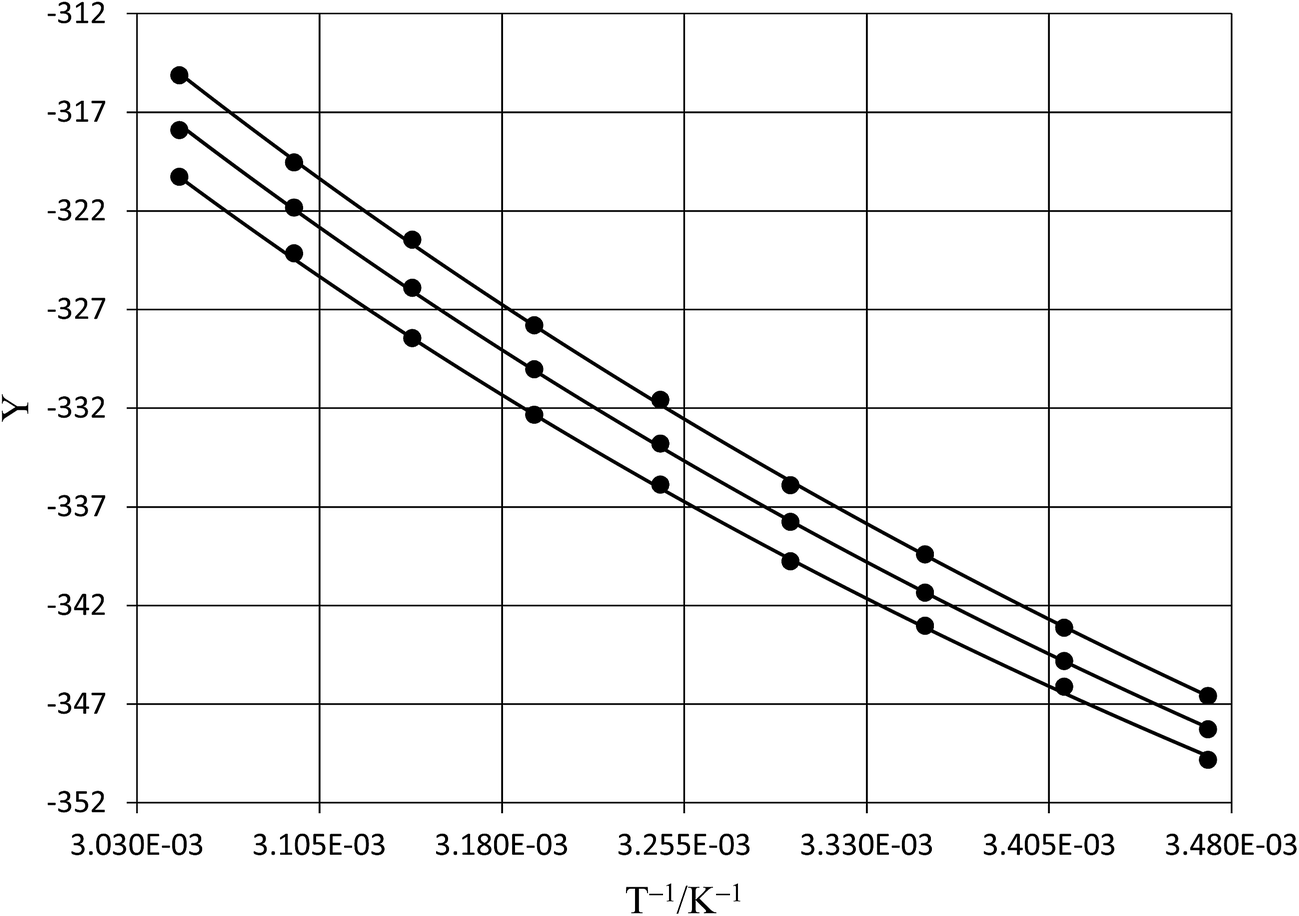
| | Fig. 2 Plots of −log(kobs) vs. Xwater for acetic anhydride hydrolysis in the acetonitrile/water cosolvent system. The solid red circles are the observed rate constants in min−1. The red lines represent isotherms (from top to bottom: 15.0 °C, 20.0 °C, 25.0 °C, 30.0 °C, 35.0 °C, 40.0 °C, 45.0 °C, 50.0 °C, and 55.0 °C); the green lines represent isodielectric lines (from right to left: 68.33, 66.62, and 64.72); and the blue lines represent iso-mole fraction lines (from right to left: 1.000, 0.970, 0.940, 0.910, 0.880, 0.850, and 0.825). All points are at least triplicate (generally more), and the average percent error on the standard deviations is 1.7%. | |
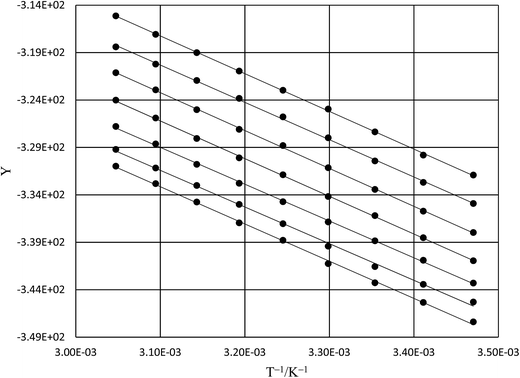 |
| | Fig. 3 Iso-mole fraction Eyring plots and the regression analyses using eqn (37). The water mole fractions from top to bottom are: 1.000, 0.970, 0.940, 0.910, 0.880, 0.850, and 0.825. The points for mole fraction 1.000 are measured data; all other points are calculated from regression polynomials. The correlation coefficients range from 0.9990 to 0.9999. | |
Table 2 Activation parameters from the linear regression analyses under iso-mole fraction conditions using eqn (37). Errors are shown in parentheses. The activation free energies are calculated for 25.0 °C
| Xwater |
ΔH‡/kJ mol−1 |
ΔS‡/J K−1 mol−1 |
ΔG‡/kJ mol−1 |
| 1.000 |
39.80 (±0.25) |
−193.9 (±0.8) |
97.6 (±0.8) |
| 0.970 |
38.39 (±0.39) |
−198.2 (±1.3) |
97.5 (±1.4) |
| 0.940 |
40.03 (±0.29) |
−199.1 (±0.9) |
99.4 (±0.9) |
| 0.910 |
39.80 (±0.33) |
−202.9 (±1.1) |
100 (±1) |
| 0.880 |
38.86 (±0.40) |
−208.5 (±1.3) |
101 (±1) |
| 0.850 |
38.66 (±0.61) |
−211.6 (±2.0) |
102 (±2) |
| 0.825 |
38.23 (±0.50) |
−211.5 (±1.6) |
101 (±2) |
The experimental data for the acetonitrile/water system presented in ref. 33 has been fitted using eqn (17), and numeric results for the parameters are shown in Table 3. A linear fit using these values yields the following expression for  :
:
| |
 | (39) |
Table 3 Values for  for the acetonitrile/water system at various water mole fractions. The relative permittivity range is 53.08 to 80.16, and the temperature range is 15.0 to 55.0 °C. The data used for the analyses is from ref. 33
| Xwater |

/K−1 |
| 1.0000 |
−0.342 |
| 0.9535 |
−0.330 |
| 0.9012 |
−0.307 |
| 0.8420 |
−0.286 |
| 0.7740 |
−0.260 |
Using eqn (25), (26), and (39), the expressions for  and
and  are:
are:
| |
 | (40) |
| |
 | (41) |
Eqn (40) and (41) apply in the ranges 0.790 ≤ Xwater ≤ 1.000 and 15.0 ≤ T ≤ 55.0 °C.
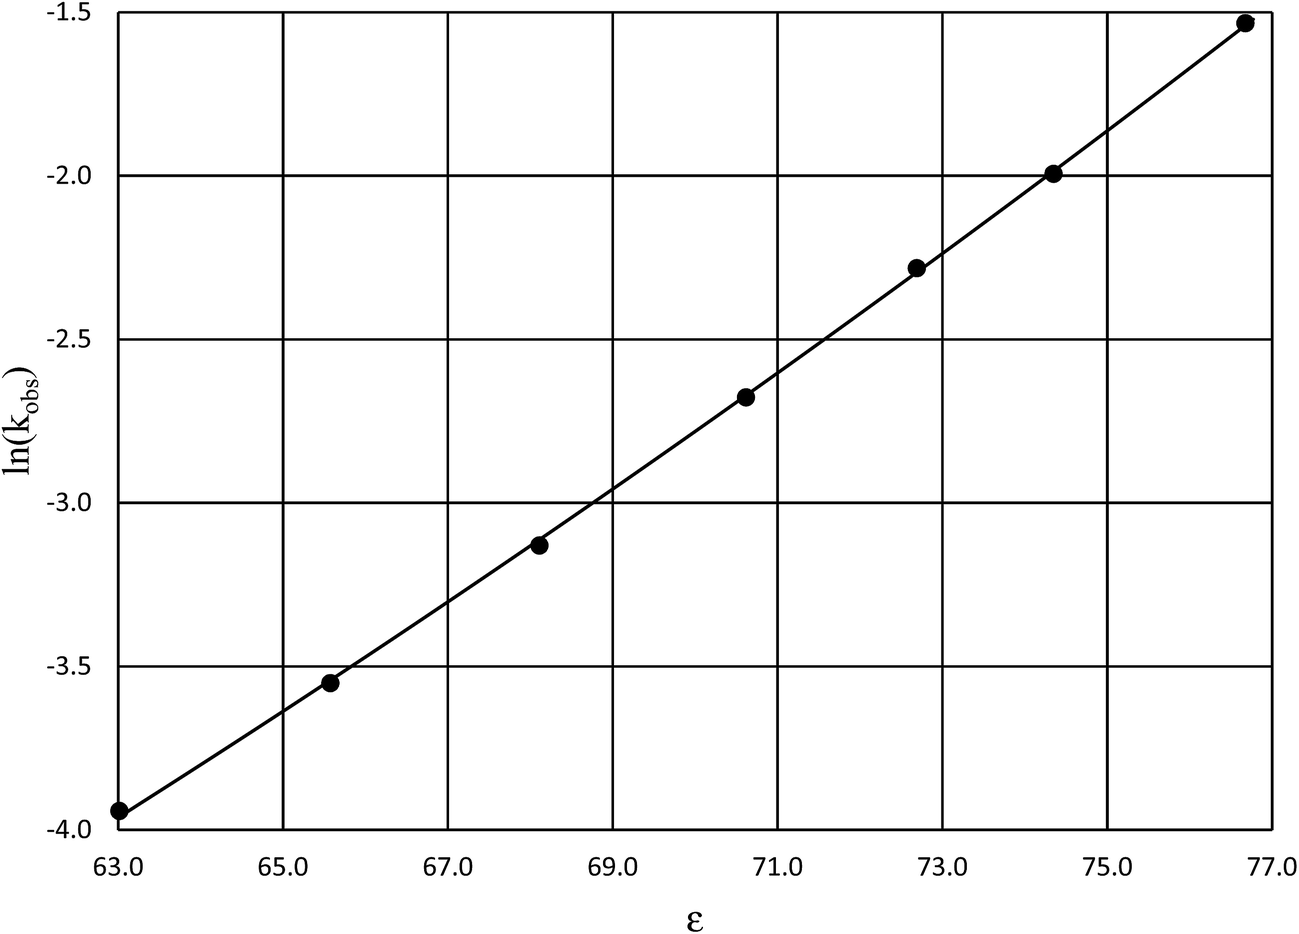
Fig. 4 shows a typical plot of ln(kobs) vs. ε. The non-linear regression analysis uses eqn (35) with a = 0. Table 4 shows values for  and b, and the applicable relative permittivity range at each temperature. A linear fit of
  vs. T yields:
| |
 | (42) |
 |
| | Fig. 4 Plot of ln(kobs) vs. ε for acetic anhydride hydrolysis in the acetonitrile/water cosolvent system at 30.0 °C. The non-linear regression curve is generated using eqn (35) with a = 0. The water mole fraction range for the data presented here is 0.824 to 1.000, and the regression correlation coefficient is 0.9999. | |
Table 4 Values for  , b (from the non-linear regression analysis of eqn (35) with a = 0), and the applicable relative permittivity ranges at various temperatures for acetic anhydride hydrolysis in the acetonitrile/water system. The data used to analyze the values for
  is in ref. 33
| T/°C |

|
−103 b/kJ mol−1 |
Relative permittivity range |
| 15.0 |
83.5 (±1.6) |
5.01 (±0.07) |
64.6–81.2 |
| 20.0 |
81.4 (±1.4) |
5.34 (±0.07) |
64.7–80.3 |
| 25.0 |
79.5 (±1.0) |
5.82 (±0.08) |
63.6–78.4 |
| 30.0 |
77.6 (±1.4) |
6.39 (±0.04) |
63.0–76.7 |
| 35.0 |
75.0 (±1.1) |
6.85 (±0.09) |
61.3–74.9 |
| 40.0 |
73.6 (±1.5) |
7.28 (±0.10) |
60.1–73.2 |
| 45.0 |
72.2 (±1.3) |
7.65 (±0.11) |
58.7–71.6 |
| 50.0 |
70.6 (±1.0) |
8.03 (±0.09) |
57.4–70.0 |
| 55.0 |
68.3 (±1.3) |
8.73 (±0.08) |
56.0–68.3 |
Using eqn (27), (28), (39), and (42), the expressions for  and
and  become:
| |
 | (43) |
| |
 | (44) |
Eqn (43) and (44) apply in the ranges 0.790 ≤ Xwater ≤ 1.000 and 15.0 ≤ T ≤ 55.0 °C.
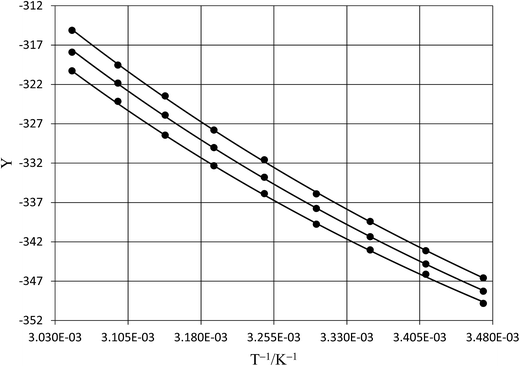
As evident in Fig. 2, the isodielectric lines span a rather wide swath, so only a narrow relative permittivity range can be used. Relative permittivity values of 68.33, 66.62, and 64.72 have been chosen for the analysis.
The rate constants and water concentrations are calculated from regression polynomials generated for each of these relative permittivities. Fig. 5 shows the linear regression analyses of eqn (12) using the data in Table 4 for the three relative permittivities, and Table 5 shows the regression values for  and
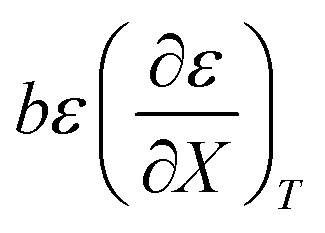
and  . It is noted here that
  as indicated in eqn (33).
 |
| | Fig. 5 Plots of  vs. T and the linear regression lines for the following relative permittivities: 64.72 (top curve), 66.62 (middle curve), and 68.33 (bottom curve). The errors bars are shown for the top curve only. The correlation coefficients are all 0.995. vs. T and the linear regression lines for the following relative permittivities: 64.72 (top curve), 66.62 (middle curve), and 68.33 (bottom curve). The errors bars are shown for the top curve only. The correlation coefficients are all 0.995. | |
Table 5 Regression values for  and
and  at the three relative permittivities
| ε |

/kJ mol−1 |

/J K−1 mol−1 |
| 64.72 |
55.3 (±3.3) |
286 (±11) |
| 66.62 |
57.0 (±3.3) |
295 (±11) |
| 68.33 |
58.4 (±3.3) |
302 (±11) |
Table 6 shows regression values for aε, bε, and  for the three relative permittivities. Fig. 6 shows the isodielectric plots and the non-linear regression analyses of eqn (38) for the three relative permittivities. ΔH‡r and ΔS‡r are the only adjustable parameters in the analyses, and the regression coefficients are independent of the value for Tr. Table 7 shows the activation parameters from the regression analyses for the three relative permittivities and Tr = 15.0 and 55.0 °C.
Table 6 Values for aε and bε and the expressions for  at the three relative permittivities. The temperature range is 15.0 to 55.0 °C, and the water mole fraction range is 0.779 to 1.000. The data used for the analyses is from regression polynomials
| ε |
aε/K−2 |
bε/K−1 |

|
| 68.33 |
1.202 × 10⁻⁵ |
−0.003305 |
(2.404 × 10⁻⁵ K−2)T − 0.003305 K−1 |
| 66.62 |
1.179 × 10⁻⁵ |
−0.003269 |
(2.358 × 10⁻⁵ K−2)T − 0.003269 K−1 |
| 64.72 |
1.186 × 10⁻⁵ |
−0.003437 |
(2.372 × 10⁻⁵ K−2)T − 0.003437 K−1 |
 |
| | Fig. 6 Isodielectric Eyring plots and non-linear regression analyses using eqn (38). The relative permittivities are: 68.33 (top curve), 66.62 (middle curve), and 64.72 (bottom curve). The water mole fraction range is 0.790 to 1.000. All data points are calculated from regression polynomials. The correlation coefficients are all 0.9999. | |
Table 7 Isodielectric activation parameters from the non-linear regression analyses of eqn (38) for the three relative permittivities and Tr = 15.0 and 55.0 °C
| ε |
Tr/°C |
ΔH‡r/kJ mol−1 |
ΔS‡r/J K−1 mol−1 |
ΔG‡r/kJ mol−1 |
| 68.33 |
15.0 |
28.93 (±0.40) |
−246.2 (±1.3) |
99.9 (±1.4) |
| 55.0 |
38.01 (±0.40) |
−199.2 (±1.3) |
103.4 (±1.4) |
| 66.62 |
15.0 |
26.43 (±0.36) |
−256.5 (±1.2) |
100.4 (±1.3) |
| 55.0 |
35.53 (±0.36) |
−209.3 (±1.2) |
104.2 (±1.3) |
| 64.72 |
15.0 |
23.89 (±0.43) |
−266.7 (±1.4) |
100.7 (±1.5) |
| 55.0 |
32.94 (±0.43) |
−219.9 (±1.4) |
105.1 (±1.5) |
Linear solvent energy relations
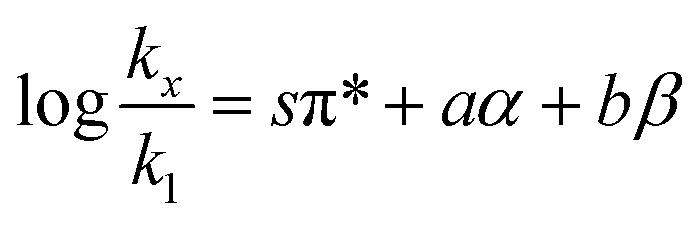
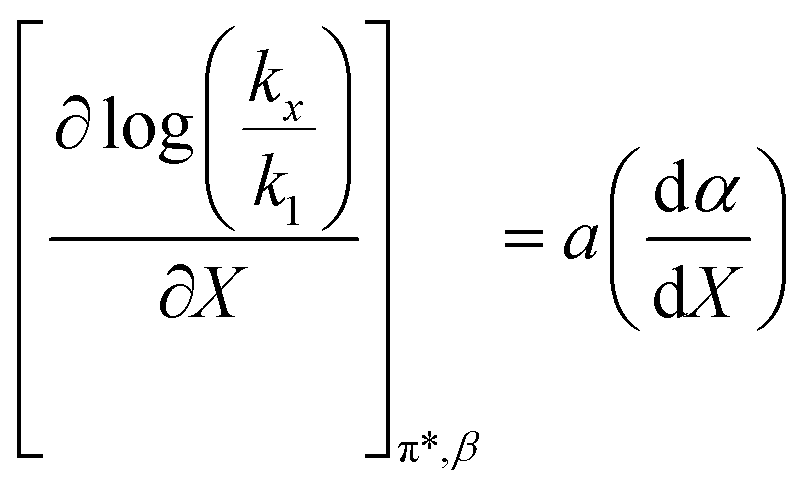
The Kamlet–Taft free energy relationship for solvent effects is:4–7| |
 | (45) |
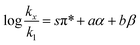
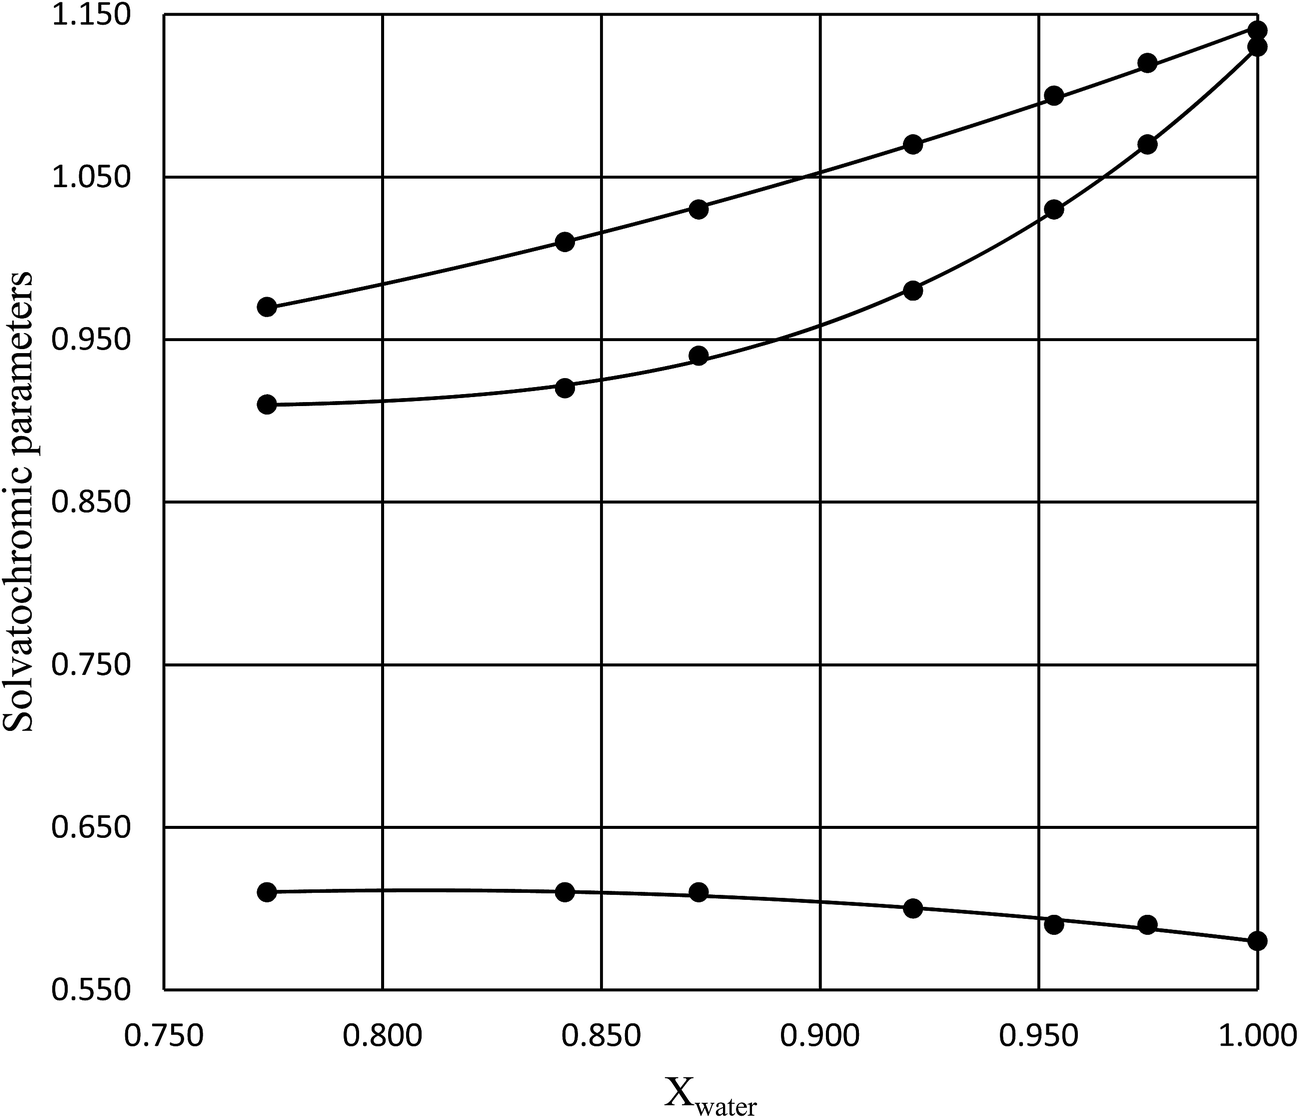
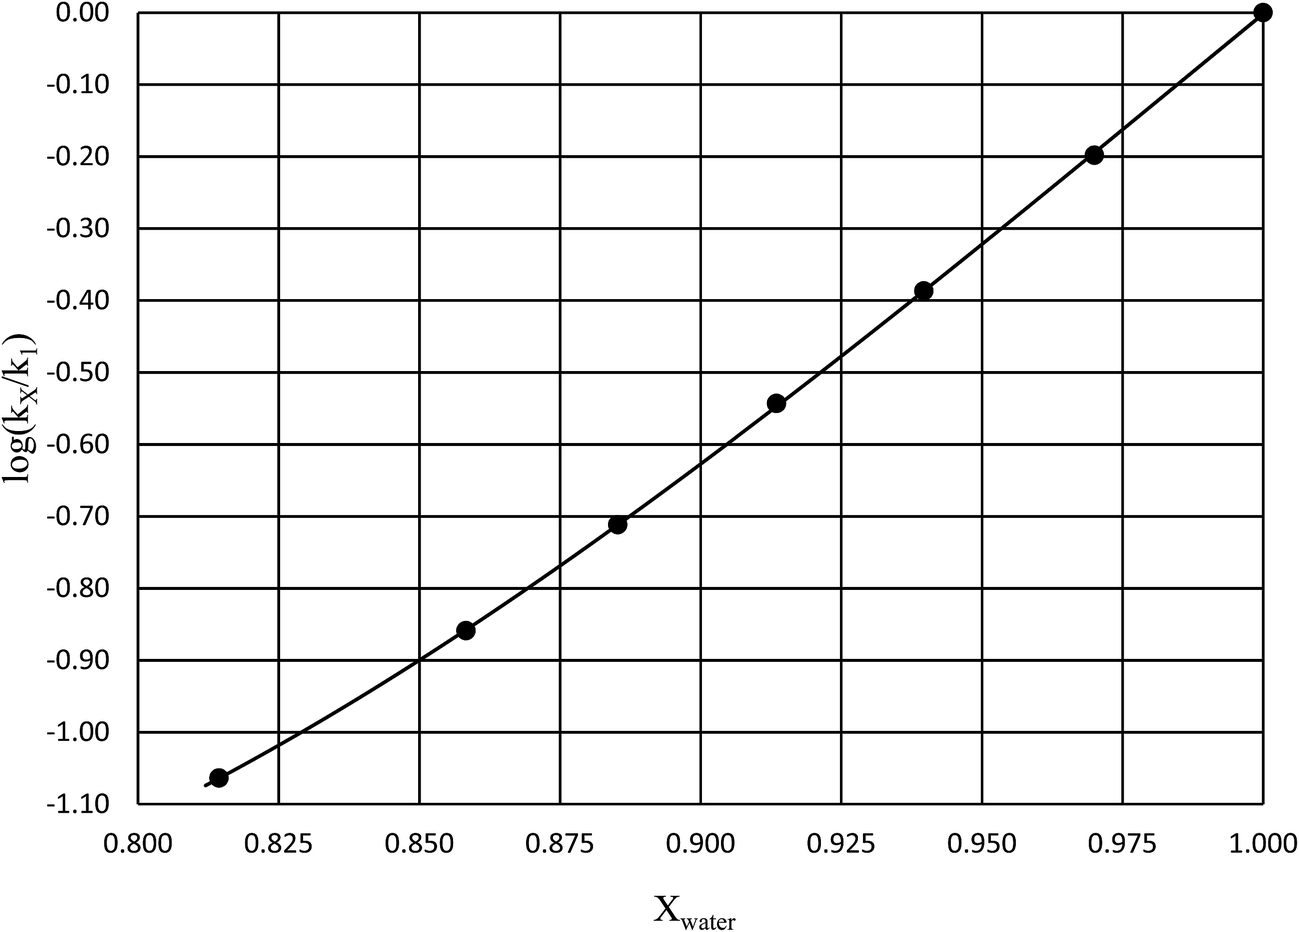
in which k1 is the rate constant at a water mole fraction of 1.000, π* is the solvent polarity/polarizability parameter, α is the solvent hydrogen bond donating (HBD) parameter, β is the hydrogen bond accepting (HBA) parameter, and s, a, and b are the corresponding solvatochromic coefficients that quantify the relative contributions from each of these solvatochromic effects. These solvent parameters have been characterized for the equilibria of quinolone antibacterials in acetonitrile/water mixtures at 25 °C.34 Plots of these parameters vs. the water mole fraction, along with the polynomial fits, are shown in Fig. 7. The plot of  vs. Xwater and the regression analysis using eqn (45) with these polynomial functions are shown in Fig. 8. Regression analysis yields the following results for the solvatochromic coefficients: s = 7.19 (0.09), a = −1.66 (0.07), and b = −10.93 (0.06). The correlation coefficient is 0.99998.
 |
| | Fig. 7 Plots of π* (top curve), α (middle curve), and β (bottom curve) vs. Xwater, and the corresponding polynomial fits. The data is for 25 °C, and is from ref. 34. | |
 |
| | Fig. 8 Plot of  vs. Xwater and the regression analysis using eqn (45). vs. Xwater and the regression analysis using eqn (45). | |
Discussion
Comparison of the computational data in Table 1 with the thermodynamic data in Table 2 reveals excellent agreement for the activation enthalpy for transition state B. None of the other transition states are even close in agreement. However, the data in Table 7 shows a temperature variability of the thermodynamic parameters, making comparison with a single set of theoretical values tenuous. The computational activation entropy is low, but the analysis of the experimental data indicates there is a significant solvent effect upon the activation entropy. As will be discussed, this effect likely represents a close-range molecular interaction that is not captured by the computational methods. Nonetheless, the close agreement of the numeric values of the activation enthalpy, coupled with the low activation free energy for transition state B, argues strongly against the other transitions states being viable options.
The data in Table 2 shows that the activation entropy for simple acetic anhydride hydrolysis under iso-mole fraction conditions contributes about 60% of the activation free energy at 25 °C. The contribution from the activation entropy is notably different for other reactions conducted in cosolvent systems, such as the amine-catalyzed ring opening of azlactones,35–38 and the hydrolyses of some metal complexes.39–41 The contribution from the activation entropies for metal complex hydrolyses is much lower than for simple acetic anhydride hydrolysis. Metal complex hydrolyses exhibit non-zero values for  and
and  , but values near zero for
  . The azlactone ring opening reactions, on the other hand, have contributions from the activation entropies that are higher than for simple acetic anhydride hydrolysis. The values for
  ,
,  , and
, and  are all non-zero for these reactions. The emerging trend seems to be that reactions with larger contributions from the activation entropy tend to exhibit non-zero values for
  , whereas reactions with larger contributions from the activation enthalpy tend to exhibit values for
  that are close to zero.
Table 8 shows values for the double constraint differential terms calculated for 25 °C, a water mole fraction of 0.901, and a relative permittivity of 66.62 (These values are arbitrarily chosen for the sake of discussion.). The value for ΔC‡p used to calculate these terms has been estimated from the following expression:25
| | |
ΔC‡p = −3mR + C‡p,vib − ∑Cp,vib + C‡p,sol − Cp,sol
| (46) |
Table 8 Values for the double constraint differential terms for acetic anhydride hydrolysis in the acetonitrile/water system at 25 °C, a water mole fraction of 0.901, and a relative permittivity of 66.62
| Thermodynamic term |
Value for the term |
 |
−81.1 J mol−1 |
 |
−0.272 J K−1 mol−1 |
 |
0 |
 |
63.5 kJ mol−1 |
 |
317 J K−1 mol−1 |
 |
−31.0 kJ mol−1 |
In this equation, the first right-hand-side term is the difference in the translational and rotational heat capacities between the transition and reactant states, m is the water molecularity, C‡p,vib is the transition-state vibrational heat capacity, ∑Cp,vib is the sum of the reactant-state vibrational heat capacities, and C‡p,sol and Cp,sol are the heat capacity contributions from the intermolecular interactions between the solvent shell and the transition and reactant states, respectively. ΔC‡p is approximately −24.9 J K−1 mol−1 for m = 1 if −3mR is the dominant term.
The positive value for  indicates that an increase in the water mole fraction under isodielectric and isothermal conditions energetically destabilizes the transition state. The negative value for
  , on the other hand, indicates that an increase in the relative permittivity under iso-mole fraction and isothermal conditions energetically stabilizes the transition state. Since an increase in the solvent relative permittivity decreases the activation enthalpy if there is charge development in the transition state,11–13 a negative value for
  indicates charge development in the transition state. However, the small numeric value for this term indicates either the charge development is not very large, or the dipole moment of the transition state is not large. This result is consistent with the computational results, which indicate some degree of charge development for all the transition states studied, and a relatively small dipole moment for transition state B.
A significant hydrogen bond accepting/donating (HBA/HBD) interaction is expected to occur between the lone pairs on the composite solvent structure and the non-transferring hydrogen atom on the nucleophilic water molecule. The fact that  is positive implies this interaction is stronger in the cosolvent mixture than in pure water. This is consistent with solvent characterization studies that show the solution basicity rises sharply when the acetonitrile mole fraction changes from 0.0 to 0.3 in aqueous solutions.42 Various spectroscopic data43–49 also reveal significant solvent structural changes when acetonitrile is added to water. The positive value for
  likely indicates a tightening of the HBA/HBD solvent structure around the transition state at higher acetonitrile mole fractions, which is consistent with
  being positive. Not surprisingly,
  dominates
  , making
  negative. The overall effect is the transition state becomes thermodynamically destabilized at higher acetonitrile mole fractions under isothermal and isodielectric conditions.
The data analyzed using the Kamlet–Taft equation (eqn (45)) is for isothermal and variable mole fraction conditions, and hence the isothermal differential terms in Table 5 can be correlated with the LSER results. The differential terms for the response to each solvatochromic parameter are derived from eqn (45) as follows:
| |
 | (47) |
| |
 | (48) |
| |
 | (49) |
Fig. 7 shows that  is negative. Since b is also negative;
  is positive, which implies that the HBA capability of the cosolvent system, which is stronger at higher acetonitrile mole fractions, stabilizes the reactant state more than the transition state. This is consistent with the thermodynamic results, but as discussed in the previous paragraph, this effect is largely entropic. Fig. 7 shows that
  is positive. Since s is also positive;
  is positive, which implies that the effect of solvent polarity/polarizability is stronger at higher water mole fractions. This is undoubtedly due to the stabilizing effect of higher relative permittivity on the transition state. Fig. 7 shows that
  is positive at water mole fractions above ∼0.85, and approximately zero below 0.85. Therefore, since a is negative;
  is also negative above 0.85. This implies that the HBD capability of the cosolvent system, which is stronger at higher water mole fractions, stabilizes the reactant state more than the transition state. This is likely due to the nucleophilic water molecule being more strongly hydrogen bonded in the reactant state than in the transition state.
Conclusion
The work presented in this article shows the type of information tractable using a conventional thermodynamic analysis of the activation parameters in the Eyring equation. Aside from the shortcomings of applying the Eyring theory to faster solution-phase reactions, the only limitation is the terms used in the analysis must be measurable quantities such as temperature, mole fraction, relative permittivity, dipole moment, and refractive index. Specific solvent–solute interactions, while they certainly affect reaction rates, are not directly measurable quantities. However, as demonstrated in this work they can be inferred through specific thermodynamic terms, such as those shown in Table 8. Thermodynamics is an exact science, so within the limitations of applying Eyring rate theory to solution kinetics, the results presented in this work are exact. As such, the thermodynamic analysis, although not so much a predictive tool, nonetheless serves a valuable complement to empirical techniques such as LSERs. The unique benefit to the thermodynamic analysis is the activation enthalpy and entropy can be analyzed as separate terms, and under specific conditions. This level of detail allows the inference of more structural details of the transition state than is possible with LSERs or with a traditional interpretation of the Eyring plots.
To the authors' knowledge the approach presented in this article is novel, and the hope is that more research will be conducted in this area. Work is currently underway in the authors' laboratories to study simple acetic anhydride hydrolysis in other cosolvent systems such as acetone/water, tetrahydrofuran/water, dioxane/water, and alcohols/water. The intent is to uncover a trend in the thermodynamic terms, and to develop general structural inferences by expanding the database. In addition, work is underway to incorporate appropriate thermodynamic terms into the traditional expressions that relate the rate constant to the relative permittivity. The intent here is to better quantify the effects of relative permittivity, and better explain why experimental data often does not conform to the functional forms of these longstanding expressions.
References
- C. Reichardt and T. Welton, Solvent and Solvent Effects in Organic Chemistry, Wiley-VCH, 4th edn, 2011 Search PubMed.
- E. Grunwald and S. Winstein, J. Am. Chem. Soc., 1948, 70, 846–854 CrossRef CAS.
- S. Winstein, E. Grunwald and H. W. Jones, J. Am. Chem. Soc., 1951, 73, 2700–2707 CrossRef CAS.
- M. J. Kamlet and R. W. Taft, J. Am. Chem. Soc., 1976, 98, 377–383 CrossRef CAS.
- M. J. Kamlet, J. L. Abboud and R. W. Taft, J. Am. Chem. Soc., 1977, 99, 6027–6038 CrossRef CAS.
- M. J. Kamlet and R. W. Taft, J. Chem. Soc., Perkin Trans. 2, 1979, 337–341 RSC.
- M. J. Kamlet, J. L. Abboud, M. H. Abraham and R. W. Taft, J. Org. Chem., 1983, 48, 2877–2887 CrossRef CAS.
- M. Sjostrom and S. Wold, Acta Chem. Scand., Ser. B, 1981, 35, 537–554 CrossRef.
- E. Eyring, J. Chem. Phys., 1935, 3, 107–115 CrossRef.
- M. G. Evans and M. Polanyi, Trans. Faraday Soc., 1935, 31, 875–894 RSC.
- E. D. Hughes and C. K. Ingold, Trans. Faraday Soc., 1941, 37, 657–685 RSC.
- C. K. Ingold, Structure and Mechanisms in Organic Chemistry, Cornell University Press, Ithaca/New York and London, 2nd edn, 1969 Search PubMed.
- E. D. Hughes and C. K. Ingold, J. Chem. Soc., 1935, 244–255 RSC.
- K. A. Cooper, M. L. Dhar, E. D. Hughes, C. K. Ingold, B. J. MacNulty and L. I. Woolf, J. Chem. Soc., 1948, 2043–2049 RSC.
- J. G. Kirkwood, J. Chem. Phys., 1934, 2, 351–361 CrossRef CAS.
- E. S. Amis, Solvent Effects on Reaction Rates and Mechanisms, Academic Press, New York and London, 1966 Search PubMed.
- E. S. Amis and J. F. Hinton, Solvent Effects on Chemical Phenomena, Academic Press, New York and London, 1973, vol. 1 Search PubMed.
- K. L. Laidler, Chemical Kinetics, Harper and Row, Hilversum, 3rd edn, 1987 Search PubMed.
- K. L. Laidler and P. A. Landskroener, Trans. Faraday Soc., 1956, 52, 200–210 RSC.
- D. G. Oakenfull, Aust. J. Chem., 1974, 27, 1423–1431 CrossRef CAS.
- R. E. Robertson, B. Rossall and A. Redmond, Can. J. Chem., 1971, 49, 3665–3670 CrossRef CAS.
- B. D. Batts and V. J. Gold, J. Chem. Soc. A, 1969, 984–987 RSC.
- A. R. Butler and V. J. Gold, J. Chem. Soc., 1961, 2305–2312 RSC.
- W. H. Hirota, R. B. Rodrigues, C. Sayer and R. do Giudici, Chem. Eng. Sci., 2010, 65(12), 3849–3858 CrossRef CAS.
- F. L. Wiseman, J. Phys. Org. Chem., 2012, 25, 1105–1111 CrossRef CAS.
- F. L. Wiseman, W. C. Cooper, C. Heishman and B. Robinson, Int. J. Adv. Res. Chem. Sci., 2015, 2(8), 1–9 Search PubMed.
- Y. Shao, L. F. Molnar, Y. Jung, J. Kussmann, C. Ochsenfeld, S. T. Brown, A. T. B. Gilbert, L. V. Slipchenko, S. V. Levchenko, D. P. O'Neill, R. A. DiStasio Jr, R. C. Lochan, T. Wang, G. J. O. Beran, N. A. Besley, J. M. Herbert, C. Y. Lin, T. Van Voorhis, S. H. Chien, A. Sodt, R. P. Steele, V. A. Rassolov, P. E. Maslen, P. P. Korambath, R. D. Adamson, B. Austin, J. Baker, E. F. C. Byrd, H. Dachsel, R. J. Doerksen, A. Dreuw, B. D. Dunietz, A. D. Dutoi, T. R. Furlani, S. R. Gwaltney, A. Heyden, S. Hirata, C.-P. Hsu, G. Kedziora, R. Z. Khalliulin, P. Klunzinger, A. M. Lee, M. S. Lee, W. Z. Liang, I. Lotan, N. Nair, B. Peters, E. I. Proynov, P. A. Pieniazek, Y. M. Rhee, J. Ritchie, E. Rosta, C. D. Sherrill, A. C. Simmonett, J. E. Subotnik, H. L. Woodcock III, W. Zhang, A. T. Bell, A. K. Chakraborty, D. M. Chipman, F. J. Keil, A. Warshel, W. J. Hehre, H. F. Schaefer, J. Kong, A. I. Krylov, P. M. W. Gill and M. Head-Gordon, Phys. Chem. Chem. Phys., 2006, 8, 3172–3191 RSC.
- S. E. Wheeler, K. N. Houk, P. V. P. Schleyer and W. D. Allen, J. Am. Chem. Soc., 2009, 131, 2547–2560 CrossRef CAS PubMed.
- A. V. Marenich, R. M. Olsen, C. P. Kelly, C. J. Cramer and D. G. Truhlar, J. Chem. Theory Comput., 2007, 3, 2011–2033 CrossRef CAS PubMed.
- W. J. A. Hehre, A Guide to Molecular Mechanics and Quantum Chemical Calculations, Wavefunction, Inc., Irvine, CA, 2003, 299–304, pp. 717–732, and references cited therein Search PubMed.
- O. A. El Seoud, R. C. Bazito and P. T. Sumodjo, J. Chem. Educ., 1997, 74(5), 562–565 CrossRef CAS.
- B. Rossall and R. E. Robertson, Can. J. Chem., 1975, 53, 869–877 CrossRef CAS.
- L. G. Gagliardi, C. B. Castells, C. Rafols, M. Roses and E. Bosch, J. Chem. Eng. Data, 2007, 52, 1103–1107 CrossRef CAS.
- J. Barbosa, R. Berges, I. Toro and V. Sanz-Nebet, Talanta, 1997, 44, 1271–1283 CrossRef CAS PubMed.
- A. M. Ismail and S. K. El-Sadany, Prog. React. Kinet. Mech., 2008, 33, 207–217 CrossRef CAS.
- A. M. Ismail, Indian J. Chem., Sect. A: Inorg., Bio-inorg., Phys., Theor. Anal. Chem., 2007, 46(06), 916–922 Search PubMed.
- D. J. Phelps, P. V. Gordreau and E. S. Nicholas, J. Chem. Soc., Perkin Trans. 2, 1981, 140–144 RSC.
- N. A. Al-Jallal and A. M. Ismail, Asian J. Chem., 2011, 23(9), 3811–3814 CAS.
- G. El-Subruiti, G. Younes and M. Jaber, Prog. React. Kinet. Mech., 2011, 36, 73–82 CrossRef CAS.
- G. El-Subruiti, K. Halawani and C. Wells, Transition Met. Chem., 1993, 18, 323–328 CrossRef CAS.
- M. Fathalla, G. El-Subruiti and Y. El-Marassi, Prog. React. Kinet. Mech., 2009, 34, 183–197 CrossRef CAS.
- J. Catalan, C. Diaz and F. Garcia-Blanco, Org. Biomol. Chem., 2003, 1, 575–580 CAS.
- G. V. Kabisch, Z. Phys. Chem., 1982, 263, 48–60 CAS.
- K. Kamogawa and T. Kitagawa, J. Phys. Chem., 1987, 91, 222–226 CrossRef CAS.
- K. Rowlen and J. M. Harris, Anal. Chem., 1991, 63, 964–969 CrossRef CAS.
- B. Z. Gorbunov and Y. I. Naberukhin, Zh. Strukt. Khim., 1975, 16, 816–825 CAS.
- D. Jamroz, J. Stangret and J. Lindgren, J. Am. Chem. Soc., 1993, 115, 6165–6168 CrossRef CAS.
- J. E. Bertie and Z. Lan, J. Phys. Chem. B, 1997, 110, 4111–4119 CrossRef.
- T. Takamuku, M. Tabata, A. Yamaguchi, J. Nishimoto, M. Kumamoto, H. Wakitaj and T. Yamaguchi, J. Phys. Chem. B, 1998, 102, 8880–8888 CrossRef CAS.
Footnote |
| † Electronic supplementary information (ESI) available. See DOI: 10.1039/c7ra05260j |
|
| This journal is © The Royal Society of Chemistry 2017 |
Click here to see how this site uses Cookies. View our privacy policy here. 
 Open Access Article
 This Open Access Article is licensed under a Creative Commons Attribution-Non Commercial 3.0 Unported Licence
 *a,
D. W. Scottb,
W. C. Cooperc,
J. Tamined,
R. O'Connella and
N. Mitchellb
*a,
D. W. Scottb,
W. C. Cooperc,
J. Tamined,
R. O'Connella and
N. Mitchellb
 and
and 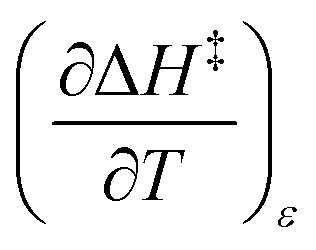 are key terms in the analysis. From eqn (1) these terms are:
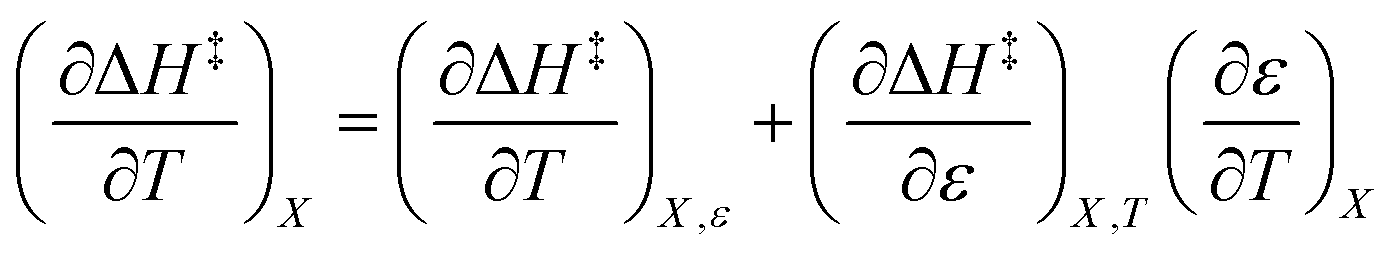
 , in which two independent variables are held constant, are hereafter called double constraint differential terms. These terms cannot be directly measured in any single cosolvent system because one independent variable cannot change while the other two are constant. However, they can be functionally related to measurable terms. The values for these double constraint differential terms reveal useful information about the structural and electrostatic nature of the transition state.
 can be identified as the activation heat capacity (ΔC‡p) under conditions of constant pressure, mole fraction, and relative permittivity. Eqn (2) and (3) therefore become:

 , the companion expressions for the activation entropy are:
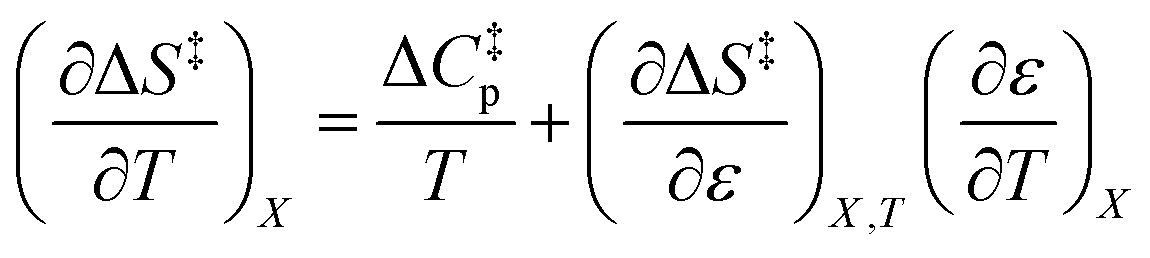
 and
and  are zero. Under these conditions
  and
and  are:
are: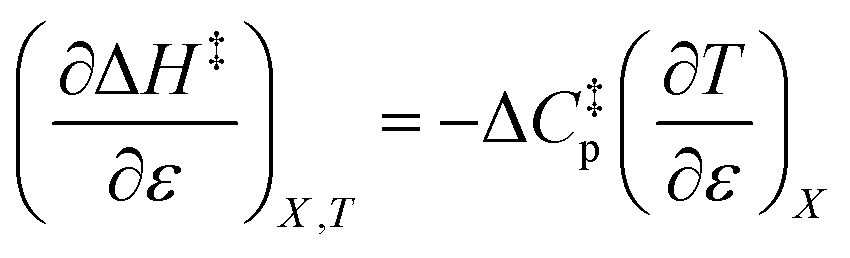


 .
. and
and  , is not zero. However, because of this ambiguity, individual numeric values for these terms cannot be determined from the isodielectric Eyring plots alone. Resolving this ambiguity requires these terms be related to measurable terms from the linear iso-mole fraction plots. The key relationships required for this analysis are derived in the following paragraphs.
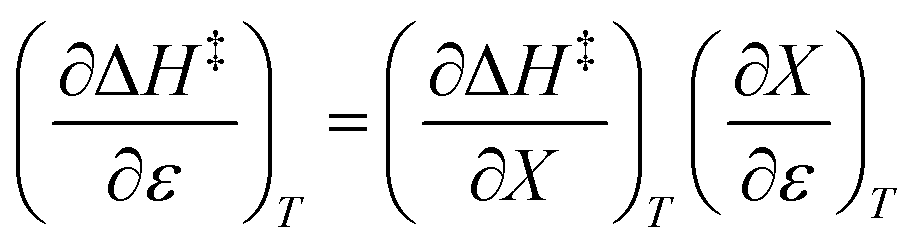 and
and  , the expression for
  is:
is: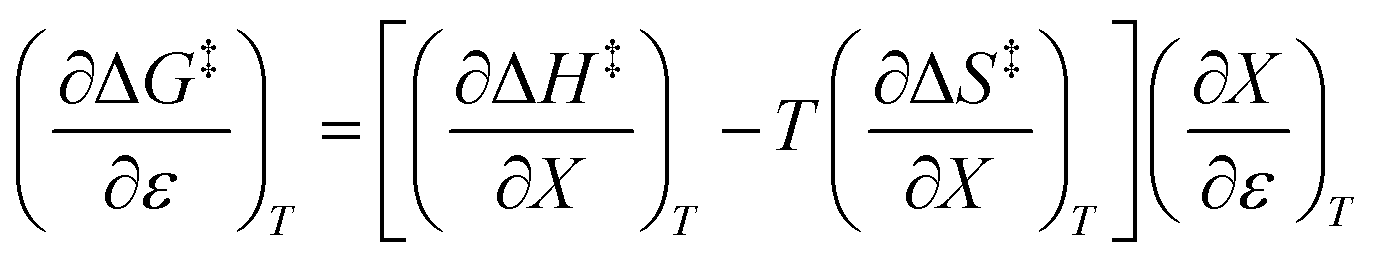
 vs. T is linear, hence the slope is
 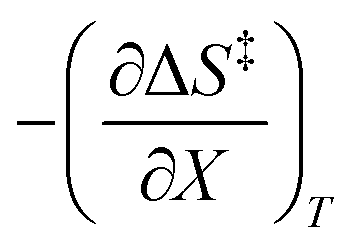 and the intercept is
  .
.

 . Since
 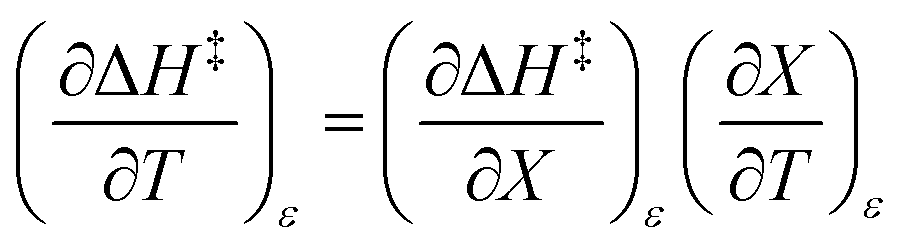 , then it follows that
 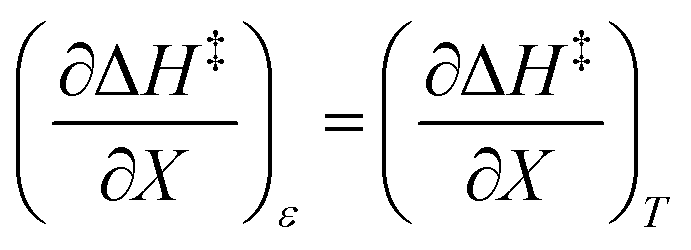 if
if 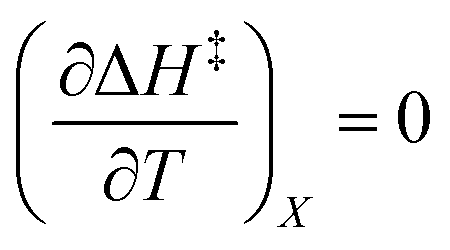 . The companion expression for
  , which is true if
 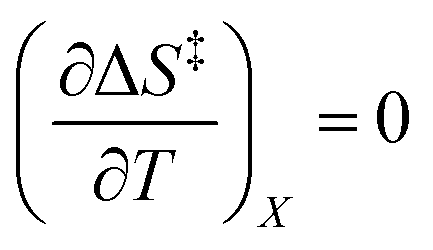 , is:
, is:
 and
and  can be determined from polynomial regression analyses of experimental data for the cosolvent system. Expressions for
  can then be calculated using the chain rule, or by direct regression analysis of the data using polynomials, as is done in this work. For the thermodynamic analyses, regression polynomials are also required for the rate constants in terms of X for each temperature. The correlation coefficients for the polynomials in this work are generally 0.999 or better, and the “experimentally equivalent” errors in the polynomial fits are presumably comparable to the actual experimental errors.

 and
and  are:
are:
 and
and  are independent of T. Therefore, the integrated expressions from eqn (29) and (30) are:
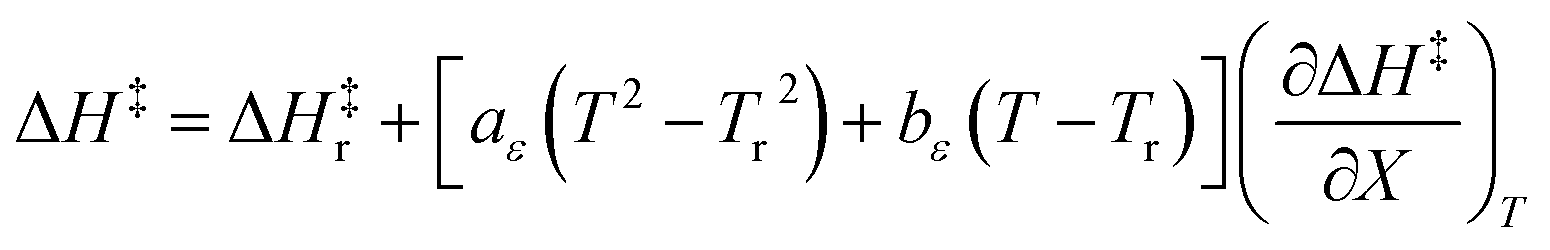

 on ε renders the following expression:
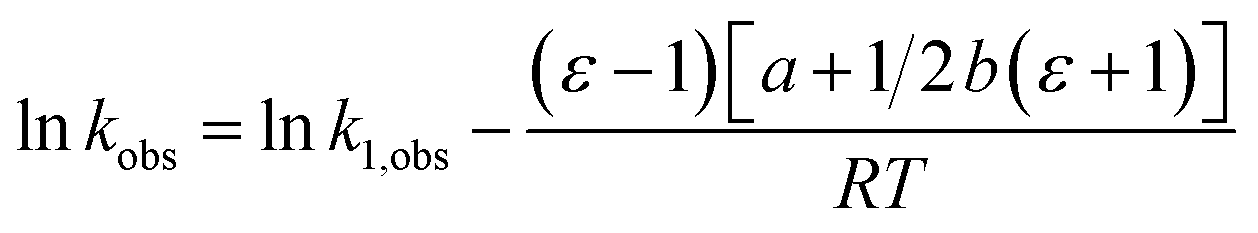
 , where kB is Boltzmann's constant and h is Planck's constant. Finally, combining eqn (31), (32), and (37) yields the following expression that is used for the isodielectric Eyring plots generated in this work:
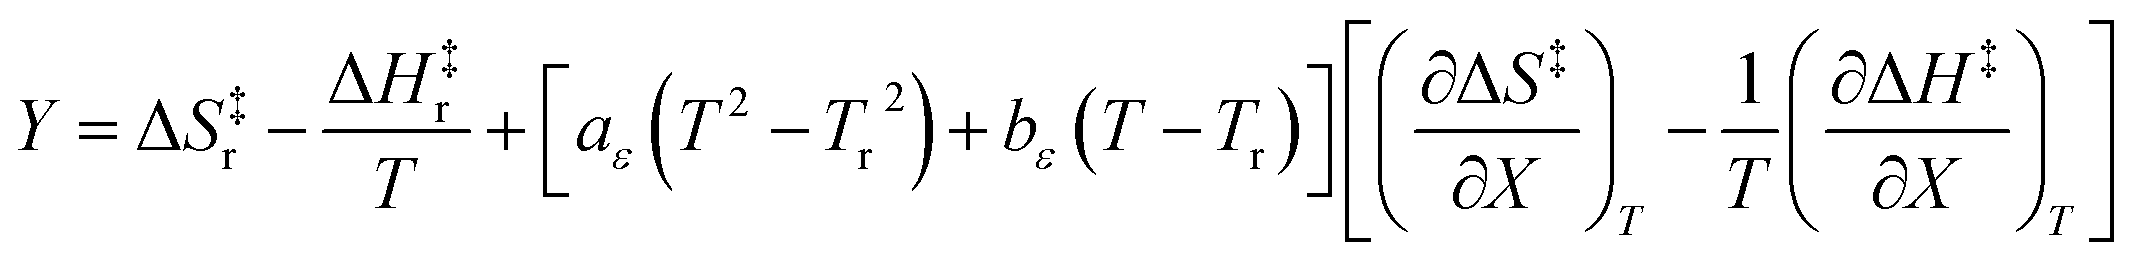
 ,25,26 where a, b, c, and k (the rate constant) are the fitting parameters. The analysis result yields k = 0.02676 (±0.00004) min−1 and a correlation coefficient of 0.999997.


 and
and  are zero. Table 2 shows the activation enthalpy and entropy from the regression analyses, and the values for the activation free energies at 25 °C.

 :
:
 for the acetonitrile/water system at various water mole fractions. The relative permittivity range is 53.08 to 80.16, and the temperature range is 15.0 to 55.0 °C. The data used for the analyses is from ref. 33

 and
and  are:
are: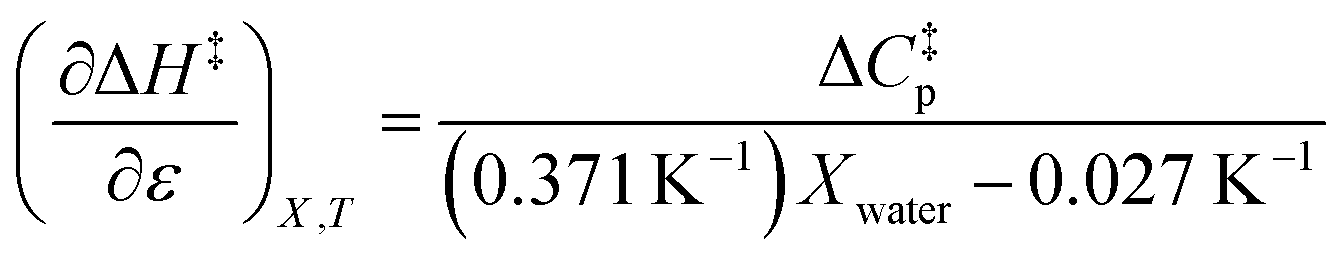
 and b, and the applicable relative permittivity range at each temperature. A linear fit of
  vs. T yields:
 , b (from the non-linear regression analysis of eqn (35) with a = 0), and the applicable relative permittivity ranges at various temperatures for acetic anhydride hydrolysis in the acetonitrile/water system. The data used to analyze the values for
  is in ref. 33

 and
and  become:
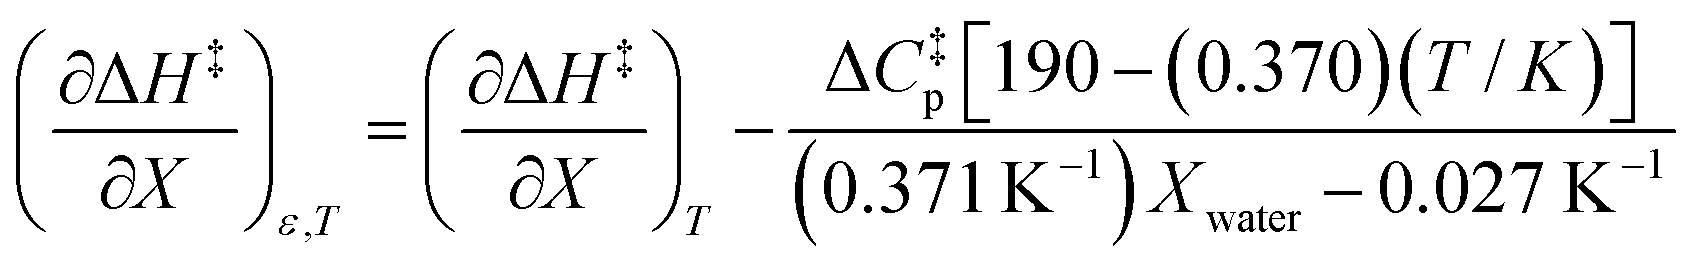
 and
and  . It is noted here that
 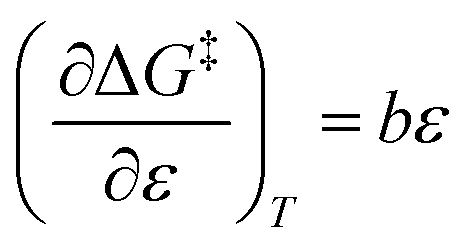 as indicated in eqn (33).
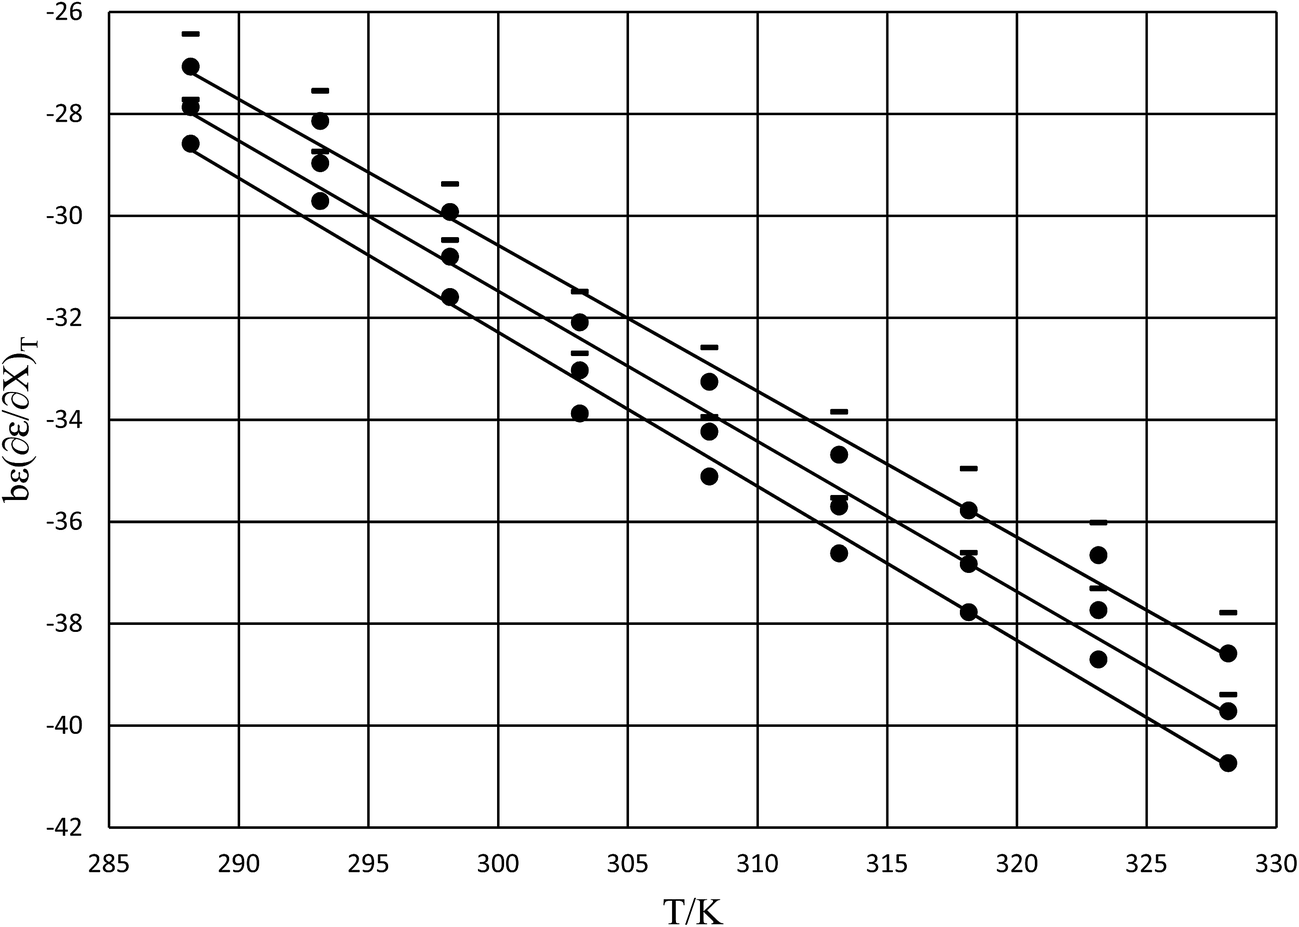
 vs. T and the linear regression lines for the following relative permittivities: 64.72 (top curve), 66.62 (middle curve), and 68.33 (bottom curve). The errors bars are shown for the top curve only. The correlation coefficients are all 0.995.
 and
and  at the three relative permittivities


 for the three relative permittivities. Fig. 6 shows the isodielectric plots and the non-linear regression analyses of eqn (38) for the three relative permittivities. ΔH‡r and ΔS‡r are the only adjustable parameters in the analyses, and the regression coefficients are independent of the value for Tr. Table 7 shows the activation parameters from the regression analyses for the three relative permittivities and Tr = 15.0 and 55.0 °C.
 at the three relative permittivities. The temperature range is 15.0 to 55.0 °C, and the water mole fraction range is 0.779 to 1.000. The data used for the analyses is from regression polynomials

 vs. Xwater and the regression analysis using eqn (45) with these polynomial functions are shown in Fig. 8. Regression analysis yields the following results for the solvatochromic coefficients: s = 7.19 (0.09), a = −1.66 (0.07), and b = −10.93 (0.06). The correlation coefficient is 0.99998.
 vs. Xwater and the regression analysis using eqn (45).
 and
and  , but values near zero for
  . The azlactone ring opening reactions, on the other hand, have contributions from the activation entropies that are higher than for simple acetic anhydride hydrolysis. The values for
  ,
,  , and
, and  are all non-zero for these reactions. The emerging trend seems to be that reactions with larger contributions from the activation entropy tend to exhibit non-zero values for
  , whereas reactions with larger contributions from the activation enthalpy tend to exhibit values for
  that are close to zero.


 indicates that an increase in the water mole fraction under isodielectric and isothermal conditions energetically destabilizes the transition state. The negative value for
  , on the other hand, indicates that an increase in the relative permittivity under iso-mole fraction and isothermal conditions energetically stabilizes the transition state. Since an increase in the solvent relative permittivity decreases the activation enthalpy if there is charge development in the transition state,11–13 a negative value for
  indicates charge development in the transition state. However, the small numeric value for this term indicates either the charge development is not very large, or the dipole moment of the transition state is not large. This result is consistent with the computational results, which indicate some degree of charge development for all the transition states studied, and a relatively small dipole moment for transition state B.
 is positive implies this interaction is stronger in the cosolvent mixture than in pure water. This is consistent with solvent characterization studies that show the solution basicity rises sharply when the acetonitrile mole fraction changes from 0.0 to 0.3 in aqueous solutions.42 Various spectroscopic data43–49 also reveal significant solvent structural changes when acetonitrile is added to water. The positive value for
  likely indicates a tightening of the HBA/HBD solvent structure around the transition state at higher acetonitrile mole fractions, which is consistent with
  being positive. Not surprisingly,
  dominates
  , making
  negative. The overall effect is the transition state becomes thermodynamically destabilized at higher acetonitrile mole fractions under isothermal and isodielectric conditions.

 is negative. Since b is also negative;
  is positive, which implies that the HBA capability of the cosolvent system, which is stronger at higher acetonitrile mole fractions, stabilizes the reactant state more than the transition state. This is consistent with the thermodynamic results, but as discussed in the previous paragraph, this effect is largely entropic. Fig. 7 shows that
  is positive. Since s is also positive;
 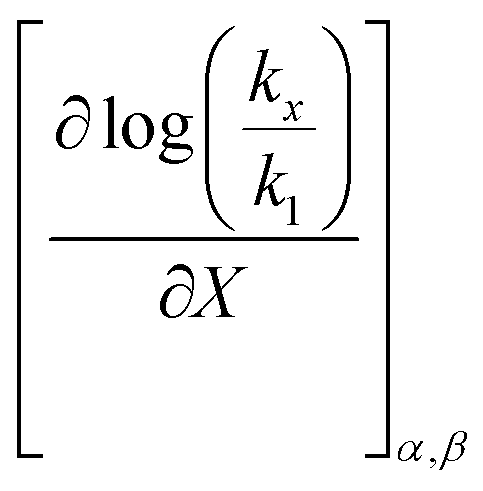 is positive, which implies that the effect of solvent polarity/polarizability is stronger at higher water mole fractions. This is undoubtedly due to the stabilizing effect of higher relative permittivity on the transition state. Fig. 7 shows that
  is positive at water mole fractions above ∼0.85, and approximately zero below 0.85. Therefore, since a is negative;
  is also negative above 0.85. This implies that the HBD capability of the cosolvent system, which is stronger at higher water mole fractions, stabilizes the reactant state more than the transition state. This is likely due to the nucleophilic water molecule being more strongly hydrogen bonded in the reactant state than in the transition state.