 Open Access Article
Synergistic piezophotocatalytic and photoelectrochemical performance of poly(vinylidene fluoride)–ZnSnO3 and poly(methyl methacrylate)–ZnSnO3 nanocomposites
Hung-Ming Lina and
Kao-Shuo Chang *ab
*ab
aDepartment of Materials Science & Engineering, National Cheng Kung University, No. 1, University Road, Tainan City 70101, Taiwan. E-mail: kschang@mail.ncku.edu.tw; Tel: +886-6-2757575 ext. 62922
bPromotion Center for Global Materials Research, National Cheng Kung University, No. 1, University Road, Tainan City 70101, Taiwan
First published on 14th June 2017
Abstract
This study investigated the piezophotocatalytic and photoelectrochemical (PEC) properties of poly(vinylidene fluoride) (PVDF)– and poly(methyl methacrylate) (PMMA)–ZnSnO3 (ZTO) nanocomposites. The multifunctions exhibited by a single compound, ZTO, were considered, and the properties were further enhanced through intimate coupling with PVDF or PMMA by using hydrothermal and spin-coating techniques to achieve synergistic piezo-related performance. PVDF and PMMA were used to enhance the separation of fabricated ZTO nanowires and improve the effective contact between nanocomposites and stress sources in various measurements including piezopotential, piezotronic, piezophototronic, and piezophotocatalytic analyses. PVDF– and PMMA–ZTO samples exhibited average piezopotentials of approximately 10 and 6 mV, respectively. Their piezotronic and piezophototronic effects were ascertained by examining current–voltage characteristics. In addition, the Schottky behavior and Schottky barrier height variation (ΔΦp2−0.1) for the two systems were deduced quantitatively by using the thermionic emission–diffusion theory (e.g., ΔΦp2−0.1 decreased by approximately 50 mV for the PVDF–ZTO nanocomposite at S2 under 0.6 GPa and −4.9 V). Energy band diagram evolution and intimate coupling between ZTO and polymers were proposed to contribute to the superior piezo-related output. The piezophotocatalytic reaction rate constant (approximately 11.4 × 10⁻³ min−1) of PVDF–ZTO was higher than that of the ZTO sample reported in the literature. PVDF–ZTO also exhibited a promising photon-to-current efficiency of approximately 31%. Our study results indicate that PVDF–ZTO can potentially be used in piezophotocatalytic and PEC applications.
1. Introduction
Awareness of environmental contamination impact and the increasing energy crisis has been growing substantially because of extensive global industrialization. Among the potential solutions to address these issues,1–3 the use of photocatalysts4 has received increasing attention. Photocatalysts can effectively photodegrade pollutants, such as NOx,5 SOx,6 and organic dyes,4 and split water for harvesting hydrogen fuels.7 The essential mechanism underlying both the reactions depends on the generation of electron–hole (e−–h+) pairs triggered by the radiation absorption of photocatalysts.4,8Fujishima and Honda first discovered TiO2 for water splitting in 1972.9 CdS, CdSe, SrTiO3, and NaTaO3 (ref. 10) are other typical materials that have been studied extensively. In addition, heterogeneous photocatalysts used in the removal of organic species from aqueous or gaseous systems have since been investigated.4,11 The photocatalysts GaP,12 ZnO,13 WO3,13 CdS,13 and K3B6O10Br14 are widely used for photodegradation. Many researchers have attempted to enhance the photocatalytic efficiencies of materials for various applications. Several strategies have been reported, including the use of nanostructures,15 composition tuning,16 crystallite sizes,17 metal complexes,18 heterojunction or composite materials,19,20 morphology,21 energy band gap (Eg) tuning,22 defect engineering,23 surface plasma resonance (SPR),24 sonophotocatalysis (with25 and without26 piezopotential assistance), complex compounds,14,27 and semiconductor and conjugated polymer hybrids.28
The aforementioned strategies have typically only focused on the photocatalytic function of materials and do not consider multifunctional interactions, especially those originating from the close coupling of various distinctive properties exhibited by a simple compound. Thus, piezophotocatalysis was developed recently29,30 and is yet to be explored comprehensively. In our previous study, ZnSnO3 (ZTO) was recognized as a potential piezophotocatalyst; its piezoelectricity was utilized to enhance photocatalysis because of the induced piezopotential that modulates the band structure of the system to manipulate photodegradation efficiency.13
In this study, the piezophotocatalytic performance of ZTO was further enhanced by coupling it with a functional polymer [poly(methyl methacrylate) (PMMA) or poly(vinylidene fluoride) (PVDF)] to achieve synergistic piezophotocatalysis. Various polymer-involved nanocomposites have been reported in the literature. For example, Zhao et al.31 proposed a lead-free piezoelectric nanocomposite of special oriented BaTiO3 nanoparticles and PVDF working as nanogenerators, which could reach a considerably high open-circuit voltage (150 V) and power three light-emitting diodes. Alluri et al.32 also demonstrated the potential of BaTi1−xZrxO3 nanocube–PVDF hybrid films as flexible nanogenerators. The device exhibited a high electrical output (approximately 12.0 V and 1.4 μA). These authors also used the device as a sensor to measure various water velocities in outlet pipes. Kakimoto et al.33 used a composite of fibrous BaTiO3 embedded into PVDF sheets, in which a high amount of electricity was generated when the system was stretched along the longitudinal direction of fiber orientation. The measured electric field-induced strain (ε31) of this system was substantially enhanced compared with that of spherical BaTiO3 powders. A similar system was also reported by Nunes-Pereira et al.34 In addition, nanocomposites of ZnO and PVDF were studied. Nour et al.35 fabricated ZnO–PVDF-based hybrids as hand writing-driven nanogenerators; a superior electrical output of 4.8 V and 14.4 mA was obtained when these hybrids were used in a special stacking configuration. Indolia et al.36 examined the optical properties of the nanocomposites of ZnO and PVDF, in which absorption in the UV region of the spectrum and Eg were observed to increase and decrease, respectively. Furthermore, PVDF was coupled with TiO2 for various applications. Cao et al.37 reported that dispersing TiO2 nanoparticles into PVDF could improve the antifouling property of the PVDF membrane. Losito38 evaluated the photocatalytic degradation of pesticides by using TiO2–PVDF films and observed substantial improvement in the degradation rate.
PMMA also effectively enhances mechanical, optical, electrical, and thermal properties through nanocomposites. Xu et al.39 demonstrated the vertical and lateral integration of ZnO nanowires into arrays to produce sufficient power to operate real devices. PMMA was spin coated onto the nanowires to prevent a short circuit between the substrate and the top electrode and to improve the stability and mechanical robustness of the system. Ghosh et al.40 reported the performance of a hybrid film nanogenerator of reduced graphene oxide and PMMA, in which increased bending of the system triggered an increasing current. Pre et al.41 studied functionalized ZnO combined with PMMA to form a transparent luminescent nanocomposite powder. They found that the excellent mobility and enhanced mechanical and thermal properties of the nanocomposite were due to interactions between PMMA and ZnO nanoparticles.
Although polymer-involved nanocomposites have been employed in various applications, an extensive investigation in the field of piezophotocatalysis is still lacking. In this study, we incorporated flexible PVDF or PMMA to strengthen the separation of fabricated ZTO nanowires and enhance the effective contact between nanocomposites and stress sources, such as a tungsten (W) stress probe in piezotronic/piezophototronic characterizations and a glass in piezophotocatalysis measurements. PVDF–ZTO and PMMA–ZTO nanocomposites exhibited strong piezotronic, piezophototronic, and piezophotocatalytic responses, indicating their potential use in piezo-related applications and the valuable approach of polymer–ZTO nanocomposites for obtaining synergistic effects.
2. Experimental
A two-step hydrothermal synthesis method was used to fabricate ZTO nanowires on indium tin oxide (ITO) substrates. The details were described in our previous study.13 The fabrication process of PVDF– or PMMA–ZTO nanocomposites was as follows. First, 1 g of PVDF [molecular weight (MW) = 180![[thin space (1/6-em)]](https://www.rsc.org/images/entities/char_2009.gif) 000] or PMMA (MW = 50
000] or PMMA (MW = 50![[thin space (1/6-em)]](https://www.rsc.org/images/entities/char_2009.gif) 000) pellets were dissolved in 10 mL of dimethylformamide solvent, which was then stirred at approximately 120 °C for 20 min to ensure that the pellets were completely dissolved to form a polymer solution at a concentration of approximately 0.1 g mL−1. The hydrothermally synthesized ZTO nanowires on ITO were then coated with the aforementioned PVDF or PMMA solution by using a spin-coating method, in which 3–5 drops of the polymer solution were dispensed. The rotating speed and time of the spin coater were controlled at 3000 rpm and 40 s, respectively. The sample was subsequently dried in air for approximately 1 h. In addition, a thin carbon layer was deposited on top of the samples for scanning electron microscopy (SEM) and current–voltage (I–V) measurements.
000) pellets were dissolved in 10 mL of dimethylformamide solvent, which was then stirred at approximately 120 °C for 20 min to ensure that the pellets were completely dissolved to form a polymer solution at a concentration of approximately 0.1 g mL−1. The hydrothermally synthesized ZTO nanowires on ITO were then coated with the aforementioned PVDF or PMMA solution by using a spin-coating method, in which 3–5 drops of the polymer solution were dispensed. The rotating speed and time of the spin coater were controlled at 3000 rpm and 40 s, respectively. The sample was subsequently dried in air for approximately 1 h. In addition, a thin carbon layer was deposited on top of the samples for scanning electron microscopy (SEM) and current–voltage (I–V) measurements.
SEM was used to analyze the morphology of nanocomposites. A specially designed probe system (Sadhu Design Co., Hsinchu, Taiwan) comprising a semiconductor parameter analyzer (HP-4145B) and two W electrical probes was employed to measure the I–V characteristics and piezotronic/piezophototronic properties of nanocomposites. When characterizing piezotronic properties, one probe, integrated with a sensitive stress reader, simultaneously supplied the bias and stress to samples and the other probe was grounded and contacted with the ITO bottom electrode. To further examine the piezophototronic effect, UV irradiation was applied. In addition, the direct induced piezopotential was measured by integrating an oscilloscope (LeCroy LT374) to the I–V probe facility. An ultrasonic transducer (0.2 W, 40 kHz) was used in the setup, enabling the periodic production of piezopotential. For photocatalytic analyses, the samples sized 1 cm × 1 cm were first displaced in the MB solution (10 mL, 4 ppm) and maintained in the dark for 30 min to achieve an absorption–desorption equilibrium prior to measurements. Subsequently, photodegradation activities were measured every 30 min during the reaction under UVA irradiation (approximately 320–340 nm, 30 W). A UV-vis spectrometer was utilized to characterize residual MB concentrations. For piezophotocatalytic efficiency measurements, stress was applied using a piece of transparent glass (net weight of approximately 1.7 g) combined with a transducer operated at a power of approximately 0.2 W and a frequency of 40 kHz. An incident photon-to-current efficiency (IPCE) experiment was also performed using the nanocomposites as the working photoelectrode and the platinum film as a counter electrode without any applied direct current (DC) bias. A photoelectrochemical (PEC) cell was fabricated by heating two L-shaped polymers (Surlyn) to approximately 120 °C for several minutes to attach them to the two electrodes. The resulting reservoir was supplied with the electrolyte solutions of a mixture of 0.1 M Na2SO4(aq) and 1 M NaOH(aq). The cell was then tested using a light source with the wavelength ranging from 300 to 500 nm.
3. Results and discussion
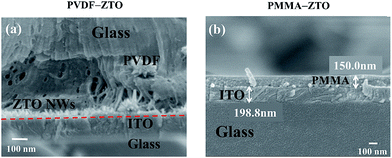
The morphologies of ZTO–PVDF and ZTO–PMMA nanocomposites were examined using SEM. Fig. 1(a) shows the side view image of ZTO–PVDF nanocomposites, in which ZTO nanowires could be easily observed because of the porous morphology of the PVDF film. This result indicated the effective coupling between ZTO nanowires and PVDF, which is crucial for the subsequent piezoelectric-related characterizations. However, high-density film-like PMMA was observed in ZTO–PMMA nanocomposites [Fig. 1(b)], leading to unobservable ZTO nanowires, although the diluted PMMA solution (0.05 g mL−1) was intentionally used.Piezopotential is a direct indication of material piezoelectricity, which is crucial for piezotronic/piezophototronic applications. These features of the two nanocomposites were characterized using the stress probe system, which is described in the Experimental section. In this study, pressure of approximately 0.3 GPa was supplied manually. A bare ITO substrate, pure PMMA, and PVDF were measured for reference. As shown in Fig. 2(a) and as expected, the ITO substrate and pure PMMA did not exhibit piezopotential because of the nonpiezoelectricity of these materials. However, pure PVDF exhibited a trivial piezopotential of approximately 1 mV (not shown). This might be attributed to the β phase of PVDF, which forms during the spin-coating process.42 Fig. 2(b) and (c) present the results of ZTO–PVDF and ZTO–PMMA nanocomposites, respectively. Their average piezopotentials were approximately 10 and 6 mV, respectively, indicating their piezoelectric properties. Combining with the SEM results (Fig. 1), the higher piezopotential exhibited by ZTO–PVDF nanocomposites, compared with that of ZTO–PMMA, was attributed to the following: (1) the intimate coupling between ZTO and PVDF [Fig. 1(a)], and (2) discernible piezoelectricity of PVDF.
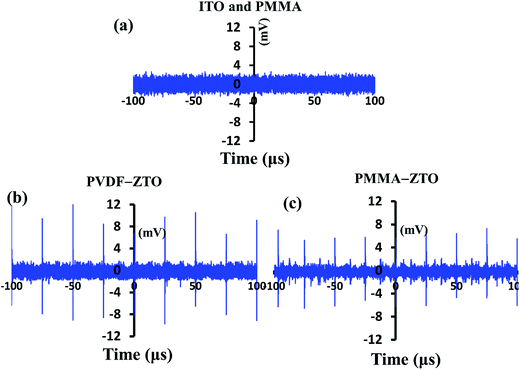 | ||
| Fig. 2 Piezopotential characterizations. (a) ITO and PMMA. (b) PVDF–ZTO nanocomposite. (c) PMMA–ZTO nanocomposite. | ||
I–V characteristics can be used to study the piezotronic and piezophototronic effects of nanocomposites because the resulting piezopotential under stress tailors a Schottky barrier height and modulates charge carrier transport in systems. The inset of Fig. 3(c) illustrates the measurement configuration, in which two Schottky contacts (S1 and S2) were formed. The stress and bias probes are in direct contact with PMMA or PVDF (S2) and the grounded probe is in contact with ZTO nanowires through the ITO substrate (S1), which was achieved by scratching off a small portion of the nanocomposites on the surface of ITO/glass. The exposed conductive ITO surface was verified by monitoring its resistance, using a four-point probe to ensure that the nanocomposites were discarded effectively.
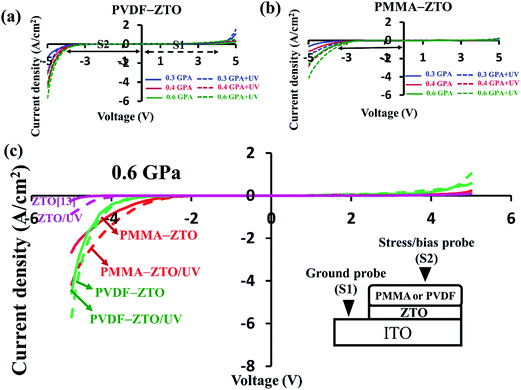 | ||
| Fig. 3 Piezotronic and piezophototronic I–V characteristics. (a) PVDF–ZTO nanocomposite. (b) PMMA–ZTO nanocomposite. (c) Comparison among PVDF–ZTO, PMMA–ZTO, and pure ZTO13 under the pressure of 0.6 GPa. | ||
The asymmetric I–V curves of PVDF–ZTO and PMMA–ZTO [Fig. 3(a) and (b), respectively] indicated their piezotronic/piezophototronic properties. As shown in Fig. 3(a), when the stress applied by stress and bias probes at S2 increased from 0.3 (blue curve) to 0.6 (green curve) GPa without illumination (solid lines), the current density (JD) under a negative bias range was negatively enhanced from approximately −1.0 to −4.5 A cm−2 at a bias of −5 V because the Schottky barrier height (S2) was decreased. This can also be verified by observing the measured threshold JD (solid black double-headed arrow) in I–V characteristics. These characteristics featured the piezotronic effect of PVDF/ZTO nanocomposites. In addition, when UV irradiation was applied, the photonic features of the system (dashed lines) were characterized. The measured JD at the applied negative bias range exhibited the same trend as that observed for the piezotronic effect, which was indicative of the piezophototronic effect. The other PMMA–ZTO sample also exhibited similar behavior [Fig. 3(b)], except for lower JD than that of the PVDF–ZTO nanocomposite. Furthermore, to illustrate the enhanced piezotronic/piezophototronic effects of the two samples, the results of a previous study on pure ZTO nanowires13 were compared [Fig. 3(c)]. To elucidate the enhancement, only I–V characteristics measured under 0.6 GPa were plotted. As shown in the Fig. 3(c), the JD exhibited by the two nanocomposites (red and blue curves) was substantially superior to that exhibited by pure ZTO nanowires (pink curves), irrespective of piezotronic (solid lines) or piezophototronic (dashed lines) effects. For instance, the piezophototronic effect exerted by PVDF–ZTO was six times stronger than that exerted by pure ZTO nanowires. The strong piezophototronic effect exerted by PVDF–ZTO indicated effective coupling between ZTO and PVDF and complemented piezopotential characterizations (Fig. 2).
To quantitatively verify variations in the Schottky barrier height under various stresses [Fig. 3(a) and (b)], the I–V characteristic was further examined. Although a polymer layer (PVDF or PMMA) was involved between the W metal probe and ZTO nanowires in nanocomposites, the Schottky emission behavior is still regulated by the thermionic emission–diffusion theory13 because of the noninsulating and porous structures of PVDF or PMMA. Thus, JD can be expressed as shown in eqn (1):
 | (1) |
 | (2) |
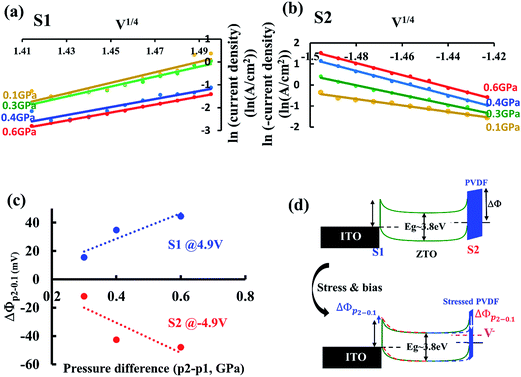
Fig. 4(a) shows the plot of ln(JD) as a function of V1/4 at S1 for the PVDF–ZTO nanocomposite. A linear relationship was observed under various applied pressures at a bias ranging approximately from 4.0 V (V1/4 = 1.41 V) to 5 V (V1/4 = 1.5 V). A similar trend was observed at S2 under a negative bias [Fig. 4(b)]. Thus, the Schottky behavior at S1 and S2 was ascertained. In addition, the Schottky barrier height variation (ΔΦp2−p1) at S1 and S2 under different applied pressures can be determined using eqn (3):
 | (3) |
To study the observations in Fig. 3 and 4, the energy band diagram evolution of PVDF–ZTO under applied stresses and a negative bias was elucidated. When stress and a negative bias were not applied to the system, the JD was not enabled because of the substantial barrier height (ΔΦ), as shown at the top of Fig. 4(d). However, when PVDF was strained under compressive stress and the stress was transferred effectively to nanowires, the corresponding barrier height decreased [ΔΦp2−0.1, dashed blue line, bottom of Fig. 4(d)] with the buildup of positive piezopotential on the top of ZTO nanowires. In addition, the electron energy level increased (dashed pink line) with the application of a negative bias at S2. The electrons were then facilitated to tunnel through the thin PVDF film and flow from S2 to S1; thus, JD was enhanced. By contrast, when a positive bias and stress were applied at S2, the essential Schottky barrier height at S1 increased, thus leading to a decreased JD flow from S1 to S2.
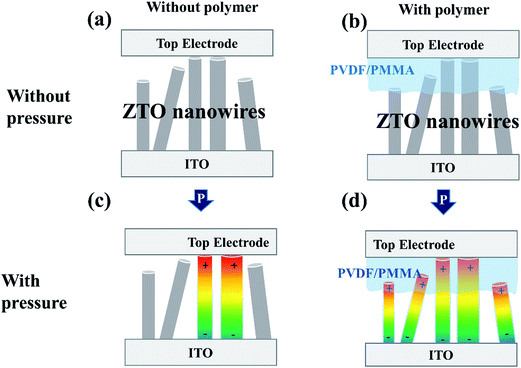
Another crucial mechanism underlying the enhancement of piezo-related properties is the intimate coupling between ZTO and polymers. When the stress probe came in contact with the sample surface involving no polymer incorporation [Fig. 5(a) and (c)], few ZTO nanowires experienced compressive stress effectively because of their unperfected alignment normal to the ITO substrate [Fig. 1(a)], thus leading to a small piezoelectric output. By contrast, when polymers were coated on the top of ZTO nanowires [Fig. 5(b) and (d)], the flexibility of polymers substantially enhanced the contact and enabled abundant ZTO nanowires to be stressed compressively. Thus, superior piezoelectric output was achieved. In addition, the polymer thickness effect was also studied. When more drops of the polymer solution were dispensed, the applied compressive stress was not transferred effectively to ZTO nanowires and the electrons were hindered to tunnel through the thicker PVDF film. Thus, the resultant piezotronic and piezophototronic properties were deteriorated.
The photodegradation results of PVDF–ZTO and PMMA–ZTO are shown in Fig. 6. The degradation activity (C/C0) was plotted against UV irradiation time. All sample solutions under study were placed in a black box for 30 min for the dark test to ensure that the absorption–desorption equilibrium was reached prior to the measurement. The photodegradation activities were then recorded every 30 min under UVA irradiation of 30 W. In addition to the nanocomposites, pure MB, PVDF, PMMA, and ZTO were prepared and measured for comparison. For the piezophotocatalytic efficiency measurement, both a transparent glass with a net weight of approximately 0.7 g and an ultrasonic transducer (40 kHz and 0.2 W) were applied. As shown in Fig. 6(a) (PVDF–ZTO), the self-photodegradation of the MB solution (black line) was almost negligible, and pure PVDF did not exhibit noticeable photodegradation (gray line). However, the photodegradation behavior of pure ZTO nanowires (orange line) and PVDF–ZTO nanocomposites (blue line) improved substantially. When a glass and an ultrasonic transducer were additionally applied (red line), superior performance was observed, with almost 71% of MB (after dark absorption correction) being photodecomposed in 120 min. This result implies that synergistic photocatalysis was achieved through the piezophototronic effect. The corresponding photodegradation kinetics of PVDF–ZTO [Fig. 6(b)] were also analyzed by plotting ln(C0/C) (C0 and C represent the original and residual concentrations of MB, respectively) versus irradiation time. A linear relationship was observed for all samples, indicating a first-order kinetic behavior. The highest reaction rate constant (k) was observed to be approximately 11.4 × 10⁻³ min−1, which was approximately three times higher than that of the pure ZTO sample. In addition, piezophotocatalysis exhibited by the sample was superior than that of ZTO reported in a previous study, in which three times the size of ZTO was used to obtain k of approximately 15.0 × 10⁻³ min−1.13 This enhancement strongly implied the feasibility of applying nanocomposites formed by coupling between ZTO and PVDF in the field of piezophotocatalysis. The PVDF–ZTO energy band diagram can be used to elucidate the enhancement [inset of Fig. 6(a)]. When stress was applied to the system, PVDF and ZTO nanowires bent effectively [Fig. 4(b)]. Such band bending resulted in potential variations across ZTO nanowires [a positive piezopotential at one end (red dashed line) and a negative piezopotential at the other end (blue dashed line)], thus attenuating e−–h+ pair recombination because of superior photogenerated e− movement from one side to the other in nanowires. Furthermore, ultrasonic vibration also contributed to the enhancement as follows: (1) surface sweeping of ZTO nanowires resulted in the availability of additional active sites, (2) minimization of the charge screening of ZTO nanowires resulting from alternative piezopotential variation, and (3) easy MB mass transport. Moreover, the photocatalytic activity of the PMMA–ZTO nanocomposite was similar to that of the PVDF–ZTO nanocomposite, but the PMMA–ZTO nanocomposite had a slightly inferior performance. The highest k was observed to be approximately 10.2 × 10⁻³ min−1.
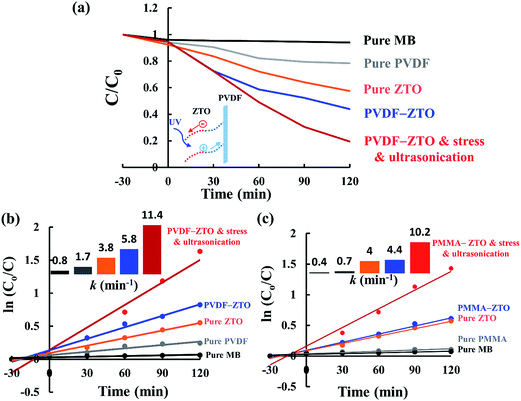 | ||
| Fig. 6 Piezophotocatalysis characterizations. (a) PVDF–ZTO nanocomposite. (b) Photodegradation kinetics of PVDF–ZTO. (c) Photodegradation kinetics of PMMA–ZTO. | ||
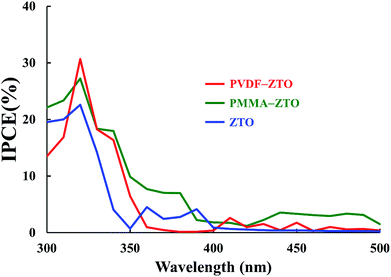
Finally, the PEC performance of samples was examined, in which IPCE is one of the crucial parameters because it indicates the conversion efficiency of solar to hydrogen under a zero bias.43 Fig. 7 shows IPCE results for the three samples [PVDF–ZTO (red curve), PMMA–ZTO (green curve), and pure ZTO (blue curve)]. PVDF–ZTO had the highest IPCE value, with the maximum values of approximately 31%, 27%, and 23% for PVDF–ZTO, PMMA–ZTO, and pure ZTO, respectively, at the wavelength of approximately 320 nm, which corresponded to the Eg transition of ZTO.13 Although measurement conditions were not optimized, the high IPCE values of the PVDF–ZTO nanocomposite still suggest its potential application in PEC devices.
4. Conclusions
Hydrothermal and spin-coating techniques were employed to fabricate PVDF–ZTO and PMMA–ZTO nanocomposites, and SEM was used to study their morphologies. Piezopotential exhibited by the two nanocomposites was characterized using the stress probe system by applying the pressure of approximately 0.3 GPa. The average piezopotentials of PVDF–ZTO and PMMA–ZTO were approximately 10 and 6 mV, respectively. The piezotronic and piezophototronic properties of the two samples were ascertained by examining the asymmetrical I–V curves under 0.3, 0.4, and 0.6 GPa and UV illumination. The thermionic emission–diffusion theory was adopted to quantitatively elucidate the Schottky behavior and Schottky barrier height variation of the two systems. For example, ΔΦp2−0.1 at S2 under −4.9 V decreased by approximately 50 mV at 0.6 GPa for the PVDF–ZTO nanocomposite. Energy band diagram evolution, the effective contact between nanocomposites and stress sources, and the intimate coupling between ZTO and polymers were proposed to illustrate the superior piezo-related output. The PVDF–ZTO nanocomposite is a promising piezophotocatalyst and PEC electrode material because of its superior piezophotodegradation rate constant k (approximately 11.4 × 10⁻³ min−1) and IPCE value at approximately 31%.Acknowledgements
This work was partially supported by the Ministry of Science and Technology, Taiwan, under grant MOST 104-2221-E-006-025.References
- G. W. Crabtree and N. S. Lewis, Phys. Today, 2007, 60, 37 CrossRef CAS.
- N. Z. Muradov and T. N. Veziroglu, Int. J. Hydrogen Energy, 2008, 33, 6804 CrossRef CAS.
- F. E. Osterloh and B. A. Parkinson, MRS Bull., 2011, 36, 17 CrossRef CAS.
- M. R. Hoffmann, S. T. Martin, W. Choi and D. W. Bahnemann, Chem. Rev., 1995, 95, 69 CrossRef CAS.
- J. S. Dalton, P. A. Janes, N. G. Jones, J. A. Nicholson, K. R. Hallam and G. C. Allen, Environ. Pollut., 2002, 120, 415 CrossRef CAS PubMed.
- J. Liqiang, X. Baifu, Y. Fulong, W. Baiqi, S. Keying, C. Weimin and F. Honggang, Appl. Catal., A, 2004, 275, 49 CrossRef.
- M. Ni, K. H. Leung, Y. C. Leung and K. Sumathy, Renewable Sustainable Energy Rev., 2007, 11, 401 CrossRef CAS.
- K. Nakata and A. Fujishima, J. Photochem. Photobiol., C, 2012, 13, 169 CrossRef CAS.
- A. Fujishima and K. Honda, Nature, 1972, 238, 37 CrossRef CAS PubMed.
- K. Maeda and K. Domen, J. Phys. Chem. C, 2007, 111, 7851 CAS.
- A. L. Linsebigler, G. Lu and T. Y. Yates Jr, Chem. Rev., 1995, 95, 735 CrossRef CAS.
- J. Qiu, G. Zeng, P. Pavaskar, Z. Li and S. B. Cronin, Phys. Chem. Chem. Phys., 2014, 16, 3115 RSC.
- Y.-T. Wang and K.-S. Chang, J. Am. Ceram. Soc., 2016, 99, 2593 CrossRef CAS.
- X. Fan, L. Zang, M. Zhang, H. Qiu, Z. Wang, J. Yin, H. Jia, S. Pan and C. A. Wang, Chem. Mater., 2014, 26, 3169 CrossRef CAS.
- F. Amano, K. Nogami, M. Tanaka and B. Ohtani, Langmuir, 2010, 26, 7174 CrossRef CAS PubMed.
- M. Z. Dozzi and E. Selli, Catal. Today, 2013, 206, 26 CrossRef CAS.
- X. Wang, L. So, R. Su, S. Wendt, P. Hald, A. Mamakhel, C. Yang, Y. Huang, B. B. Iversen and F. Besenbacher, J. Catal., 2014, 310, 100 CrossRef CAS.
- S. Ohzu, T. Ishizuka, Y. Hirai, S. Fukuzumi and T. Kojima, Chem.–Eur. J., 2013, 19, 1563 CrossRef CAS PubMed.
- H. J. Li, Y. Zhou, W. Tu, J. Ye and Z. Zou, Adv. Funct. Mater., 2015, 25, 998 CrossRef CAS.
- R. Marschall, Adv. Funct. Mater., 2014, 24, 2421 CrossRef CAS.
- Y. Xia, P. Yang, Y. Sun, Y. Wu, B. Mayers, B. Gates, Y. Yin, F. Kim and H. Yan, Adv. Mater., 2003, 15, 353 CrossRef CAS.
- W.-C. Lu, H. D. Nguyen, C.-Y. Wu, K.-S. Chang and M. Yoshimura, J. Appl. Phys., 2014, 115, 1 Search PubMed.
- X. Pan, M.-Q. Yang, X. Fu, N. Zhang and Y.-J. Xu, Nanoscale, 2013, 5, 3601 RSC.
- Z. Xu, M. Quintanilla, F. Vetrone, A. O. Govorov, M. Chaker and D. Ma, Adv. Funct. Mater., 2015, 25, 2950 CrossRef CAS.
- H. Li, Y. Sang, S. Chang, X. Huang, Y. Zhang, R. Yang, H. Jiang, H. Liu and Z. L. Wang, Nano Lett., 2015, 15, 2372 CrossRef CAS PubMed.
- C. G. Joseph, G. L. Puma, A. Bono and D. Krishnaiah, Ultrason. Sonochem., 2009, 16, 583 CrossRef CAS PubMed.
- J. Luan, M. Chen and W. Hu, Int. J. Mol. Sci., 2014, 15, 9459 CrossRef CAS PubMed.
- J. Zhang, H. Yang, S. Xu, L. Yang, Y. Song, L. Jiang and Y. Dan, Appl. Catal., B, 2015, 174, 193 Search PubMed.
- M. B. Starr and X. Wang, Sci. Rep., 2013, 3, 1 Search PubMed.
- K.-S. Hong, H. Xu, H. Konishi and X. Li, J. Phys. Chem. Lett., 2010, 1, 997 CrossRef CAS.
- Y. Zhao, Q. Liao, G. Zhang, Z. Zhang, Q. Liang, X. Liao and Y. Zhang, Nano Energy, 2015, 11, 719 CrossRef CAS.
- N. R. Alluri, B. Saravanakumar and S.-J. Kim, ACS Appl. Mater. Interfaces, 2015, 7, 9831 CAS.
- K. I. Kakimoto, K. Fukata and H. Ogawa, Sens. Actuators, A, 2013, 200, 21 CrossRef CAS.
- J. Nunes-Pereira, V. Sencadas, V. Correia, V. F. Cardoso, W. Han, J. G. Rocha and S. Lanceros-Mendez, Composites, Part B, 2015, 72, 130 CrossRef CAS.
- E. S. Nour, M. O. Sandberg, M. Willander and O. Nur, Nano Energy, 2014, 9, 221 CrossRef CAS.
- A. P. Indolia and M. S. Gaur, J. Polym. Res., 2013, 20, 1 CAS.
- X. Cao, J. Ma, X. Shi and Z. Ren, Appl. Surf. Sci., 2003, 253, 2003 CrossRef.
- I. Losito, A. Amorisco, F. Palmisano and P. G. Zambonin, Appl. Surf. Sci., 2005, 240, 180 CrossRef CAS.
- S. Xu, Y. Qin, C. Xu, Y. Wei, R. Yang and Z. L. Wang, Nat. Nanotechnol., 2010, 5, 366 CrossRef CAS PubMed.
- R. Ghosh, M. Pusty and P. K. Guha, IEEE Trans. Nanotechnol., 2016, 15, 268 CrossRef CAS.
- M. D. Pre, A. Martucci, D. J. Martin, S. Lavina and V. D. Noto, J. Mater. Sci., 2015, 50, 2218 CrossRef.
- V. F. Cardoso, G. Minas and S. Lanceros-Méndez, Sens. Actuators, A, 2013, 192, 76 CrossRef CAS.
- Z. Chen, H. N. Dinh and E. Miller, Photoelectrochemical Water Splitting, Springer New York, New York, 2013 Search PubMed.
| This journal is © The Royal Society of Chemistry 2017 |

