 Open Access Article
Creative Commons Attribution 3.0 Unported Licence
Solvent-induced construction of two zinc supramolecular isomers: synthesis, framework flexibility, sensing properties, and adsorption of dye molecules†
Jiang-Feng
Song
 *,
Jing-Jing
Luo
,
Ying-Ying
Jia
,
Li-Dong
Xin
,
Zhi-Zhu
Lin
and
Rui-Sha
Zhou
*
Department of Chemistry, North University of China, Taiyuan, Shanxi 030051, P. R. China. E-mail: jfsong0129@nuc.edu.cn; rszhou0713@nuc.edu.cn
First published on 24th July 2017
Abstract
Two zinc supramolecular isomers, formulated as α-[Zn(cis-cppca)(H2O)]n (1) and β-[Zn(trans-cppca)(H2O)]n (2), have been synthesized under solvothermal conditions and fully characterized (H2cppca = 5-(3-carboxy-phenyl)-pyridine-2-carboxylic acid). Solvent-induced conformational isomerism of cppca2− ligand and framework isomerism of 1 and 2 are both observed. Each distorted [Zn(cis-cppca)]2 unit joined four equivalent ones in an abnormal 2D puckered layer in compound 1; however, compound 2 displays a 3-D open framework with larger bi-edge channels constructed by 1D Zn–O–Zn chains and trans-cppca bridges, in which the internal edge is a nearly hexagonal channel with an approximate dimension of 14.51 Å and the external edge is a circular channel with an approximate dimension of 19.26 Å. Fluorescent properties indicated that compound 1 displays an apparent fluorescence emission in acetone solvent; however, compound 2 was very sensitive to acetone molecules which results in nearly 100% fluorescence quenching. Moreover, compounds 1 and 2 might be promising luminescent probes for the detection of Fe3+. The dye adsorption experiments demonstrated that compound 2 showed good adsorption properties for MB and RhB molecules.
Introduction
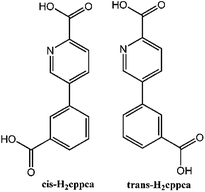
Supramolecular isomerism, which possesses the same molecular components but different network superstructures, represents an intriguing and important phenomenon in the construction of coordination compounds and has received considerable attention in recent decades.1 Many coordination polymers with supramolecular isomerism have been reported; however, controllable synthesis of supramolecular isomers still remains a long-term challenge because the self-assembly processes are often influenced by compositional and process parameters such as reaction temperature,2 solvent,3 template,4 light,5 reaction time,6 concentration effect,7 and pH value.2f,8 In a word, research on self-assembly, crystallization, and structure–property relationships for supramolecular isomerism is also meaningful for crystal engineering of coordination compounds.Supramolecular isomerism has been categorized by Moulton and Zaworotko into four different kinds: structural, conformational, catenane, and optical isomerism.1a Hitherto, the commonly mentioned strategy for the construction of conformational isomerism is the introduction of flexible ligands into the coordination frameworks due to the conformational flexibility of such species.8b,9 However, the conformational isomers of coordination compounds based on conformational flexibility of rigid multi-dentate ligands are rarely observed.10 As we know, there exists in C–N or C–C single bond between aromatic rings, thus such rigid ligands allow conformational changes due to a certain degree of rotations around the C–N or C–C bonds; for example, cis- and trans-conformations are easily observed in the conjugated N-heterocyclic dicarboxylic ligand, 5-(3-carboxy-phenyl)-pyridine-2-carboxylic acid (H2cppca), because the C–C single bonds between phenyl and pyridyl rings can rotate freely. If the orientation of the nitrogen atom of the pyridine group and the carboxyl group associated with the benzene ring in the H2cppca ligand is in the same direction, the conformation is defined as ‘cis’ configuration and if they are in the opposite direction, the configuration is assigned as ‘trans’ conformation (Scheme 1). Based on the above-mentioned analysis, the H2cppca ligand might be an effective component in the design of conformational isomers.
Following our interests regarding fluorescent materials,11 herein, we report two zinc supramolecular isomers formulated as α-[Zn(cis-cppca)(H2O)]n (1) and β-[Zn(trans-cppca)(H2O)]n (2). Compounds 1 and 2 were fully characterized by single-crystal X-ray diffraction, elemental analysis, IR spectroscopy, thermal analysis, and powder X-ray diffraction. The fluorescence properties of compounds 1 and 2 in the solid state and in various solvent emulsions also were investigated.
Experimental
Materials and physical measurements
All reagents and solvents were commercially available and used as received without further purification. Elemental analysis (C, H and N) was performed on a PerkinElmer 240C elemental analyzer. Infrared (IR) spectra were obtained with KBr Pellets on a PerkinElmer Spectrum One FTIR spectrometer in the range of 4000–400 cm−1 with a resolution (4.0 cm−1) and the scan's numbers (10). Powder X-ray diffraction (PXRD) patterns of the samples were recorded by a RIGAKU-DMAX2500 X-ray diffractometer using Cu-Kα radiation (λ = 1.542 Å) with a scanning rate of 10° min−1 and a step size of 0.02°. Thermogravimetric analysis (TGA) was performed on a PerkinElmer TGA-7000 thermogravimetric analyzer with a heating rate of 10 °C min−1. Emulsion and solid fluorescence spectra of compounds 1 and 2 were obtained on a HITACHI F-2700 fluorescence spectrophotometer at room temperature. Nitrogen sorption experiments were carried out on a surface area analyzer ASAP-2020. Scanning electron microscopy (SEM) was taken on a field emission scanning electron microscope (FESEM, JSM 7001-F, JEOL, Japan).Synthesis of compounds 1 and 2
![[thin space (1/6-em)]](https://www.rsc.org/images/entities/char_2009.gif) :
:![[thin space (1/6-em)]](https://www.rsc.org/images/entities/char_2009.gif) 3, 6 mL). After slowly cooling to room temperature, white acicular crystals of compound 2 were isolated and washed with distilled water. Yield: 33% (based on H2cppca). Elemental anal. calcd C13H9NO5Zn (324.6): C, 48.06; H, 2.77; N, 4.31. Found: C, 48.13; H, 2.73; N, 4.32. IR data (KBr, cm−1): 3437 (s), 2920(w), 1636(s), 1544(s), 1381(s), 1243(w), 1047(w), 772(m).
3, 6 mL). After slowly cooling to room temperature, white acicular crystals of compound 2 were isolated and washed with distilled water. Yield: 33% (based on H2cppca). Elemental anal. calcd C13H9NO5Zn (324.6): C, 48.06; H, 2.77; N, 4.31. Found: C, 48.13; H, 2.73; N, 4.32. IR data (KBr, cm−1): 3437 (s), 2920(w), 1636(s), 1544(s), 1381(s), 1243(w), 1047(w), 772(m).
Physical measurements
Elemental analysis (C, H, and N) was performed on a PerkinElmer 240C elemental analyzer. Infrared (IR) spectra were obtained with KBr Pellets on a PerkinElmer Spectrum One FTIR spectrometer in the range of 4000–400 cm−1 with a resolution (4.0 cm−1) and the scan's numbers (10). Powder X-ray diffraction (PXRD) patterns of the samples were recorded by a RIGAKU-DMAX2500 X-ray diffractometer using Cu-Kα radiation (λ = 1.542 Å) with a scanning rate of 10° min−1 and a step size of 0.02°. Thermogravimetric analysis (TGA) was performed on a PerkinElmer TGA-7000 thermogravimetric analyzer with a heating rate of 10 °C min−1. Solvent emulsion and solid fluorescence spectra of compounds 1 and 2 were obtained on a HITACHI F-2700 fluorescence spectrophotometer at room temperature.Single crystal structure determination
Crystal structures were determined by single-crystal X-ray diffraction. Reflection data were collected on a Bruker SMART CCD area-detector diffractometer (Mo-Kα radiation, graphite monochromator) at room temperature with ω-scan mode. Empirical absorption correction was applied to all data using SADABS. The structure was solved by direct methods and refined by full-matrix least squares on F2 using SHELXTL 97 software.12 Non-hydrogen atoms were refined anisotropically. All C-bound H atoms were refined using a riding model with Uiso(H) = 1.2. All calculations were carried out using SHELXTL 97. A larger 1D channel in compound 2 was observed, in which no any guest molecules are filled (the REM highest difference peak is 0.406), and the final structure of compound 2 wasn't treated through applying the SQUEEZE procedure. Crystallographic data and pertinent information are given in Table 1; selected bond lengths and angles in Table S1†.| a R 1 = Σ||Fo| − |Fc||/Σ|Fo|; wR2 = [Σw(Fo2 − Fc2)2/Σw(Fo2)2]1/2. | ||
|---|---|---|
| Compounds | 1 | 2 |
| Empirical formula | C13H9NO5Zn | C13H9NO5Zn |
| Formula weight | 323.57 | 324.6 |
| Crystal system | Monoclinic | Trigonal |
| Space group | P21/c |
R![[3 with combining macron]](https://www.rsc.org/images/entities/char_0033_0304.gif) |
| a/Å | 12.4729(5) | 31.2060(7) |
| b/Å | 7.8274(3) | 31.2060(7) |
| c/Å | 12.5069(6) | 10.5025(3) |
| α/° | 90 | 90 |
| β/° | 104.642(4) | 90 |
| γ/° | 90 | 120 |
| V/(Å3) | 1181.40(9) | 8857.3(4) |
| Z | 4 | 18 |
| ρ calc/g cm−3 | 1.819 | 1.095 |
| Absorption coef. | 2.098 | 1.259 |
| Reflns collected | 7637 | 7320 |
| Unique reflns (Rint) | 2152(0.0577) | 3493(0.0314) |
| Completeness | 99.6% | 99.8% |
| GooF | 1.086 | 0.862 |
| R 1, wR2[I > 2σ(I)]a | 0.0405, 0.0837 | 0.0361,0.1128 |
| R 1, wR2(all data) | 0.0629, 0.0962 | 0.0495, 0.1290 |
Results and discussion
Synthesis of compounds 1 and 2
Starting from the same reactants (ZnCl2 and H2cppca) in different solvent systems (H2O for compound 1, CH3CN/H2O mixed solvents for 2), compounds 1 and 2 were obtained; as indicated, the reaction solvents played an important role in formation of the isomers. When the same precursors reacted in a pure water system under 120 °C, compound 1 with 2D abnormal puckered layer containing cis-cppca2− was obtained. However, the 3D framework 2 with 1D bi-edge channels containing trans-cppca2− was obtained from the CH3CN/H2O mixed solvent systems. If CH3CN was substituted by the other organic solvents such as methanol, ethanol, DMF, etc., no precipitates were obtained in mixed DMF/H2O; however, white powders were obtained in mixed CH3OH/H2O or CH3CH2OH/H2O, and their PXRD are apparently different from that of compounds 1 and 2 (Fig. S1†). The acetonitrile molecules used in the reaction system were not incorporated into the final crystal lattice of compound 2, but acted as important reaction modulators, which may have greatly affected the conformational isomerism of cppca2− ligand and framework isomerism of compounds 1 and 2.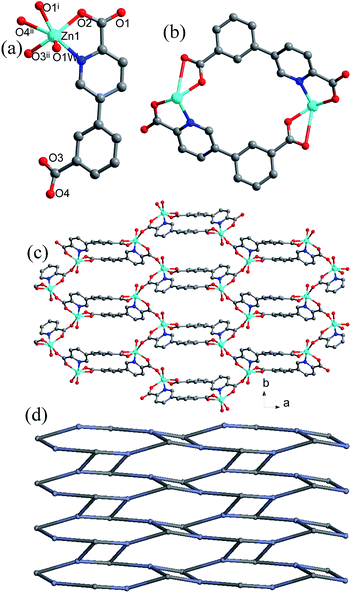 | ||
| Fig. 1 (a) The coordination environment of Zn center, (b) the [Zn(cppca)]2 unit, (c) the 2D abnormal puckered layer, and (d) the topology structure in compound 1. | ||
Two symmetry-related Zn centers and two cppca2− ligands adopting μ3-κN, O:κO′:κO′′, O′′′ coordination mode (Fig. S2a†) are connected into a [Zn(cppca)]2 unit, in which a distorted 18-membered ring with dimension of 5.15 × 6.39 Å2 is observed (Fig. 1b). Each distorted [Zn(cppca)]2 unit joined four equivalent ones into an abnormal 2D puckered layer through the Zn–O bonds, in which a 36-membered ring with the dimension of 7.83 × 12.94 Å2 is observed (Fig. 1c and d). Interestingly, the distorted 18-membered ring results in the formation of a 1D channel along the b axis (Fig. S3†). Notably, the 2D layers are interdigitated with each other into a 3D supramolecular network through π⋯π interactions among the phenyl rings of cppca2− ligands in ⋯ABAB··· arrangement; significantly, the 1D channels and 36-membered rings are all blocked by the neighboring layer, resulting in the formation of a 3D nonporous supramolecular close-packed network (Fig. S4†).
![[3 with combining macron]](https://www.rsc.org/images/entities/char_0033_0304.gif) . The Zn center with slightly distorted octahedral geometry is coordinated with five oxygen and one nitrogen from four independent cppca2− anions and one water molecule, differently from the trigonal bipyramidal geometry in compound 1 (Fig. 2a). The Zn–O/N bond distances range between 2.036(2) and 2.173(2) Å, and the O/N–Zn–O/N bond angles range from 78.38(8) to 173.94(8)°.
. The Zn center with slightly distorted octahedral geometry is coordinated with five oxygen and one nitrogen from four independent cppca2− anions and one water molecule, differently from the trigonal bipyramidal geometry in compound 1 (Fig. 2a). The Zn–O/N bond distances range between 2.036(2) and 2.173(2) Å, and the O/N–Zn–O/N bond angles range from 78.38(8) to 173.94(8)°.
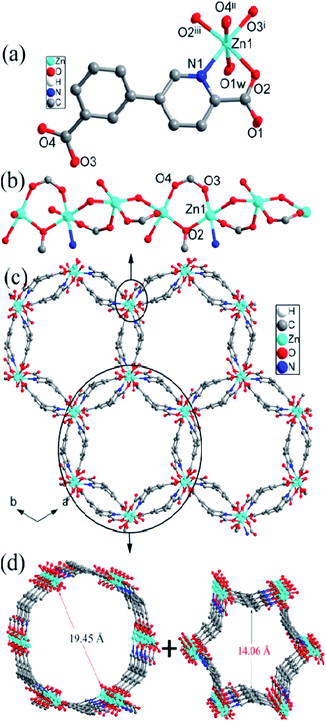 | ||
| Fig. 2 (a) The coordination environment of Zn center, (b) 1D Zn–O–Zn chain, (c) the 3D framework with bi-edge channels, and (d) the external and internal edges of the bi-edge channel in compound 2. | ||
The Zn2+ ions are connected into an infinite 1D Zn–O–Zn chain by sharing a single oxygen atom (O1) and a syn–syn carboxylate groups from cppca2− ligands and the corresponding Zn⋯Zn separation is 3.63 Å (Fig. 2b). Each 1D Zn–O–Zn chain interconnects with three equivalent ones through double cppca2− bridges adopting μ4-κN, O:κO:κO′′:O′′′ (Fig. S1b†) and results in the formation of a 3-D open framework with larger 1-D channels (Fig. 2c). Interestingly, the 1D channel may be regarded as a bi-edge channel, the internal edge is a nearly hexagonal channel with an approximate dimension of 14.51 Å and the external edge is a circular channel with an approximate dimension of 19.26 Å (Fig. 2d). Notably, an elliptical channel with the dimension of 4.51 × 11.39 Å2 along the c direction is observed between the internal and external edges of the channel.
Notably, no guest solvents were observed in the channels; however, the framework of compound 2 shows a higher stability due to presence of the rigid bi-edge channel. Calculation performed using PLATON reveals a total solvent-accessible volume equaling to 3948.4 Å3 per unit cell, which counts for 44.6% of the cell volume,13 offering potential possibilities of adsorption/separation for gas and liquid guest materials, etc. Compound 2 is constructed from μ4-cppca2− and 4-connected Zn centers, so the resulting framework can be simplified into a binodal 4,4-connected net with Schlafli symbol {43.62.8} (Fig. S5†), indicating a very rare ptr topology according to the classification by the Reticular Chemistry Structure Source.14
Characterization
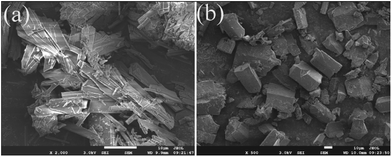
The experimental and simulated PXRD patterns of compounds 1 and 2 are shown in Fig. S6.† The simulated PXRD patterns from the single-crystal X-ray diffraction data agree with the observed ones, indicating the phase purity of these crystalline products. Different intensities between the simulated and experimental patterns may be caused by a preferred orientation of the powder samples. In order to evaluate the stability of compound 1 and 2 for the solvents and water, the samples of compounds 1 and 2 (30 mg) were immersed in water, ethanol, acetone, acetonitrile (CH3CN), N,N-dimethylformamide (DMF), and trichloromethane (CHCl3), respectively, then treated by ultrasonication for 30 minutes and kept for 12 hours. The power patterns of compounds 1 and 2 in the different organic solvents matched well with their simulated patterns, demonstrating the excellent stability of 1 under these conditions (Fig. S7†). The SEM images of compounds 1 and 2 after ultrasonication for 30 minutes indicated their crystalline properties still strongly remain (Fig. 3).The FT-IR spectra of compounds 1 and 2 with the same peak positions and shapes are displayed in Fig. S8.† The wide peak at 3437 cm−1 belongs to O–H stretching of coordination water molecules. Absorption peaks located at 1636 and 1381 cm−1 can be ascribed to asymmetric and symmetric stretching vibrations of carboxylate groups, respectively.
Additionally, to investigate the thermal stability of 1 and 2, their thermal behaviors were studied from 22 °C to 750 °C in air (Fig. S9†). The TGA curves of compounds 1 and 2 have similar thermal behaviors indicating a two-step weight loss. The first weight loss corresponded to loss of water molecules in the range of 70–150 °C (obsd 6.21% for 1, 5.58% for 2; calcd 5.56%); thus, the framework of compound 1 is thermally stable up to 320 °C. However, compound 2 displays higher thermal stability than compound 1 because it doesn't begin to decompose until 400 °C. The second weight loss of 1 and 2 were characteristic of the combustion of organic ligands (obsd. 68.12% for 1, 68.99% for 2; calcd. 69.41%). The total weight loss of compounds 1 and 2 amounted to 74.33% and 74.55%, respectively, and the remaining weight corresponds to the formation of ZnO (obsd. 25.67% for 1, 25.45% for 2; calcd. 25.03% for 1 and 2).
Solid fluorescence properties of compounds 1 and 2
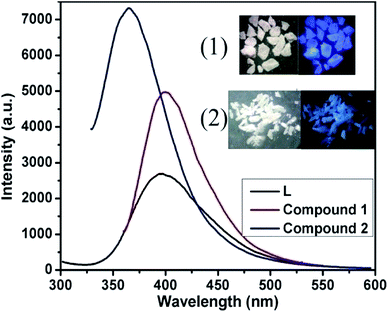
Fluorescent sensors based on coordination compounds have been attracting more attentions owing to not only their fascinating and tunable structures but also high sensitivity, low cost, simplicity, portability, short response time, and so on.15 Solid-state photoluminescence of compounds 1, 2, and H2cppca were performed at room temperature (Fig. 4).Luminescence spectra of H2cppca and compound 1, which are very similar in terms of position and band shape, both exhibit blue light emission with a maximum at about 400 nm when excited at 320 nm, attributed to intraligand charge transfer (LLCT), which may be due to π* → π or π* → n transition of the cis-cppca2− ligands. Interestingly, a blue emission band at around 365 nm is observed in compound 2 when excited at 320 nm. Compared with 1, the emission maximum of compounds 2 is apparently blue-shifted by 35 nm, as might be related to intraligand charge transfer of trans-cppca2− ligands, different from that of compound 1. Notably, the fluorescence intensities of compounds 1 and 2 are apparently stronger than that of H2cppca ligand under the same experimental conditions, which may be attributed to the unique coordination of ligand cppca2− to the Zn(II) centers, thus increasing conformational rigidity, and thereby reducing non-radiative energy loss.16
Sensing properties for small organic molecules
The blue luminescence of compounds 1 and 2 encouraged us to use them as hosts for the sensing of small molecules. Different solvent emulsions were prepared as follows: the ground powders of compound 1 or 2 (0.5 mg) were immersed in water and common organic solvents (4.00 mL, acetone, acetonitrile (CH3CN), benzene, cyclohexane, ethanol (EtOH), 1,2-ethanediol, dimethylacetamide (DMA), formaldehyde (HCHO), H2O, methanol (MeOH), n-butylalcohol, N,N-dimethylformamide (DMF), tetrahydrofuran (THF), and trichloromethane (CHCl3)), followed by ultrasonication for 30 minutes, and then corresponding PL spectra were obtained. The emission spectra of compounds 1 and 2 (λex = 320 nm) in different solvent emulsions indicate that the maximum emission peaks and fluorescent intensities largely depend on the solvent molecules. For 1, the maximum emission peaks in most solvent emulsions blue-shifted 15 nm compared with its solid-state emission spectrum except that of 1-CHCl3 and 1-benzene red-shift about 10 nm (Fig. 5a), and the maximum luminescence intensity of 1-solvent emulsions gradually decreased in the following order: EtOH > DMF > CH3CN > DMA > MeOH > CHCl3 > n-butylalcohol > acetone > ethanediol > H2O > benzene > HCHO > THF > cyclohexane. Apparently, all the solvent emulsions of compound 1 exhibit blue light emission under UV light (Fig. 5b). For 2, the maximum emission peaks of 2-CHCl3 and 2-cyclohexane emulsions blue-shifted 10 nm compared with its solid-state emission spectrum; however, that of the other emulsions almost remain unchanged, and the decreasing order of luminescence intensity is: EtOH > CHCl3> CH3CN > n-butylalcohol > THF > benzene > MeOH > HCHO > ethanediol > cyclohexane > DMF > H2O > DMA > acetone (Fig. 6a). The above-mentioned phenomena may be ascribed to interactions between a homogeneously dispersible framework and solvent molecules with different polarities.17 Obviously, ethanol emulsions for 1 and 2 both exhibit the strongest fluorescence emission; notably, 1-acetone emulsion exerted the stronger luminescence emission, while acetone was the most effective quencher for compound 2, resulting in a nearly 100% fluorescence quenching. Apparently, emissive visible blue light from the acetone emulsion of compound 2 is darker than that from the other emulsions under UV light (Fig. 6b). Such solvent-dependent luminescence quenching properties of compound 2 might be a promising luminescent probe for detecting acetone molecules.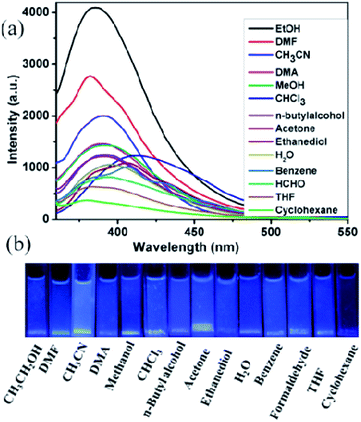 | ||
| Fig. 5 (a) Emission spectra of compound 1 in different solvents when excited at 320 nm, (b) the luminescence photographs of compound 1 in different solvents under UV light. | ||
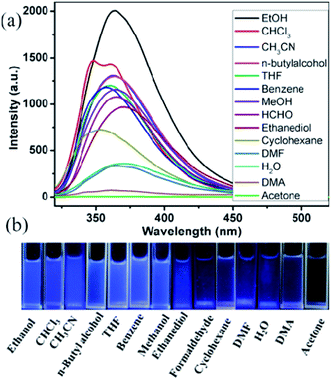 | ||
| Fig. 6 (a) Emission spectra in different solvents when excited at 320 nm, (b) the luminescence photographs of compound 2 in different solvents under UV light. | ||
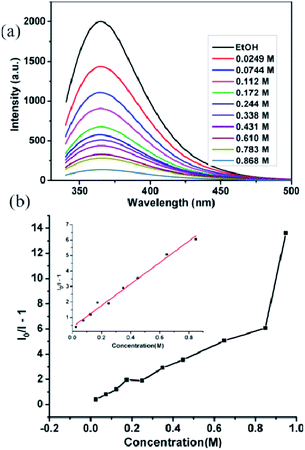
To gain a deeper insight regarding the sensing properties toward acetone for compound 2, 0.5 mg samples of compound 2 dispersed in ethanol were considered as the standard emulsion, and a batch of emulsions with gradually increased acetone concentration were prepared and monitored by fluorescent spectra. As shown in Fig. 7a, the fluorescence intensity of 2-ethanol emulsion has a significant decrease with the increase of acetone concentration. When the concentration of acetone increased to 0.868 M, 97.2% fluorescence intensity was completely quenched. The quenching effect can be illustrated by the Stern–Volmer equation: I0/I = 1 + KSV[M], where I0 and I are the luminescence intensity of 2-ethanol emulsions in the absence and presence of acetone, respectively, [M] is the acetone concentration, and KSV is the quenching coefficient of the acetone.18 The curve of (I0/I − 1) vs. acetone concentration is shown in Fig. 7b; when the acetone concentration is very low, a linear plot was observed and the corresponding slope (KSV value) is calculated as 7.532 M−1. The linear correlation coefficient (R) is 0.99044; however, at higher concentrations, the plot deviates from linearity and bends upwardly. The above results indicate that the quenching effect of acetone for compound 2 fits the Stern–Volmer model well.
Under the same experimental conditions and excitation wavelength, compounds 1 and 2, with different topology structures, displayed different fluorescence properties: compound 1 displayed an apparent fluorescence emission in acetone solvent; however, compound 2 was very sensitive to the acetone molecules and resulted in a nearly 100% fluorescence quenching at 0.868 M. This phenomenon rules out the possibility of competition for absorption of the light source energy between as-synthesized complexes and acetone molecules.19 Although the mechanism for such quenching effects by acetone molecules is still not clear, we speculate that it may be related to conformational isomerism of cppca2− ligands in compounds 1 and 2.
Sensing properties for metal ions
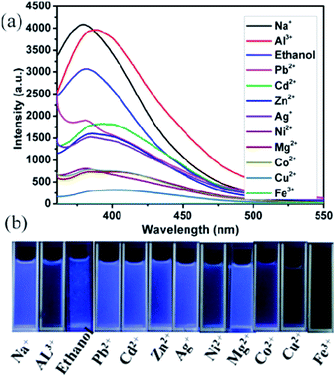
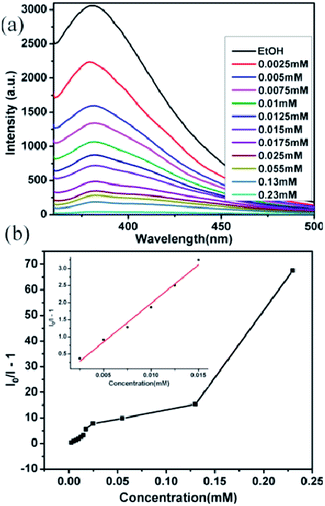
Moreover, we also investigated the sensing (detection) ability of compounds 1 and 2 for different metal ions. Powders of compound 1 or 2 (0.5 mg) were immersed in different ethanol solutions (4 mL) including 10−2 M of M(NO3)x (M = Na+, Ag+, Co2+, Cu2+, Zn2+, Cd2+, Mg2+, Pb2+, Ni2+, Al3+ and Fe3+), and the corresponding luminescent spectra of ethanol emulsions were measured after ultrasonication for approximately 30 min. The luminescence intensities of 1-ethanol emulsions were largely dependent on the species of metal ion (Fig. 8a); the addition of Al3+ and Na+ significantly enhanced the luminescence intensities of ethanol emulsions, while other metal ions show different levels of the quenching effect; particularly, Fe3+ had a nearly 100% fluorescence quenching. Moreover, the emissive visible blue light from 1-ethanol solution with Fe3+ ions is darker than that from the other emulsions under UV light (Fig. 8b). To further study detection sensitivity toward the Fe3+ ion, the luminescence intensity of 1-ethanol emulsion was measured with gradually increased Fe3+ concentration. As shown in Fig. 9a, the luminescence intensity is heavily dependent on Fe3+ concentration, and when Fe3+ concentration reached 0.23 mM, the corresponding emission intensity attenuated by approximately 99.34%. According to the Stern–Volmer equation: I0/I = 1 + KSV[M], where I0 and I are the luminescence intensity of 1-ethanol emulsion without and with Fe3+, respectively, [M] is the molar concentration of Fe3+ ion, and KSV is the quenching coefficient of Fe3+ ion, a nearly linear plot of (I0/I − 1) vs. Fe3+ concentration was observed at low concentrations and the corresponding quenching constant (KSV) was 2.26 × 10⁵ M−1 (Fig. 9b). Similarly, Fe3+ also displayed the most effective quenching effects for compound 2 and the corresponding KSV was 1.56 × 10⁵ M−1 (Fig. S10 and S11†). These results reveal that compounds 1 and 2 might be promising luminescent probes for the detection of Fe3+.Dye adsorption properties of compound 2
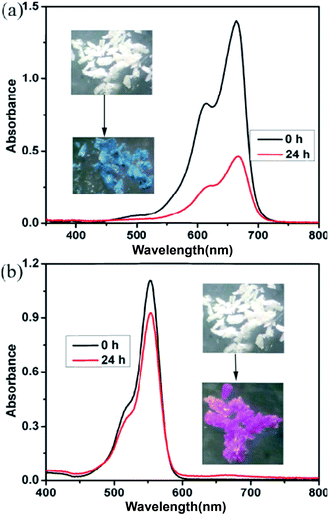
To evaluate gas accessible porosity of compound 2, the samples were immersed in MeOH for 12 hours and then outgassed overnight in vacuum at 80 °C; unfortunately, PXRD analysis showed amorphization of the samples. Moreover, the non-activated compounds 2 have no significant adsorption for nitrogen (Fig. S12†).Considering the porous structure in the framework of 2, its dye adsorption properties were investigated at room temperature. Two organic dyes i.e., methylene blue (MB) and rhodamine B (RhB), with different molecular sizes and that are widely used for dye adsorption experiments, were selected and UV/vis spectrophotometry was used to monitor their concentrations to evaluate adsorption performance of compound 2. Typically, 10 mg of non-activated compound 2 was immersed into 20 mL of dye-containing aqueous solution (2 × 10⁻⁵ mol L−1) at room temperature for about 24 h. Apparently, after compound 2 adsorbed MB and RhB, the corresponding white crystals gradually became blue and red, respectively, showing certain degree of adsorption for MB and RhB dyes. Moreover, the UV spectra of MB and RhB aqueous solutions revealed that the characteristic adsorption peaks were obviously decreased after dye adsorption (Fig. 10). Calculations show that compound 2 effectively adsorbed 67.4% MB and 16.2% RhB from the corresponding dye aqueous solutions within 24 h. According to the following equation: Q = V(C0 − C)/m, [Q (mg g−1) is the adsorption capacity; V (L) is the volume of the dye solution; C0 and C are the initial and the equilibrium concentrations of dye molecules (mg L−1); m (g) is the weight of the absorbent, and the adsorption capacities of MB and RhB are 5.02 and 1.56 mg g−1, respectively]. Compound 2 demonstrates good adsorption properties for MB and RhB molecules, which mainly results from interactions between the dye molecules and compound 2, similarly to previous reports.20 The difference in adsorption between MB and RhB may be ascribed to the shape and size of the dyes; the MB dye with a smaller molecular size may be more easily adsorbed, while larger RhB molecules are more slowly adsorbed.
The luminescent properties of compound 2 after adsorbing MB and RhB were further investigated (abbreviated as MB@2 and RhB@2, respectively), and the corresponding spectra of MB@2 and RhB@2 are displayed in Fig. 11. The luminescence spectra of MB@2 and pure compound 2, which are very similar in terms of position and band shape, both exhibit blue light emission with a maximum at about 365 nm when excited at 320 nm; however, RhB@2 exhibits two emission peaks at 365 and 582 nm in the solid state at room temperature when excited at 345 nm. The emission at 365 nm is attributed to the intraligand charge transfer of trans-cppca2− ligands, whereas the emission at 582 nm presumably originates from the adsorbed rhodamine B molecules in RhB@2. Interestingly, RhB@2 exhibits red light emission under UV illumination at 365 nm; however, MB@2 revealed blue light emission. Moreover, the fluorescence intensities of MB@2 and RhB@2 are higher than that of pure compound 2. This strategy will facilitate extensive research on photofunctional materials exhibiting dual emissions and lead to some practically useful materials in the near future.
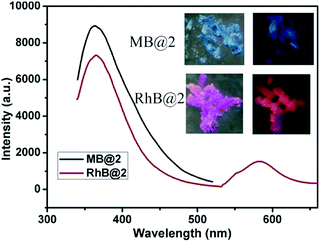 | ||
| Fig. 11 Emission spectra of MB@2 and RhB@2 when excited at 320 nm and 345 nm, respectively. Photo images of MB@2 and RhB@2 under daylight (left) and UV illumination (right) at 365 nm, respectively. | ||
Conclusions
Two zinc supramolecular isomers were synthesized under two different solvent systems and fully characterized. Compound 1 displayed an abnormal 2D puckered layer constructed by distorted [Zn(cppca)]2 units; however, a 3-D open framework with larger bi-edge channels, in which the internal edge is a nearly hexagonal channel with an approximate dimension of 14.51 Å and the external edge is a circular channel with an approximate dimension of 19.26 Å, was observed in compound 2. The fluorescent properties of compounds 1 and 2 were investigated in their solid states and in various solvent emulsions. Results indicated that compound 1 displayed an apparent fluorescence emission in acetone solvent; however, compound 2 resulted in a nearly 100% fluorescence quenching with acetone molecules. Moreover, compound 2 demonstrates good adsorption properties for MB and RhB molecules and the corresponding adsorption capacities are 5.02 and 1.56 mg g−1, respectively.Acknowledgements
This work was supported by the National Natural Science Foundation of China (No. 21201155 and 21371159), the Natural Science Young Scholars Foundation of Shanxi Province (No. 2012021007-5 and 2013021008-6), Program for the Top Young Academic Leaders of Higher Learning Institutions of Shanxi and 131 Talent Plan of Higher Learning Institutions of Shanxi, respectively.Notes and references
- (a) B. Moulton and M. J. Zaworotko, Chem. Rev., 2001, 101, 1629–1658 CrossRef CAS; (b) J.-P. Zhang, X.-C. Huang and X.-M. Chen, Chem. Soc. Rev., 2009, 38, 2385–2396 RSC.
- (a) D. Sun, Y. Ke, T. M. Mattox, B. A. Ooro and H. C. Zhou, Chem. Commun., 2005, 5447–5449 RSC; (b) Z.-G. Li, G.-H. Wang, H.-Q. Jia, N.-H. Hu and J.-W. Xu, CrystEngComm, 2007, 9, 882–887 RSC; (c) P. Kanoo, K. L. Gurunat and T. K. Maji, Cryst. Growth Des., 2009, 9, 4147–4156 CrossRef CAS; (d) J.-J. Wu, W. Xue, M.-L. Cao, Z.-P. Qiao and B.-H. Ye, CrystEngComm, 2011, 13, 5495–5501 RSC; (e) Y.-L. Qin, J. Liu, J.-J. Hou, R.-X. Yao and X.-M. Zhang, Cryst. Growth Des., 2012, 12, 6068–6073 CrossRef CAS; (f) M.-L. Han, X.-H. Chang, X. Feng, L.-F. Ma and L.-Y. Wang, CrystEngComm, 2014, 16, 1687–1695 RSC; (g) Y. Jeon, S. Cheon, S. Cho, K. Y. Lee, T. H. Kim and J. Kim, Cryst. Growth Des., 2014, 14, 2105–2109 CrossRef CAS; (h) J.-Y. Wu, C.-C. Hsiao and M.-H. Chiang, Cryst. Growth Des., 2014, 14, 4321–4328 CrossRef CAS; (i) S.-S. Hou, X. Huang, J.-G. Guo, S.-R. Zheng, J. Lei, J.-B. Tan, J. Fan and W.-G. Zhang, CrystEngComm, 2015, 17, 947–959 RSC; (j) A. Dikhtiarenko, P. Serra-Crespo, S. Castellanos, A. Pustovarenko, R. Mendoza-Meroño, S. García-Granda and J. Gascon, Cryst. Growth Des., 2016, 16, 5636–5645 CrossRef CAS.
- (a) T. L. Hennigar, D. C. MacQuarrie, P. Losier, R. D. Rogers and M. J. Zaworotko, Angew. Chem., Int. Ed., 1997, 36, 972–973 CrossRef CAS; (b) H. Abourahma, B. Moulton, V. Kravtsov and M. J. Zaworotko, J. Am. Chem. Soc., 2002, 124, 9990–9991 CrossRef CAS; (c) X.-D. Chen, M. Du and T. C. W. Mak, Chem. Commun., 2005, 4417–4419 RSC; (d) L. Q. Ma and W. B. Lin, J. Am. Chem. Soc., 2008, 130, 13834–13835 CrossRef CAS; (e) J.-B. Lin, J.-P. Zhang, W.-X. Zhang, W. Xue, D.-X. Xue and X.-M. Chen, Inorg. Chem., 2009, 48, 6652–6660 CrossRef CAS; (f) M. R. Kishan, J. Tian, P. K. Thallapally, C. A. Fernandez, S. J. Dalgarno, J. E. Warren, B. P. McGrail and J. L. Atwood, Chem. Commun., 2010, 46, 538–540 RSC; (g) D. Sun, S. Ma, J. M. Simmons, J. R. Li, D. Yuan and H. C. Zhou, Chem. Commun., 2010, 46, 1329–1331 RSC; (h) S. S. Chen, M. Chen, S. Takamizawa, P. Wang, G. C. Lv and W. Y. Sun, Chem. Commun., 2011, 47, 4902–4904 RSC; (i) J. P. Zhang, X. L. Qi, C. T. He, Y. Wang and X. M. Chen, Chem. Commun., 2011, 47, 4156–4158 RSC; (j) P. Kanoo, R. Matsuda, R. Kitaura, S. Kitagawa and T. K. Maji, Inorg. Chem., 2012, 51, 9141–9143 CrossRef CAS; (k) J. Li, S. Meng, J. Zhang, Y. Song, Z. Huang, H. Zhao, H. Wei, W. Huang, M. P. Cifuentes, M. G. Humphrey and C. Zhang, CrystEngComm, 2012, 14, 2787–2796 RSC; (l) L. K. Das, A. M. Kirillov and A. Ghosh, CrystEngComm, 2014, 16, 3029–3039 RSC; (m) X.-L. Qi, J.-W. Ye, R.-B. Lin, P.-Q. Liao, S.-Y. Liu, C.-T. He, J.-P. Zhang and X.-M. Chen, Inorg. Chem. Front., 2015, 2, 136–140 RSC; (n) H. Ju, I.-H. Park, E. Lee, S. Kim, J. H. Jung, M. Ikeda, Y. Habata and S. S. Lee, CrystEngComm, 2016, 18, 1600–1608 RSC; (o) I.-H. Park, H. Ju, T. S. Herng, Y. Kang, S. S. Lee, J. Ding and J. J. Vittal, Cryst. Growth Des., 2016, 16, 7278–7285 CrossRef CAS.
- (a) C.-B. Ma, C.-N. Chen and Q.-T. Liu, CrystEngComm, 2005, 7, 650–655 RSC; (b) S. Q. Ma, D. F. Sun, M. Ambrogio, J. A. Fillinger, S. Parkin and H. C. Zhou, J. Am. Chem. Soc., 2007, 129, 1858–1859 CrossRef CAS; (c) J. P. Zhang and S. Kitagawa, J. Am. Chem. Soc., 2008, 130, 907–917 CrossRef CAS PubMed; (d) M. Chen, H. Zhao, C.-S. Liu, X. Wang, H.-Z. Shi and M. Du, Chem. Commun., 2015, 51, 6014–6017 RSC.
- W.-C. Song, X.-Z. Cui, Z.-Y. Liu, E.-C. Yang and X.-J. Zhao, Sci. Rep., 2016, 6, 34870 CrossRef CAS PubMed.
- (a) J.-S. Hu, L. Qin, M.-D. Zhang, X.-Q. Yao, Y.-Z. Li, Z.-J. Guo, H.-G. Zheng and Z.-L. Xue, Chem. Commun., 2012, 48, 681–683 RSC; (b) Y. S. Tan, A. L. Sudlow, K. C. Molloy, Y. Morishima, K. Fujisawa, W. J. Jackson, W. Henderson, S. N. B. A. Halim, S. W. Ng and E. R. T. Tiekink, Cryst. Growth Des., 2013, 13, 3046–3056 CrossRef CAS.
- (a) M. Oh, G. B. Carpenter and D. A. Sweigart, Angew. Chem., Int. Ed., 2002, 41, 3650–3653 CrossRef CAS; (b) Z.-M. Hao and X.-M. Zhang, Cryst. Growth Des., 2007, 7, 64–68 CrossRef CAS; (c) P. Cui, J. Dou, D. Sun, F. Dai, S. Wang, D. Sun and Q. Wu, CrystEngComm, 2011, 13, 6968–6971 RSC; (d) J.-K. Sun, X.-H. Jin, L.-X. Cai and J. Zhang, J. Mater. Chem., 2011, 21, 17667–17672 RSC.
- (a) A. B. Lago, R. Carballo, S. Rodríguez-Hermida and E. M. Vázquez-López, CrystEngComm, 2013, 15, 1563–1570 RSC; (b) R. Peng, M. Li, S.-R. Deng, Z.-Y. Li and D. Li, CrystEngComm, 2010, 12, 3670–3675 RSC; (c) R.-P. Ye, X. Zhang, L. Zhang, J. Zhang and Y.-G. Yao, Cryst. Growth Des., 2016, 16, 4012–4020 CrossRef CAS; (d) P.-X. Yin, J. Zhang, Z.-J. Li, Y.-Y. Qin, J.-K. Cheng, L. Zhang, Q.-P. Lin and Y.-G. Yao, Cryst. Growth Des., 2009, 9, 4884–4896 CrossRef CAS.
- (a) X. Yang, Y. Wang, H.-L. Zhou, Y.-J. Liu, C.-T. He, R.-B. Lin and J.-P. Zhang, CrystEngComm, 2015, 17, 8843–8849 RSC; (b) B. Manna, S. Singh, A. Karmakar, A. V. Desai and S. K. Ghosh, Inorg. Chem., 2015, 54, 110–116 CrossRef CAS; (c) M. Chen, H. Zhao, C.-S. Liu, X. Wang, H.-Z. Shi and M. Du, Chem. Commun., 2015, 51, 6014–6017 RSC; (d) H. Wang, J. Yang and T. C. W. Mak, New J. Chem., 2014, 38, 4690–4695 RSC; (e) R. Haldar, S. K. Reddy, V. M. Suresh, S. Mohapatra, S. Balasubramanian and T. K. Maji, Chem.–Eur. J., 2014, 20, 4347–4356 CrossRef CAS; (f) S. Biswas, C. J. Gómez-García, J. M. Clemente-Juan, S. Benmansour and A. Ghosh, Inorg. Chem., 2014, 53, 2441–2449 CrossRef CAS; (g) D.-S. Chen, L.-B. Sun, Z.-Q. Liang, K.-Z. Shao, C.-G. Wang, Z.-M. Su and H.-Z. Xing, Cryst. Growth Des., 2013, 13, 4092–4099 CrossRef CAS; (h) B. Chakraborty, P. Halder and T. K. Paine, Dalton Trans., 2011, 40, 3647–3654 RSC; (i) K. M. Fromm, J. L. S. Doimeadios and A. Y. Robin, Chem. Commun., 2005, 4548–4550 RSC; (j) T. A. Bowden, H. L. Milton, A. M. Z. Slawin and P. Lightfoot, Dalton Trans., 2003, 936–939 RSC; (k) T. L. Hennigar, D. C. MacQuarrie, P. Losier, R. D. Rogers and M. J. Zaworotko, Angew. Chem., Int. Ed., 1997, 36, 972–973 CrossRef CAS.
- (a) B. Hu, T. Tao, Z.-Y. Bin, Y.-X. Peng, B.-B. Ma and W. Huang, Cryst. Growth Des., 2014, 14, 300–309 CrossRef CAS; (b) J.-Y. Lee, C.-Y. Chen, H. M. Lee, E. Passaglia, F. Vizza and W. Oberhauser, Cryst. Growth Des., 2011, 11, 1230–1237 CrossRef CAS.
- (a) J.-F. Song, Y.-Y. Jia, R.-S. Zhou, S.-Z. Li, X.-M. Qiu and J. Liu, RSC Adv., 2017, 7, 7217–7226 RSC; (b) J. F. Song, S. Z. Li, R. S. Zhou, J. Shao, X. M. Qiu, Y. Y. Jia, J. Wang and X. Zhang, Dalton Trans., 2016, 45, 11883–11891 RSC; (c) J.-F. Song, Y. Li, R.-S. Zhou, T.-P. Hu, Y.-L. Wen, J. Shao and X.-B. Cui, Dalton Trans., 2016, 45, 545–551 RSC.
- G. M. Sheldrick, Acta Crystallogr., Sect. A: Found. Crystallogr., 2008, 64, 112–122 CrossRef CAS.
- A. L. Spek, PLATON, Molecular Geometry Program, University of Utrecht, The Netherlands, 1999 Search PubMed.
- (a) V. A. Blatov, A. P. Shevchenko and D. M. Proserpio, Cryst. Growth Des., 2014, 14, 3576–3586 CrossRef CAS; (b) W. Huang, J. Jiang, D. Wu, J. Xu, B. Xue and A. M. Kirillov, Inorg. Chem., 2015, 54, 10524–10526 CrossRef CAS; (c) M. O'keeffe, M. A. Peskov, S. J. Ramsden and O. M. Yaghi, Acc. Chem. Res., 2008, 41, 1782–1789 CrossRef.
- (a) J. W. Steed, Chem. Soc. Rev., 2009, 38, 506–519 RSC; (b) L. E. Kreno, K. Leong, O. K. Farha, M. Allendorf, R. P. V. Duyne and J. T. Hupp, Chem. Rev., 2012, 112, 1105–1125 CrossRef CAS; (c) X. Sun, Y. Wang and Y. Lei, Chem. Soc. Rev., 2015, 44, 8019–8061 RSC; (d) X. Zhou, S. Lee, Z. Xu and J. Yoon, Chem. Rev., 2015, 115, 7944–8000 CrossRef CAS; (e) W. Dan, X. Liu, M. Deng, Y. Ling, Z. Chen and Y. Zhou, Dalton Trans., 2015, 44, 3794–3800 RSC; (f) H. He, L. Zhang, M. Deng, Z. Chen, Y. Ling, J. Chen and Y. Zhou, CrystEngComm, 2015, 17, 2294–2300 RSC; (g) D. Wang, W. Zhang, J. Sun, Y. Ling, Z. Chen and Y. Zhou, ChemistrySelect, 2016, 1, 1917–1920 CrossRef CAS.
- S. S. Chen, Z. S. Bai, J. Fan, G. C. Lv, Z. Su, M. S. Chen and W. Y. Sun, CrystEngComm, 2010, 12, 3091–3104 RSC.
- (a) S. R. Zhang, D. Y. Du, J. S. Qin, S. J. Bao, S. L. Li, W. W. He, Y. Q. Lan, P. Shen and Z. M. Su, Chem.–Eur. J., 2014, 20, 3589–3594 CrossRef CAS; (b) L. L. Wen, X. F. Wang, H. Shi, K. L. Lv and C. G. Wang, RSC Adv., 2016, 6, 1388–1394 RSC; (c) S. Pramanik, Z. C. Hu, X. Zhang, C. Zheng, S. Kelly and J. Li, Chem.–Eur. J., 2013, 19, 15964–15971 CrossRef CAS; (d) Y. X. Zhu, Z. W. Wei, M. Pan, H. P. Wang, J. Y. Zhang and C. Y. Su, Dalton Trans., 2016, 45, 943–950 RSC; (e) M. J. Zhang, H. X. Li, H. Y. Li and J. P. Lang, Dalton Trans., 2016, 45, 17759–17769 RSC.
- (a) X. Sun, Y. Wang and Y. Lei, Chem. Soc. Rev., 2015, 44, 8019–8061 RSC; (b) C. Zhang, Y. Yan, Q. Pan, L. Sun, H. He, Y. Liu, Z. Liang and J. Li, Dalton Trans., 2015, 44, 13340–13346 RSC; (c) Y.-F. Li, D. Wang, Z. Liao, Y. Kang, W.-H. Ding, X.-J. Zheng and L.-P. Jin, J. Mater. Chem. C, 2016, 4, 4211–4217 RSC.
- F.-Y. Yi, W. Yang and Z.-M. Sun, J. Mater. Chem., 2012, 22, 23201–23209 RSC.
- (a) X. Jing, C. He, Y. Yang and C. Duan, J. Am. Chem. Soc., 2015, 137, 3967–3974 CrossRef CAS; (b) J. A. Johnson, X. Zhang, T. C. Reeson, Y. S. Chen and J. Zhang, J. Am. Chem. Soc., 2014, 136, 15881–15584 CrossRef CAS; (c) F. Y. Yi, J. P. Li, D. Wu and Z. M. Sun, Chem.–Eur. J., 2015, 21, 11475–11482 CrossRef CAS; (d) F.-Y. Yi, W. Zhu, S. Dang, J.-P. Li, D. Wu, Y. Li and Z.-M. Sun, Chem. Commun., 2015, 51, 3336–3339 RSC.
Footnote |
| † Electronic supplementary information (ESI) available: Table S1, Fig. S1–S12 and X-ray crystallographic files in CIF format of compounds 1 and 2. CCDC 1538368–1538369. For ESI and crystallographic data in CIF or other electronic format see DOI: 10.1039/c7ra05049f |
| This journal is © The Royal Society of Chemistry 2017 |

