DOI:
10.1039/C7RA05044E
(Paper)
RSC Adv., 2017,
7, 38699-38713
Melatonin-enhanced biosynthesis of antimicrobial AgNPs by improving the phytochemical reducing potential of a callus culture of Ocimum basilicum L. var. thyrsiflora
Received
4th May 2017
, Accepted 20th July 2017
First published on 7th August 2017
Abstract
Herein, we describe the green synthesis of silver nanoparticles (AgNPs) using Ocimum basilicum L. var. thyrsiflora leaf derived callus extracts formed in response to 9.0 μM of thidiazuron (TDZ) alone and a combination of 9.0 μM of TDZ + 15 μM of melatonin (Mel) which act both as reducing and stabilizing agents. Based on the phytochemical analysis, the highest total phenolic and flavonoid content were recorded (44.9 mg g−1 DW and 31.5 mg g−1 DW, respectively) in the callus grown on TDZ (9.0 μM) + Mel (15 μM) compared to the TDZ alone (29.8 mg g−1 DW and 17.6 mg g−1 DW, respectively) induced callus. The biosynthesized AgNPs were confirmed by analyzing the excitation of surface plasmon resonance using ultraviolet-visible spectroscopy at 420–430 nm. The synthesized AgNPs were characterized via X-ray diffraction, Fourier transform infrared spectroscopy, transmission electron microscopy, and energy dispersive X-ray spectroscopy, which indicate that more potent antibacterial and antileishmanial activity is displayed by the Mel plus TDZ callus extract mediated AgNPs than the TDZ-only callus extract mediated AgNPs against multiple drug resistant human pathogens and Leishmania major. Determination of the antileishmanial efficacy of AgNPs is a major step towards the development of new compounds containing nanoparticles for leishmaniasis treatment.
Introduction
Silver nanoparticles (AgNPs) are very useful in many different applications due to their high surface area to volume ratio, which range from catalysis, textile manufacture, and microelectronics to biological applications such as in therapeutics, biomolecular detection and diagnostics, drug delivery, food production, agriculture, and waste treatment. AgNPs are usually synthesized via chemical, physical and well-known biological routes. Plant-mediated AgNPs have gained much importance compared to chemically or physically synthesized AgNPs because of their well-defined low-risk, cost-effectiveness and environmental friendliness (Fig. 1).1
 |
| | Fig. 1 Callus induction on MS media with 9.0 μM of (A) TDZ, (B) NAA and (C) 2,4-D. | |
Ocimum basilicum L. var. thyrsiflora, which is also known as “Thai basil”, belongs to the family Lamiaceae and is an important medicinal plant that mostly grows in tropical climates. This plant is important due to its oil composition2 and antioxidant,3 antiviral,4 insecticidal,5 antidiabetic,6 antimicrobial,7 antifungal8 and anticancer9 activity. O. basilicum has been explored for its in vitro potential using several types of cultures, notably hairy root10 and callus cultures.11 Recently, studies were performed on in vitro cultures to determine the potential of O. basilicum12,13 for nanoparticle synthesis. Medicinal plants such as O. basilicum contain biologically active compounds, e.g. phenolics and flavonoids, which act as reducing agents and thus possess an additional advantage in other bioavailable interventions e.g. the synthesis of nanoparticles.14 Interventions during the establishment of in vitro cultures may help in increasing the efficacy of AgNPs synthesis. For example, the introduction of melatonin (Mel) to callus cultures may have a varying effect on the AgNPs synthesis potential of the callus culture extract.15 Mel, a low molecular weight indoleamine, is regarded as a growth promoter, rooting agent, and universal hydrophilic and hydrophobic antioxidant.16 It has various roles such as regulating photosynthesis, flowering, chlorophyll synthesis,17 plant growth and development, leaf senescence18 callus formation and root regeneration.19,20 Together with its physiological effects on plants, the role of Mel has been exploited in plant stress defenses against pathogens, extreme temperature, excess copper salinity, and drought.21–23 Although Mel has well-documented applications in plants, its usage to enhance the therapeutic potential of medicinal plants has not been investigated to date.16 The synthesis of AgNPs from the wild leaves extract of O. basilicum or Thai basil was first reported by Ramana (2014).24 However, there is no report available on the synthesis of AgNPs in a callus culture extract of this plant. Further, the AgNPs synthesized in callus cultures of Thai basil due to their unique properties and ability to produce substantial amounts of ROS, can be utilized as an effective agent for the treatment of leishmaniasis. The present work is the first report on the synthesis of AgNPs in callus culture extracts of O. basilicum and investigation of the role of Mel in the enhanced biosynthesis of antimicrobial AgNPs by improving its phytochemical reducing potential.
Material and methods
Seeds collection and germination
Seeds of O. basilicum were collected from the National Agriculture Research Center (NARC) Islamabad, Pakistan. The seeds were surface sterilized, selected for viability and transferred to growth media following protocol of Abbasi et al. (2010) with some modifications.25 Viable and healthy seeds were selected using the float test method. Seeds were first washed with autoclaved water to remove dust and debris and then immersed in 0.1% mercuric chloride for 30 seconds and for 1 min in 75% ethanol followed by washing 3 times with autoclaved water. Prior to transfer inside a laminar air flow hood (LFH), the seeds were carefully dried on autoclaved filter paper and placed on Murashige and Skoog (MS0) basal medium consisting of 30 g L−1 sucrose and 8 g L−1 agar (as solidifying agent).26 The pH of the media was adjusted to between 5.6–5.8 prior to autoclaving at 121 °C for 20 minutes. The inoculated flasks were placed in a growth room at 25 °C ± 2 °C for a 16/8 hour photoperiod with a light intensity of 40 μmol m−2 s−1. The in vitro derived Thai basil seedlings were collected after 28 days of inoculation and were used for callus induction.
Establishment of callus culture
For callus induction, leaf explants ∼1–2 cm in size were inoculated on MS medium containing 30 g L−1 sucrose and 8 g L−1 agar together with varying concentrations (2.25, 4.5, 9.0 and 13.5 μM) of TDZ, α-naphthalene acetic acid (NAA), and 2,4-dichlorophenoxyacetic acid (2,4-D). The pH of the media was maintained between 5.6–5.7 with the addition of acid and base (1.0 N HCl and 1.0 N NaOH, respectively) prior to autoclaving, and the cultures were placed in a growth room at 25 °C ± 2 °C for a 16/8 hour photoperiod. For each concentration of TDZ, NAA and 2,4-D, four explants were inoculated as one replicate, and the overall experiment was performed with three replicates. Calli were harvested from the culture media after 4 weeks and their fresh weight (FW) and dry weight (DW) were recorded. The Thai basil callus culture grown on TDZ (9.0 μM) gave the highest phytochemical contents, and thus was used as a control for the Mel optimization experiment. The MS basal medium was prepared by dissolving 30 g sucrose, 8 g agar and various Mel concentrations (0.5,1, 2, 3, 4, 5, 10, 15, 20 and 25 μM) together with TDZ (9.0 μM). The pH of the medium was maintained between 5.6–5.7 prior to autoclaving at 121 °C for 20 minutes. The callus obtained in response to TDZ (9.0 μM) was sub-cultured using the above-mentioned Mel concentrations in combination with TDZ (9.0 μM).
Sample preparation to determine antioxidant activity
The methanolic extract of callus was prepared according to Ahmed et al. (2010).27 Briefly, the callus obtained in response to various concentrations of TDZ, NAA, 2,4-D, and the combination of Mel (0.5, 1, 2, 3, 4, 5, 10, 15, 20 and 25 μM) + TDZ (9.0 μM) was dried and ground to obtain a fine powder. In an Eppendorf tube, 200 mg powder (of each callus sample) was mixed in 1500 μL methanol (99.9%) and kept on a rotatory shaker (50 rpm) for 24 h at room temperature. After that, the sample was sonicated (Toshiba, Japan) and vortexed for 30 and 5 minutes, respectively. Extracts were centrifuged at 10![[thin space (1/6-em)]](https://www.rsc.org/images/entities/char_2009.gif) 000 rpm for 15 minutes and supernatants were stored at 4 °C for further analysis.
000 rpm for 15 minutes and supernatants were stored at 4 °C for further analysis.
Determination of total phenolic and total flavonoid production
The total phenolic content (TPC) was determined using Folin–Ciocalteu's reagent (FC) according to Singleton and Rossi (1965).28 Briefly, 20 μL of the sample was mixed with 90 μL of FC reagent (10× diluted with distilled water) and incubated at room temperature (25 ± 2 °C) for 5 min. After incubation, 90 μL of 6% sodium carbonate was added to the above mixture and its absorbance at 630 nm was measured on a microplate reader. Gallic acid (25, 20, 15, 10 and 5 μg mL−1) was used as a standard to plot the calibration curve (R2 = 0.967) and the TPC was expressed as gallic acid equivalents (GAE) per g of DW. The TPP (mg L−1) of the callus samples obtained using various concentrations of PGRs was determined using the following formula:
| Total phenolic production (mg L−1) = TPC (mg g−1 DW) × DW (g L−1) |
Similarly, the total flavonoid content (TFC) was determined according to the procedure by Zia-Ul-Haq et al. (2012).29 Briefly, 20 μL of extracted sample was mixed with 10 μL of AlCl3 (10%, w/v) and 10 μL of potassium acetate (1 M) followed by the addition of 160 μL of distilled water. This mixture was incubated for 30 min at room temperature (25 ± 2 °C) and its absorbance was measured on a microplate reader at 415 nm. Different concentrations of quercetin (40, 20, 10, 5 and 2.5 μg mL−1) and 20 μL of methanol were used as a positive and negative control, respectively and the TFC was expressed as quercetin equivalents (QE) per g of DW. The TFP (mg L−1) of the callus obtained at various concentrations of PGRs was determined using the following formula:
| Total flavonoid production (mg L−1) = TFC (mg g−1 DW) × DW (g L−1) |
Determination of antioxidant activity
The 2,2-diphenyl-1-picrylhydrazyl (DPPH) scavenging activity of the extracts was determined according to the protocol of Amarowicz et al. (2004).30 The experiment was performed in a 96 well plate by mixing 20 μL of sample and 180 μL of DPPH reagent. The concentrations of 40, 20, 10 and 5 μg mL−1 of ascorbic acid were used as a negative control. The reaction mixture was incubated for 1 h and its absorbance was measured at 517 nm on a microplate reader. The following formula was used to determine the percent free radical scavenging activity (FRSA):
| % FRSA = 100 × (1 − As/Ac) |
where, As is the absorbance of the control when the callus extract was added at a specific concentration and Ac is the standard solution absorbance without test samples.
All tests were performed in triplicate and the calibration curve was plotted using gallic acid, quercetin, and ascorbic acid as the standard for TPC, TFC, and DPPH activity, respectively.
TDZ only callus extract and Mel + TDZ callus extract mediated AgNPs biosynthesis
For extract preparation to synthesize AgNPs, approximately 20 g of Thai basil callus obtained in response to TDZ 9.0 μM alone and the combination of Mel (15 μM) + TDZ (9.0 μM) were separately mixed with 100 mL of distilled water and boiled for 15 minutes in a 500 mL Erlenmeyer flask. Subsequently, the extracts were cooled to room temperature and filtered with Whatman no. 1 paper. Then, the volume of the filtrates was adjusted to 100 mL with distilled water and they were stored at 4 °C for further analysis. The appropriate concentration of silver nitrate solution (SNS) was determined by mixing Thai basil aqueous callus extracts (CE) obtained in response to TDZ (9.0 μM) alone (T-CE) and a combination of Mel (15 μM) + TDZ (9.0 μM) (M + T-CE) separately with 1 mM of SNS in different ratios (1![[thin space (1/6-em)]](https://www.rsc.org/images/entities/char_2009.gif) :
:![[thin space (1/6-em)]](https://www.rsc.org/images/entities/char_2009.gif) 1, 1
1, 1![[thin space (1/6-em)]](https://www.rsc.org/images/entities/char_2009.gif) :
:![[thin space (1/6-em)]](https://www.rsc.org/images/entities/char_2009.gif) 2, 1
2, 1![[thin space (1/6-em)]](https://www.rsc.org/images/entities/char_2009.gif) :
:![[thin space (1/6-em)]](https://www.rsc.org/images/entities/char_2009.gif) 5 and 1
5 and 1![[thin space (1/6-em)]](https://www.rsc.org/images/entities/char_2009.gif) :
:![[thin space (1/6-em)]](https://www.rsc.org/images/entities/char_2009.gif) 10 v/v) for the maximum biosynthesis of AgNPs. Briefly, 1 mL of each extract was mixed separately with 1 mL of SNS (1
10 v/v) for the maximum biosynthesis of AgNPs. Briefly, 1 mL of each extract was mixed separately with 1 mL of SNS (1![[thin space (1/6-em)]](https://www.rsc.org/images/entities/char_2009.gif) :
:![[thin space (1/6-em)]](https://www.rsc.org/images/entities/char_2009.gif) 1 ratio) and subsequent mixtures (1
1 ratio) and subsequent mixtures (1![[thin space (1/6-em)]](https://www.rsc.org/images/entities/char_2009.gif) :
:![[thin space (1/6-em)]](https://www.rsc.org/images/entities/char_2009.gif) 2, 1
2, 1![[thin space (1/6-em)]](https://www.rsc.org/images/entities/char_2009.gif) :
:![[thin space (1/6-em)]](https://www.rsc.org/images/entities/char_2009.gif) 5, and 1
5, and 1![[thin space (1/6-em)]](https://www.rsc.org/images/entities/char_2009.gif) :
:![[thin space (1/6-em)]](https://www.rsc.org/images/entities/char_2009.gif) 10 v/v) were formed by increasing the SNS volume to 10 mL. These mixtures were made in small capped bottles and the reactions were conducted at room temperature for varying time periods. Visual observation (change in the color of the reaction mixture) determined the bio-reduction of silver ions during various time intervals (15 min, 24 h and 30 days). All experiments were repeated three times.
10 v/v) were formed by increasing the SNS volume to 10 mL. These mixtures were made in small capped bottles and the reactions were conducted at room temperature for varying time periods. Visual observation (change in the color of the reaction mixture) determined the bio-reduction of silver ions during various time intervals (15 min, 24 h and 30 days). All experiments were repeated three times.
Characterization of AgNPs
UV-vis spectrophotometry. A HALO DB-20 spectrophotometer was used to record UV-vis spectra (λ = 300–750 nm) as a function of time to monitor the biosynthesis of AgNPs. The reaction mixtures indicating maximum AgNPs biosynthesis were further treated to pellet and wash the AgNPs. Briefly, 1 mL of selected reaction mixture was centrifuged at 8000 rpm for 10 min at room temperature. After discarding the supernatants, the AgNPs pellets were re-suspended in 1 mL of distilled water, following by centrifugation at 8000 rpm for 10 min. The washing process was repeated thrice, and the AgNPs were air dried to evaporate extra water for further characterization.
Fourier-transform infrared (FTIR) spectroscopy. FTIR spectra of both CE-mediated AgNPs were recorded to determine the functional groups for AgNPs reduction and stabilization using a Perkin-Elmer model spectrometer in the transmission mode with potassium bromide (KBr) pellets in the range of 3500–500 cm−1 at room temperature.
X-ray diffraction (XRD) analysis. The crystalline nature of the biosynthesized AgNPs was explored via X-ray diffraction analysis on a Shimadzu-Model, XRD 6000. Powdered samples were placed in the machine, and diffraction patterns were recorded in the scanning mode at 40 kV with a current of 30 mA and Cu/Kα radiation (in the 2θ range of 20–80°). The average particle size of the synthesized AgNPs was determined using the Debye–Scherrer equation.31| |
D = kλ/β![[thin space (1/6-em)]](https://www.rsc.org/images/entities/char_2009.gif) cos cos![[thin space (1/6-em)]](https://www.rsc.org/images/entities/char_2009.gif) θ θ
| (1) |
where, crystal size is denoted by D, shape factor (0.94) by k, the full width in radians at half maximum by β, λ is the X-ray wavelength (λ = 1.5418 Å), and θ is the Bragg's angle.
Transmission electron microscopy (TEM) and energy dispersive X-ray (EDX) analysis. The morphological features of both types of AgNPs were analyzed via transmission electron microscopy (TEM) using a JEOL instrument operated at an accelerating voltage of 120 kV. TEM slides were prepared by simply dropping a very small quantity of sample on a carbon-coated copper grid. The film was dried for 5 min under a table lamp, and TEM images were collected at various magnifications. To analyze the elemental composition, the dried AgNPs were drop-coated onto a carbon film. Energy dispersive X-ray (EDX) analysis was performed using the EDX detector connected to the TEM.
Antibacterial efficacy of the AgNPs against multiple drug-resistant bacteria (MDRB)
The antibacterial efficacy of the synthesized AgNPs was tested against three highly MDRB strains, K. pneumoniae, E. coli, and S. aureus, according to the modified protocol of Buszewski et al. (2016).32 The antibacterial efficacy of the AgNPs was evaluated by utilizing a standard antibiotic (amoxicillin) and callus extracts of Mel (15 μM), and TDZ (9.0 μM) acted as a negative control and SNS as a positive control. For the antibacterial assay, three highly multiple drug-resistant bacterial strains, Staphylococcus aureus (ATCC-6538), Escherichia coli (ATCC-15224) and Klebsiella pneumoniae (ATCC-4619), were acquired from the American Type Culture Collection (ATCC), Manassas, VA, USA. The Ethical Committee of the Faculty of Biological Sciences, Quaid-i-Azam University Islamabad, Pakistan approved these experiments. The well-diffusion method was used to determine the antibacterial efficacy of the T-CE and M + T-CE-mediated AgNPs. Briefly, the AgNPs (15 μg mL−1) were dissolved in autoclaved water and used immediately. Inoculums were prepared by growing bacterial colonies overnight in nutrient broth. Bacterial lawns were prepared on nutrient agar plates using cotton swabs soaked with each broth culture. The wells made in the agar plates were loaded with 1 mM SNS (positive control), 15 μL of the synthesized AgNPs (15 μg mL−1), T-CE and M + T-CE (negative controls) and a commercial antibiotic ampicillin solution (10 μg) (as a standard). The plates were incubated at 37 °C for 24 h and the zone of inhibition was measured in mm. The data of each strain were collected from three independent experiments which were repeated thrice.
Anti-leishmanial activity of the AgNPs
Leishmania major (MRHO/IR/76/ER) promastigotes were cultivated on RPMI 1640 medium containing 10% fetal bovine serum (FBS), 4.5 mg mL−1 glucose and 292 μg mL−1 L-glutamine (all supplied by Sigma) and grown at 25 °C. After 6 days of culture, parasites in the stationary growth phase were obtained and utilized within 2 weeks of cultivation.
The plant solution extracts and AgNPs were prepared in PBS at various concentrations of 250, 200, 150, 100, 50 and 25 μg mL−1. The anti-leishmanial activity of the AgNPs was analyzed in 96-well flat-bottom plates, and the culture (100 μL per well) seeded consisted of 1 × 10⁵ cells per mL promastigotes. Then, 50 μL each of the extracts and nanoparticles were added and incubated for 24 hours at 25 ± 1 °C. The first well was left blank, which consisted of only 100 μL culture medium without any parasite, extracts, and AgNPs. The anti-leishmanial activity of the extracts and nanoparticles was evaluated in vitro by the utilizing MTT (3-(4,5-dimethylthiazol-2yl)-2,5-diphenyltetrazolium bromide) based microassay as a marker of cell viability against the promastigote forms of L. major. After the incubation period, MTT (10 μL) was added to each well and plate and incubated at 25 ± 1 °C for 3 h. 100 μL of dimethyl sulfoxide (DMSO) was added to stop the enzymatic reaction and the plates were again incubated at room temperature for an extra 30 minutes with vigorous shaking. Relative optical density was calculated using a microplate reader at a wavelength of 540 nm. For reproducibility, the experiment was repeated twice, and IC50 was calculated as the concentration that killed 50% of the cells. The formazan absorbance, which is related to the mitochondrial dehydrogenases activity of the metabolically viable cells, indicates the total number of viable cells.
Statistical analysis
All experiments were performed in triplicate. The mean values of different treatments were obtained by the analysis of variance. SPSS (Windows Version 7.5.1, SPSS Inc., Chicago, IL, USA) was used to measure the significance at P ≤ 0.05.
Results and discussion
Determination of biomass accumulation in callus culture
Thai basil leaves explants showed callus induction in response to all the PGR treatments. However, the highest callus induction (100%) was observed for TDZ (9.0 mM) in the leaf explants from the 1 month old in vitro grown plantlet. Callogenesis initiated at the cut edge of the leaf explant. The callus grown on all TDZ concentrations showed no significant variation; however, the most effective response for callogenesis was shown with the TDZ concentration of 9.0 μM (Table 1). The maximum biomass accumulated was 232 g L−1 (FW) and 12.25 g L−1 (DW) in response to TDZ. However, higher concentrations of TDZ (13.5 mg L−1) resulted in the lowest values of FW (38.25 g L−1) and DW (4.25 g L−1) on MS medium with TDZ. The calli grown on all concentrations of TDZ were deep brown and friable; whereas the calli formed in response to 2,4-D and NAA were yellowish green (compact) and light green (compact), respectively. In various plant species, TDZ acts as a bioregulator for callus induction.33 Herein, we report for the first time callus induced by TDZ in Thai basil. Several factors are responsible for callus induction such as optimum PGRs concentration, explant type, plant genotype, in vitro growth conditions and PGR type.34 A significant reduction in callus induction frequency was observed at higher and lower TDZ concentrations than that at the optimal level, which ultimately results in noticeable biomass reduction. The growth parameters stimulated in the callus cultures by TDZ within the optimum concentration range may be attributed to the ability of the hormone to activate enhanced cellular growth by producing purine cytokinins.35 Our findings are consistent with the outcomes of Ali and Abbasi (2014).36 Similarly, a reduction in callus proliferation was observed in Tribulus terrestris by increasing the cytokinin level (Fig. 2).37
Table 1 FW and DW of the calli formed on MS medium supplemented with various concentrations of PGRsa
| PGRs |
Conc. (μM) |
Callogenesis in Leaf Explant |
| FW g L−1 |
DW g L−1 |
Color |
Texture |
| Abbreviations: PGRs: plant growth regulators, TDZ: thidiazuron, NAA: naphthalene acetic acid, 2,4-D: 2,4-dichlorophenoxyacetic acid, GB: greenish brown, Y: yellowish, YG: yellowish green, P: purplish, FW: fresh weight, DW: dry weight, C: compact and F: friable. |
| TDZ |
2.25 |
180.2 |
11 |
GB + P |
F |
| 4.5 |
184.0 |
12 |
GB |
F |
| 9.0 |
232.5 |
12.25 |
GB |
F |
| 13.5 |
38.25 |
4.25 |
GB |
F |
| NAA |
2.25 |
95 |
6.25 |
Y |
C |
| 4.5 |
123.75 |
4.25 |
Y |
C |
| 9.0 |
112.8 |
6.67 |
Y |
C |
| 13.5 |
80.75 |
7.68 |
Y |
C |
| 2,4-D |
2.25 |
61.75 |
8.0 |
YG + P |
C |
| 4.5 |
66.75 |
9.0 |
YG |
C |
| 9.0 |
105.0 |
8.1 |
YG |
C |
| 13.5 |
144.37 |
7.25 |
YG |
C |
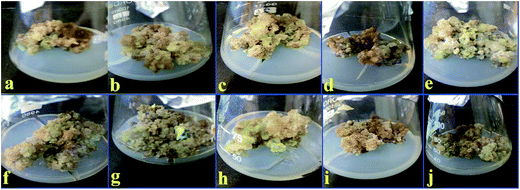 |
| | Fig. 2 Calli obtained in response to various concentrations of Mel. (a) 0.5 μM, (b) 1 μM, (c) 2 μM, (d) 3 μM, (e) 4 μM, (f) 5 μM, (g) 10 μM, (h) 15 μM, (i) 20 μM and (j) 25 μM. | |
The callus produced on TDZ was further sub-cultured in MS medium consisting of various Mel concentrations (0.5, 1, 2, 3, 4, 5, 10, 15, 20 and 25 μM) plus TDZ 9.0 μM. The maximum biomass of FW (200 g L−1) and DW (13.2 g L−1) was recorded at a Mel concentration of 15 μM, whereas low values of FW (65.75 g L−1) and DW (6.87 g L−1) were observed on MS containing Mel (1 μM) + TDZ (9.0 μM), as shown in Table 2.
Table 2 FW and DW of the calli formed on MS medium containing various Mel concentrations and TDZ
| Mel + TDZ (μM) |
Callogenesis in leaf explant |
| FW g L−1 |
DW g L−1 |
Color |
Texture |
| 0.5 + 9 |
97.0 |
8.5 |
B |
F |
| 1 + 9 |
65.75 |
6.87 |
LB |
F |
| 2 + 9 |
171.25 |
11.5 |
GB |
F |
| 3 + 9 |
152.1 |
9.89 |
GB |
F |
| 4 + 9 |
184.5 |
11.87 |
GB |
F |
| 5 + 9 |
157.5 |
10.5 |
GB |
F |
| 10 + 9 |
186.75 |
11.5 |
GB |
F |
| 15 + 9 |
200 |
13.2 |
GB |
F |
| 20 + 9 |
184.5 |
11.5 |
B |
F |
| 25 + 9 |
134.5 |
8.5 |
GB |
F |
Total phenolic production (TPP)
Phenolics are low molecular weight antioxidative compounds found in various plant species, which are useful against several disorders38. Phytochemical analysis of the leaf derived callus extract revealed that the highest TPC (29.8 mg g−1 DW) was found at a TDZ concentration of 9.0 μM, whereas a low TPC was detected for all the other applied concentrations of TDZ, 2,4-D, and NAA. The maximum production of TPC is well reported in in vitro cultures in response to TDZ.39 In our experiments, various phytohormones (TDZ, 2,4-D, and NAA) and the explant used were found to be responsible for the TPC in the callus cultures (Fig. 3a). The TPC reported by Shen et al. (2015) was 304.01 ± 12.46 μg CE per g DW and 10 μg CE per g DW for wild leaves and seeds, respectively.40 These values are much lower than our findings because in in vitro cultures various PGRs are responsible for secondary metabolites enhancement.
 |
| | Fig. 3 (a) TPC of the calli initiated in response to TDZ, NAA, and 2,4-D; (b) TPP of the calli initiated in response to TDZ, NAA, and 2,4-D and (c) TPC and TPP of the calli initiated in response to 9.0 μM TDZ + various concentrations of Mel. | |
The total phenolic production associated with DW was found to be maximum (365.05 mg L−1) in response to 9.0 μM TDZ, whereas the other PGR concentrations resulted in lower values (Fig. 3b). Our results show that total phenolics production is directly proportional to biomass accumulation, which is in accordance with observations of Ali and Abbasi (2014).36 It is concluded from our results that the activation and inhibition of key enzymes such as phenylalanine ammonia lyase and tyrosine ammonia lyase (essential for secondary metabolites biosynthesis) are responsible for the phytochemical variations in the callus cultures.41
On the other hand, the application of Mel (15 μM) greatly enhanced the TPC (44.9 mg g−1) compared to the control, which had a TDZ concentration of 9.0 μM (TPC: 29.8 mg g−1). The other concentrations of Mel (0.5, 1, 2, 3, 4, 5, 10, 20 and 25 μM) also showed a remarkable enhancement in TPC resulting in 29.8, 32.2, 36.2, 38.4, 40.2, 41.1, 44.9, 42.3, and 39.1 mg g−1, respectively. In the case of Mel, the callus obtained in response to 15 μM Mel showed the maximum TPP of 592.68 mg L−1, whereas the TPP recorded for 0.5, 1, 2, 3, 4, 5, 10, 20 and 25 μM Mel was 260.75, 221.21, 416.3, 379.7, 477.17, 431.55, 486.45, 493.35, and 332.35 mg L−1, respectively (Fig. 3c). Similarly, Sheshadri et al. (2015) also reported that Mel greatly enhances the biosynthesis of phytochemicals.42
Total flavonoid production (TFP)
Flavonoids are plant secondary metabolites that show in vitro and in vivo antioxidant activity due to the availability of free hydroxyl (OH−) groups, particularly 3-OH.41,43 Phytochemical analysis of the calli formed in response to 9.0 μM of TDZ showed the maximum TFC (17.6 mg g−1 of DW) followed by 12.6 mg g−1 of DW (4.5 μM), 11.2 mg g−1 of DW (13.5 μM) and 9.2 mg g−1 of DW (2.25 μM). In the case of NAA (13.5 mM), the maximum TFC value was recorded for 9.92 mg g−1 DW and the lowest value (8.1 mg g−1 DW) was recorded for 2.25 μM. Overall, the maximum TFC (17.6 mg g−1 of DW) was recorded in response to 9.0 μM of TDZ (Fig. 4a). The maximum level of TFP recorded was 215.6 mg L−1 of DW in response to 9.0 μM of TDZ, whereas the lowest value recorded was 39.525 mg L−1 in response to 4.5 μM of NAA (Fig. 4b).
 |
| | Fig. 4 (a) TFC and (b) TFP of the calli initiated in response to TDZ, NAA, and 2,4-D. (c) TFC and TFP of the calli initiated in response to 9.0 μM TDZ + various concentrations of Mel. | |
In the case of the callus formed in response to Mel, the maximum TFC (31.5 mg g−1 DW) was observed for 15 μM of Mel and the lowest TFC was recorded for 0.5 μM of Mel which was 17.6 mg g−1 DW. On the other hand, the highest TFP (415.8 mg L−1) was recorded for the same concentration of Mel that the highest value of TFC was recorded. However, the lowest TFP value (138.77 mg L−1) was recorded for 1.0 μM of Mel (Fig. 4c).
Determination of antioxidant activity
The DPPH assay reflects the capability to scavenge metastable free radicals, which incorporates hydrogen radicals from potential antioxidants.44 In our study, the highest quenching free radical activity (76.2%) was recorded in the callus grown in response to 9.0 μM of TDZ compared to the other applied concentrations of PGRs (Fig. 5a). DPPH (a free radical) is usually used to prove the presence of antioxidants in a specific sample, which is then analyzed for its percentage of FRSA.25 Generally, the greater performance in scavenging DPPH free radicals in the in vitro cultures is due to the consistency of phytochemicals. Thus, it is concluded that the FRSA is dependent on several factors such as type of PGR, specific dose of PGRs and type of explant.
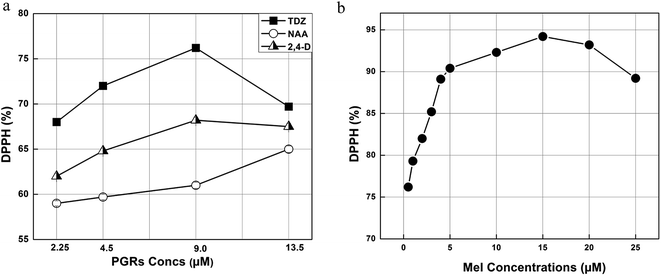 |
| | Fig. 5 (a) Free radical scavenging (DPPH) activity of the leaf derived calli obtained in response to various concentrations of PGRs and (b) free radical scavenging (DPPH) activity of the calli obtained in response to different concentrations of Mel in combination with TDZ (9.0 μM). | |
In the case of the Mel induced callus, a greater (94.2%) free radicals scavenging performance was shown by the samples grown in 15 μM of Mel (Fig. 5b). This higher FRSA compared to the control (9.0 μM TDZ) is mainly due to the enhancement in phytochemicals by Mel. In a previous report, a linear correlation was observed between TPC and antioxidant capacity.58 Therefore, the concentration of Mel (15 mM) with the maximum TPC value (44.9 mg g−1 DW) showed the greatest FRSA (94.2%).
T-CE and M + T-CE mediated biosynthesis of AgNPs
Numerous reports have shown that the bioactive compounds present in plants, such as phenolics, flavonoids, amides, tannins and proteins, serve as reducing and capping agents.45–49 Since the T-CE and M + T-CE of basil contain elevated levels of methyl chavicol, citral, flavonoids, phenolics etc., it was expected that they will serve as reducing and capping agents for the biosynthesis of AgNPs. Therefore, AgNPs were synthesized using both callus extracts to determine the best reduction source. The formation of AgNPs in aqueous extracts can be monitored visually by a change in color from yellowish brown to deep brown. In our initial experiments, 1000 μL each of T-CE and M + T-CE solution was mixed separately with 1 mM SNS in different v/v ratios (1![[thin space (1/6-em)]](https://www.rsc.org/images/entities/char_2009.gif) :
:![[thin space (1/6-em)]](https://www.rsc.org/images/entities/char_2009.gif) 1, 1
1, 1![[thin space (1/6-em)]](https://www.rsc.org/images/entities/char_2009.gif) :
:![[thin space (1/6-em)]](https://www.rsc.org/images/entities/char_2009.gif) 2, 1
2, 1![[thin space (1/6-em)]](https://www.rsc.org/images/entities/char_2009.gif) :
:![[thin space (1/6-em)]](https://www.rsc.org/images/entities/char_2009.gif) 5, and 1
5, and 1![[thin space (1/6-em)]](https://www.rsc.org/images/entities/char_2009.gif) :
:![[thin space (1/6-em)]](https://www.rsc.org/images/entities/char_2009.gif) 10 extract/SNS). The reaction mixtures started turning brown immediately when they were mixed and continued turning darker with time. These reaction mixtures were kept at room temperature for 24 hours; however no further change in color was observed after 6 hours, which suggests that the color attained by all the reaction mixtures was stable (Fig. 6A and B). In the case of the T-CE-mediated biosynthesis of AgNPs, the reaction mixture with a 1
10 extract/SNS). The reaction mixtures started turning brown immediately when they were mixed and continued turning darker with time. These reaction mixtures were kept at room temperature for 24 hours; however no further change in color was observed after 6 hours, which suggests that the color attained by all the reaction mixtures was stable (Fig. 6A and B). In the case of the T-CE-mediated biosynthesis of AgNPs, the reaction mixture with a 1![[thin space (1/6-em)]](https://www.rsc.org/images/entities/char_2009.gif) :
:![[thin space (1/6-em)]](https://www.rsc.org/images/entities/char_2009.gif) 10 ratio (T-CE/SNS) turned darker more rapidly than the rest of the T-CE/SNS reaction mixtures (Fig. 6A). However, in the case of the M + T-CE mediated biosynthesis of AgNPs, the reaction mixtures with 1
10 ratio (T-CE/SNS) turned darker more rapidly than the rest of the T-CE/SNS reaction mixtures (Fig. 6A). However, in the case of the M + T-CE mediated biosynthesis of AgNPs, the reaction mixtures with 1![[thin space (1/6-em)]](https://www.rsc.org/images/entities/char_2009.gif) :
:![[thin space (1/6-em)]](https://www.rsc.org/images/entities/char_2009.gif) 2, 1
2, 1![[thin space (1/6-em)]](https://www.rsc.org/images/entities/char_2009.gif) :
:![[thin space (1/6-em)]](https://www.rsc.org/images/entities/char_2009.gif) 5, and 1
5, and 1![[thin space (1/6-em)]](https://www.rsc.org/images/entities/char_2009.gif) :
:![[thin space (1/6-em)]](https://www.rsc.org/images/entities/char_2009.gif) 10 ratios turned brown more rapidly than the other reaction mixtures (Fig. 6B), which indicates that the M + T-induced CE is a better reducing source than the T-CE. This also indicates that higher concentrations of SNS speed up the biosynthesis of AgNPs, which agrees with a previous study involving Agrimoniae herba. extract as a reducing agent.50
10 ratios turned brown more rapidly than the other reaction mixtures (Fig. 6B), which indicates that the M + T-induced CE is a better reducing source than the T-CE. This also indicates that higher concentrations of SNS speed up the biosynthesis of AgNPs, which agrees with a previous study involving Agrimoniae herba. extract as a reducing agent.50
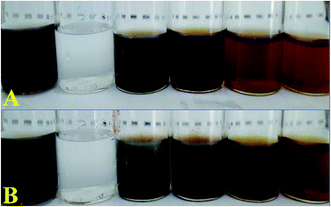 |
| | Fig. 6 Biosynthesis of AgNPs. (A) Reaction mixtures of T-CE/SNS in different ratios (v/v). (B) Reaction mixtures of M + T-CE/SNS in different ratios (v/v). | |
Characterization of T-CE and M + T-CE mediated biosynthesized AgNPs
Fourier transform infrared (FTIR) spectroscopy. To explore the possible interfacial phytoconstituents essential for the reduction and stabilization of AgNPs, FTIR analyses were carried out. The IR spectra of the dried callus formed in response to TDZ alone, a combination of Mel + TDZ, T-CE mediated AgNPs and M + T-CE mediated AgNPs are presented in Fig. 9A–D, respectively. The spectrum B act as a control for A, whereas spectrum D serves as control for C to compare the characteristic peaks formed in the A and C IR spectra of both types of synthesized AgNPs, which show that various functional groups are involved in the reduction of metallic silver ions. Peaks are observed in IR spectrum A at 2110 cm−1, 1998 cm−1, 1687 cm−1, 1573 cm−1, 1504 cm−1, 1433 cm−1, 1321 cm−1, 1263 cm−1, 1074 cm−1 and 838.3 cm−1. The peak at 1687 cm−1 in IR spectrum B is mainly due to primary and secondary amines together with the amide linkage of proteins which diminished in IR spectrum A. The disappearance of this peak indicates the involvement of proteins in the synthesis and stabilization of AgNPs. The peak present at 1433 cm−1 represents the polyphenolics group in T-callus, which completely disappeared in IR spectrum A of the synthesized AgNPs, thus showing that the OH− group is the principal group responsible for AgNPs synthesis and stabilization.
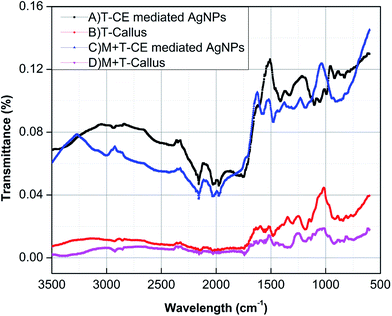 |
| | Fig. 9 FTIR spectra of (A) T-CE mediated AgNPs, (B) T-callus, (C) M + T-CE mediated AgNPs and (D) M + T-callus. | |
The spectra C and D show the IR spectra of the M + T-CE mediated AgNPs and control M + T-callus. The control spectrum D shows characteristic peaks at 875 cm−1, 947 cm−1, 1037 cm−1, 1087 cm−1, 1159 cm−1, 1284 cm−1, 1377 cm−1, 1427 cm−1, 1504 cm−1, 1528 cm−1, 1610 cm−1, 1708 cm−1, 2110 cm−1, 2871 cm−1. It is clear from IR spectrum D that the band at 2871 cm−1, which corresponds to the C–H stretching of alkanes, is absent in IR spectrum C. The peak observed at 2110 cm−1 represents the CO vibration which is completely absent in the IR spectrum C. The sharp peak at 1340 cm−1 is attributed to the polyphenolic groups of tannins and flavonoids which are essential for AgNPs synthesis and stabilization. The peaks at 1284 cm−1 and 1087 cm−1 correspond to the C–N bonding of aliphatic amines, whereas the peak at 1037 cm−1 corresponding to C-bonding in the ether groups of control D completely disappeared in IR spectrum C. These results indicate the involvement of carboxyl, hydroxyl, amino and amides containing phytoconstituents in AgNPs synthesis and stabilization.
XRD analysis. The crystallinity of both types of synthesized AgNPs was determined via XRD analysis. XRD analysis of the T-CE mediated AgNPs (Fig. 10A) revealed four different diffraction peaks at 2θ values of 32.23°, 38.23°, 46.93°, and 64.61°, whereas in the case of the M + T-CE mediated AgNPs (Fig. 10B), 2θ peaks were observed at 32.23°, 38.23°, 46.93°, and 64.61°, which are attributed to the 111, 200, 220, and 311 crystallographic planes of the face-centered cubic (FCC) crystalline structure of metallic silver (Qu et al., 2014), respectively. The bioactive compounds present on the surface of the AgNPs (essential for their capping) are responsible for the appearance of these peaks. The Debye–Scherrer equation was used to calculate the average size of the AgNPs by ascertaining the full width at half maximum of the Bragg's reflection which can be indexed to 111, 200, 220 and 311 crystalline planes of both types of synthesized AgNPs.53 The average crystallite sizes were estimated to be 25 nm for the T-CE mediated AgNPs and 15 nm for the M + T-CE mediated AgNPs, which are in accordance with the sizes measured via TEM. These results clearly show that both types of synthesized AgNPs exhibit the same crystalline structure (FCC); however they vary in size. The M + T-CE mediated AgNPs are smaller in size than the T-CE mediated AgNPs, and are thus believed to be more active in their antimicrobial action since smaller sized particles could penetrate cells more easily.54
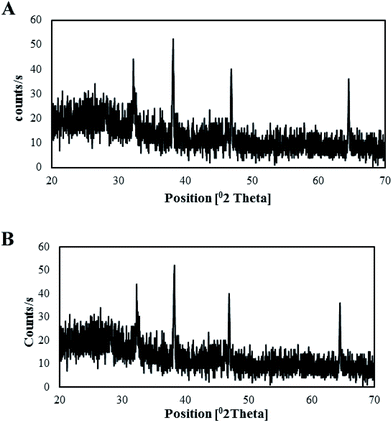 |
| | Fig. 10 XRD patterns of the synthesized AgNPs. (A) T-CE mediated AgNPs and (B) M + T-CE mediated AgNPs. | |
TEM and EDX analysis. TEM analysis was used to determine the size and shape of the synthesized AgNPs in detail. The TEM images of the T-CE mediated AgNPs sample taken at different magnifications shown in Fig. 11a and b reveal numerous spherical shaped AgNPs, 21 to 28 nm in size. In the case of the M + T-CE mediated AgNPs, the TEM analysis discloses the spherical nature of the AgNPs which have a size of 11–19 nm (Fig. 12a and b). These results indicate that the M + T-CE mediated AgNPs were smaller in size and more monodispersed compared to the T-CE mediated AgNPs.55 The TEM images also reveal that agglomeration is prevented by the enormous size of the biologically active compounds attached to the surface of the AgNPs. EDX analysis was used to further confirm the metallic silver conformation in the synthesized AgNPs. The EDX spectra (Fig. 11 and 12c) in the range of 3.0–4.0 keV display sharp peaks of metallic silver. Strong absorption spectra were observed for metallic silver nanomaterial in the 2.5–4.0 keV range in earlier reports, which are in agreement with our results.54,56
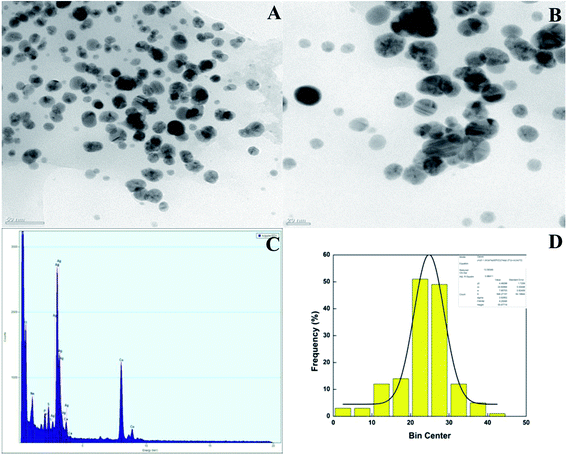 |
| | Fig. 11 (A, B) TEM images of the T-CE mediated AgNPs at various magnifications, (C) EDX spectra of the AgNPs and (D) histogram of the AgNPs size distribution. | |
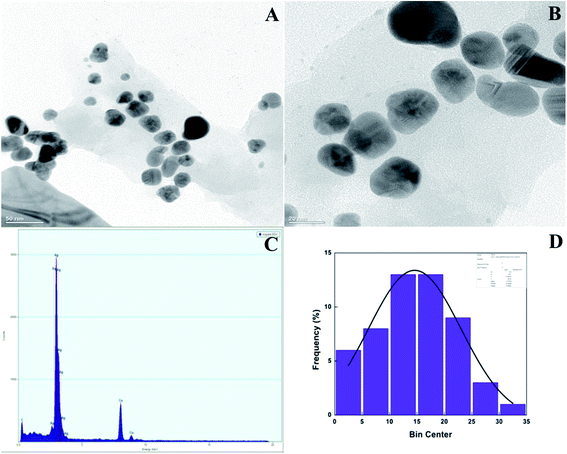 |
| | Fig. 12 (a, b) TEM images of the M + T-CE mediated AgNPs at various magnifications, (c) EDX spectra of the AgNPs and (d) histogram of the AgNPs size distribution. | |
Possible mechanism for AgNPs biosynthesis
The mechanism of AgNPs biosynthesis via plant metabolites is still under debate. The T-CE and M + T-CE-mediated AgNPs FTIR analysis revealed that flavonoids, polyphenols, and carbonyl compounds are mainly involved in the reduction and stabilization of the nanoparticles. Therefore, we hypothesized the mechanism of AgNPs biosynthesis by utilizing the main constituent of Thai basil, cichoric acid. It seems that the polar OH− groups of cichoric acid are mainly involved in the reduction of Ag+ to Ag0. Initially, the lone pair of electrons on the OH− group (of cichoric acid) lodges in the vacant orbital of the Ag+ ion which results in its capping with the OH− group of cichoric acid. The lone pair of electrons from the OH group of cichoric acid reduces the Ag+ ions and it is oxidized. Subsequently, AgNPs are formed together with NO2 and O2 (Fig. 13a). Furthermore, the secondary metabolites present in T-CE and M + T-CE are involved in the capping and stabilization of AgNPs by forming weak linkages with the nanoparticles to prevent their agglomeration (Fig. 13b). This hypothesized mechanism is in accordance with that reported earlier for ZnO NPs biosynthesis via the polar groups of plant metabolites.57,58
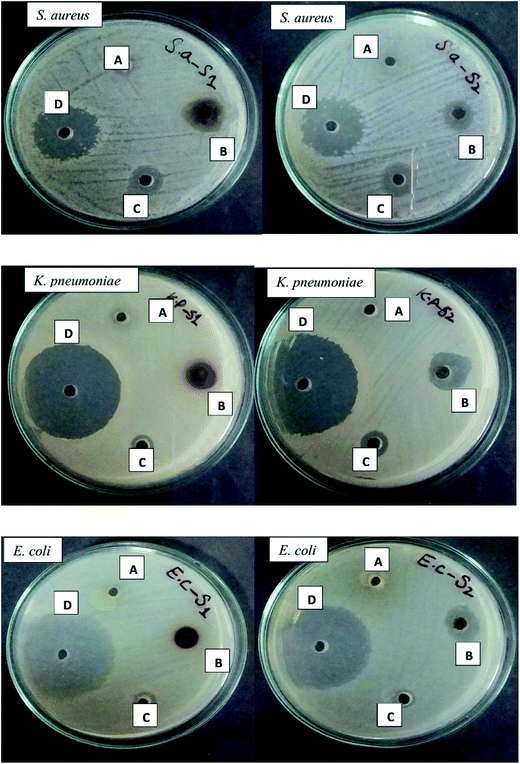 |
| | Fig. 13 Comparison of the antibacterial efficacy of both types of synthesized AgNPs against S. aureus, K. pneumoniae, E. coli and B. subtilis. Left: T-CE mediated AgNPs and right: M + T-CE mediated AgNPs. (A) Plant extract, (B) AgNPs (both types), (C) AgNO3 solution and (D) antibiotics. | |
Antibacterial efficacy of AgNPs against MDRB
Bacterial species develop multiple antibiotics resistance, which is usually attributed to the presence of genetic mobile elements, such as plasmids, transposons, and gene cassettes in integrons which carry resistant genes.59 K. pneumoniae strains are resistant to many classes of antibiotics ranging from aminoglycosides, chloramphenicol, carbapenems, fluoroquinolones, tetracyclines, and sulfamethoxazole.60,61 Similarly, E. coli strains have developed resistance to many antibiotics including nalidixic acid, ampicillin, rifampin, chloramphenicol, sulfamethoxazole, streptomycin, and tetracycline62 and S. aureus strains have been found resistant to all β-lactam antibiotics and other glycopeptides such as vancomycin.63 Compared to both type of AgNPs, minimum antibacterial activity was shown by both calli extracts and SNS alone (Fig. 14). The antibacterial analysis, in which the zone of inhibition was measured in mm (Table 4), revealed that the best activity was exhibited by the Mel induced AgNPs compared to the control (TDZ mediated AgNPs). Three out of four bacterial strains were more susceptible to the Mel induced AgNPs compared to the control which exhibited a moderate level of susceptibility; however one bacterial strain was more susceptible to the control-mediated AgNPs. These findings (Fig. 14 and Table 4) undoubtedly reveal that the M + T-CE mediated AgNPs display stronger antibacterial activity than the T-CE mediated AgNPs, which is mainly due to their size differences. Similarly, Anjum and Abbasi (2016) also showed the potent antibacterial activity of biosynthesized AgNPs. Biomedical applications mainly depend upon the size and shape of the synthesized nanoparticles.30 Since cell membranes are more permeable to small-sized nanoparticles, they show efficient antibacterial activity.54 Furthermore, the maximum zones of inhibition was obtained for the smaller sized M + T-CE mediated AgNPs (11–19 nm) compared to the larger sized T-CE mediated AgNPs (21–28 nm).
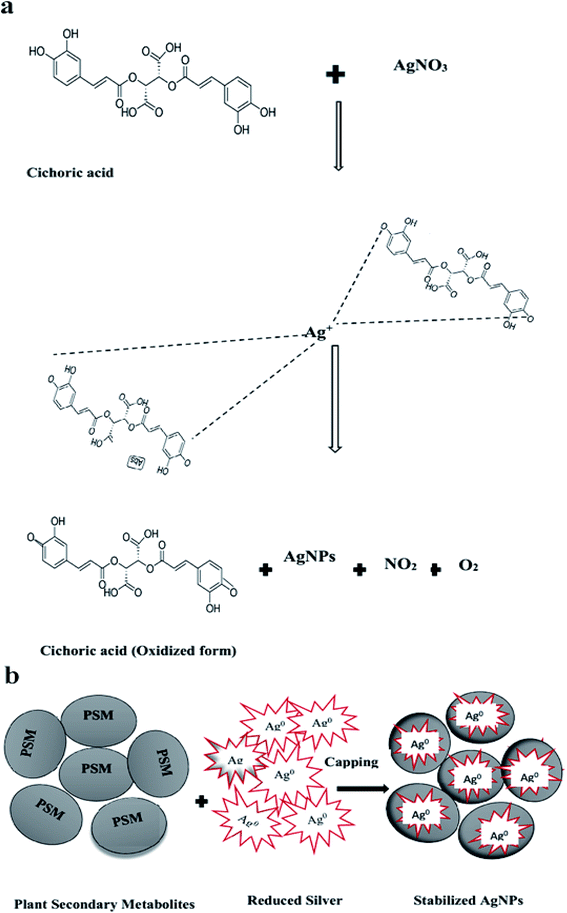 |
| | Fig. 14 Possible mechanism involved in the biosynthesis of AgNPs. (a) Capping and reduction of Ag ions via the main compound of Thai basil, cichoric acid and (b) stabilization of the biosynthesized AgNPs via capping with plant secondary metabolites. | |
Table 4 Zone of inhibition shown by the T-CE mediated AgNPs and M + T-CE mediated AgNPs
| Bacterial strains |
Zone of inhibition (mm) (20 μL per well) |
| 1 mM SNS |
Antibiotics (10 μg mL−1) |
T-CE (10 mg mL−1) |
M + T-CE (10 mg mL−1) |
T-CE-mediated AgNPs (1 mg mL−1) |
M + T-CE-mediated AgNPs (1 mg mL−1) |
| E. coli |
7.2 ± 0.2 |
39.1 ± 1.08 |
0 |
0 |
10.03 ± 1.2 |
15.1 ± 1.4 |
| K. pneumonia |
12 ± 0.46 |
40.03 ± 1.02 |
0 |
0 |
13.4 ± 1.70 |
18.23 ± 1.93 |
| S. aureus |
9.0 ± 0.38 |
22.1 ± 0.01 |
0 |
0 |
17.1 ± 1.20 |
15.13 ± 1.04 |
Anti-leishmanial efficacy of AgNPs
The antileishmanial efficacy of the AgNPs synthesized in callus cultures of Basil was determined quantitatively and microscopically by applying the MTT assay to Leishmania major promastigotes with various concentrations (25, 50, 100, 150, 200 and 250 μg mL−1) of both types of AgNPs in the dark. Fig. 15 shows that under dark conditions, the formation of formazan crystals, which indicates metabolic activity, was very intense in the control group. However, less formazan crystals were formed upon exposure to the AgNPs in the dark compared to the control group, which indicates the efficacy of the AgNPs at various concentrations in dark conditions (Fig. 15). The L. major parasites metabolic activity decreased with an increase in the concentration of AgNPs. Compared to the control group, the metabolic activity of the L. major promastigotes was negatively influenced by each applied concentration of AgNPs. However, the M + T-CE mediated AgNPs (250 μg mL−1) showed the highest suppressive effect on the metabolic activity of L. major promastigotes. Based on the IC50 against promastigotes, the M + T-CE mediated AgNPs induced a considerable leishmanicidal effect with an IC50 value 550 μg mL−1 compared to the T-CE mediated AgNPs with an IC50 > 1000 μg mL−1. Although the IC50 value of the M + T-CE mediated AgNPs is higher than the IC50 reported for plant based AgNPs against Leishmania,64 it is half of that for the T-CE mediated AgNPs, which shows the promising role of Mel on AgNPs synthesis in callus culture extracts of O. basilicum. Other studies have also shown the high potency of plant based AgNPs against other Leishmania strains, such as L. amazonensis, with considerably lower MICs.65 It has been suggested that AgNPs inhibit the trypanothione/trypanothione reductase system which induces an antiproliferative effect on parasites.66 Chemotherapy is the best option for the prevention of leishmaniasis. The pentavalent pentamidine, allopurinol, antimonial, miltefosine, amphotericin B, paromomycin and many others are well known anti-leishmanial drugs applied at various developmental stages,67,68 are strategies are being developed to lower their dosage and related toxicity to enhance intracellular drug assembly via efficient drug delivery. For this purpose, biosynthesized AgNPs having a small size, large surface area and attachment capability to sulfur and phosphorus groups are promising alternative medicine to treat leishmaniasis and its co-infections.
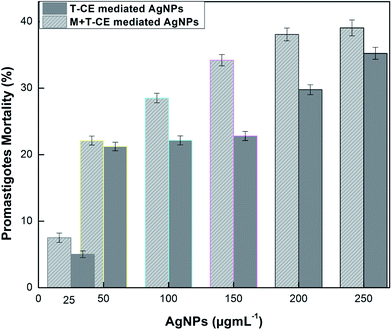 |
| | Fig. 15 Antileishmanial activity of the AgNPs against promastigote forms of L. major. Parasites (1 × 10⁶) were exposed to various concentrations of AgNPs for 48 h, and promastigote mortality percentage was observed. | |
Mechanism of antileishmanial efficacy of AgNPs
Currently, the mechanism behind the antileishmanial efficacy of AgNPs is not fully understood. Probably, the AgNPs anti-leishmanial activity is related to their capability to produce ROS, to which Leishmanial parasites are highly sensitive. In addition, their small size, wide surface area and binding ability to sulfur and phosphorous-containing groups may be responsible for their enhanced antileishmanial efficacy. In the current study, we hypothesized the possible mechanism responsible for the antileishmanial efficacy of biosynthesized AgNPs (Fig. 16). AgNPs enter the Leishmanial cell due to their small size and electrostatic interaction. Thus, the parasite metabolic activity and proliferation values decrease upon exposure to AgNPs, which causes intracellular depletion by producing ROS (Fig. 16a–c). Excessive production of ROS (H2O2, OH etc.) and metallic Ag+ result in cell membrane disruption which leads to cytoplasmic leakage and eventually protozoa death (Fig. 16d and e). ROS-induced toxicity in protozoa due to their reactivity and oxidizing properties has been previously demonstrated.69
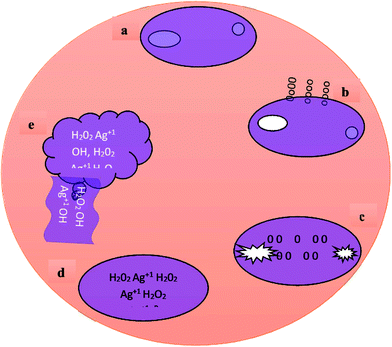 |
| | Fig. 16 Possible mechanism involved in the antileishmanial activity of the T-CE and M + T-CE-mediated AgNPs. (a) Amastigote form of Leishmania major, (b) interactions and nanosilver accumulation in the cell membrane of L. major, (c) entrance and taking hold of all intracellular activities of the protozoa cell by AgNPs, (d) formation of free metallic ions (Ag+) and ROS i.e. OH, H2O2 and O2 and (e) cell destruction and release of ROS together with cytoplasmic leakage. | |
Conclusions
Among the different PGRs, 9.0 μM TDZ was found to be the best for the callogenesis of Thai basil. Mel + TDZ greatly enhanced the TPC, TFC and antioxidant activity compared to TDZ (when applied alone). Exploitation of in vitro cultures of Thai basil could serve as a novel and rich source of phytochemical reducing agents for the enhanced biosynthesis of AgNPs. Mel enhanced the phytochemical reducing potential in the callus culture of Thai basil. The M + T-CE-mediated AgNPs proved to be more efficient than the T-CE-mediated AgNPs not only in terms of their physical characteristics but also in their antibacterial and antileishmanial activities.
Authorship contributions
Sumaira did the research work and wrote the manuscript. Bilal Haider Abbasi supervised and facilitated this research work and reviewed MS and its revisions critically. Muhammad Siddique Afridi contributed to the write-up of this manuscript. Tariq Khan did the TEM analysis from the USA and co-authored the manuscript. Ikram Ullah performed the anti-leishmanial activity experiments. Faouzia Tanveer and Samina Bashir performed the antimicrobial assays. Christophe Hano helped with FTIR and revision of manuscript.
References
- Z.-U.-R. Mashwani, T. Khan, M. A. Khan and A. Nadhman, Appl. Microbiol. Biotechnol., 2015, 99, 9923–9934 CrossRef CAS PubMed.
- G. Opalchenova and D. Obreshkova, J. Microbiol. Methods, 2003, 54, 105–110 CrossRef CAS PubMed.
- A. I. Hussain, F. Anwar, S. T. Hussain Sherazi and R. Przybylski, Food Chem., 2008, 108, 986–995 CrossRef CAS PubMed.
- L.-C. Chiang, L.-T. Ng, P.-W. Cheng, W. Chiang and C.-C. Lin, Clin. Exp. Pharmacol. Physiol., 2005, 32, 811–816 CrossRef CAS PubMed.
- S. M. Kéita, C. Vincent, J.-P. Schmit, J. T. Arnason and A. Bélanger, J. Stored Prod. Res., 2001, 37, 339–349 CrossRef.
- H. El-Beshbishy and S. Bahashwan, Toxicol. Ind. Health, 2012, 28, 42–50 CrossRef PubMed.
- I. Kaya, N. Yigit and M. Benli, Afr. J. Tradit., Complementary Altern. Med., 2008, 5, 363–369 CrossRef.
- S. Oxenham, K. Svoboda and D. Walters, J. Phytopathol., 2005, 153, 174–180 CrossRef CAS.
- P. Kathirvel and S. Ravi, Nat. Prod. Res., 2012, 26, 1112–1118 CrossRef CAS PubMed.
- H. P. Bais, T. S. Walker, H. P. Schweizer and J. M. Vivanco, Plant Physiol. Biochem., 2002, 40, 983–995 CrossRef CAS.
- C. Gopi and P. Ponmurugan, J. Biotechnol., 2006, 126, 260–264 CrossRef CAS PubMed.
- H. H. Latif, M. Ghareib and M. A. Tahon, Gesunde Pflanz., 2017, 69, 39–46 CrossRef CAS.
- J. L. Hernández-Pinero, M. Terrón-Rebolledo, R. Foroughbakhch, S. Moreno-Limón, M. F. Melendrez, F. Solís-Pomar and E. Pérez-Tijerina, Appl. Nanosci., 2016, 6, 1183–1190 CrossRef.
- M. Magnotta, J. Murata, J. Chen and V. De Luca, Phytochemistry, 2006, 67, 1758–1764 CrossRef CAS PubMed.
- S. A. Sheshadri, S. Sriram, P. Balamurugan, R. Anupriya, S. A. Princy, P. Brindha and S. Bindu, RSC Adv., 2015, 5, 47548–47554 RSC.
- K. M. Janas and M. M. Posmyk, Acta Physiol. Plant., 2013, 35, 3285–3292 CrossRef CAS.
- D.-X. Tan, R. Hardeland, L. C. Manchester, A. Korkmaz, S. Ma, S. Rosales-Corral and R. J. Reiter, J. Exp. Bot., 2012, 63, 577–597 CrossRef CAS PubMed.
- P. Wang, X. Sun, C. Li, Z. Wei, D. Liang and F. Ma, J. Pineal Res., 2013, 54, 292–302 CrossRef CAS PubMed.
- N. Zhang, B. Zhao, H. J. Zhang, S. Weeda, C. Yang, Z. C. Yang, S. Ren and Y. D. Guo, J. Pineal Res., 2013, 54, 15–23 CrossRef CAS PubMed.
- N. Zhang, Q. Sun, H. Zhang, Y. Cao, S. Weeda, S. Ren and Y.-D. Guo, J. Exp. Bot., 2015, 66, 647–656 CrossRef CAS PubMed.
- M. Arnao and J. Hernández-Ruiz, J. Pineal Res., 2009, 46, 58–63 CrossRef CAS PubMed.
- M. B. Arnao and J. Hernández-Ruiz, Food Chem., 2013, 138, 1212–1214 CrossRef CAS PubMed.
- M. B. Arnao and J. Hernández-Ruiz, Trends Plant Sci., 2014, 19, 789–797 CrossRef CAS PubMed.
- M. Ramana, European Journal of Academic Essays, 2014, 1, 5–9 Search PubMed.
- B. H. Abbasi, M. A. Khan, T. Mahmood, M. Ahmad, M. F. Chaudhary and M. A. Khan, Plant Cell, Tissue Organ Cult., 2010, 101, 371–376 CrossRef CAS.
- T. Murashige and F. Skoog, Physiol. Plant., 1962, 15(3), 473–497 CrossRef CAS.
- D. Ahmed, M. A. Arshad, M. N. Asghar and M. I. Aujla, Asian J. Chem., 2010, 22, 4524 CAS.
- V. Singleton and J. A. Rossi, Am. J. Enol. Vitic., 1965, 16, 144–158 CAS.
- M. Zia-Ul-Haq, S. A. Shahid, S. Ahmad, M. Qayum and I. Khan, J. Med. Plants Res., 2012, 6, 3254–3258 Search PubMed.
- R. Amarowicz, R. Pegg, P. Rahimi-Moghaddam, B. Barl and J. Weil, Food Chem., 2004, 84, 551–562 CrossRef CAS.
- S. Arokiyaraj, M. V. Arasu, S. Vincent, N. U. Prakash, S. H. Choi, Y.-K. Oh, K. C. Choi and K. H. Kim, Int. J. Nanomed., 2014, 9, 379 CrossRef PubMed.
- B. Buszewski, V. Railean-Plugaru, P. Pomastowski, K. Rafińska, M. Szultka-Mlynska, P. Golinska, M. Wypij, D. Laskowski and H. Dahm, J. Microbiol., Immunol. Infect., 2016 DOI:10.1016/j.jmii.2016.03.002.
- T. Khan, B. H. Abbasi, M. A. Khan and Z. K. Shinwari, Appl. Biochem. Biotechnol., 2016, 179, 46–58 CrossRef CAS PubMed.
- S. Mathur and G. S. Shekhawat, Acta Physiol. Plant., 2013, 35, 931–939 CrossRef CAS.
- J. C. Thomas and F. R. Katterman, Plant Physiol., 1986, 81, 681–683 CrossRef CAS PubMed.
- M. Ali and B. H. Abbasi, Appl. Biochem. Biotechnol., 2014, 172, 2363–2376 CrossRef CAS PubMed.
- T. Nikam, M. A. Ebrahimi and V. Patil, Plant Biotechnol. Rep., 2009, 3, 243–250 CrossRef.
- C. Rice-Evans, N. Miller and G. Paganga, Trends Plant Sci., 1997, 2, 152–159 CrossRef.
- N. Pourebad, R. Motafakkerazad, M. Kosari-Nasab, N. F. Akhtar and A. Movafeghi, Plant Cell, Tissue Organ Cult., 2015, 122, 331–339 CrossRef CAS.
- Y. Shen, W. Prinyawiwatkul, P. Lotrakul and Z. Xu, Int. J. Food Sci. Technol., 2015, 50, 1651–1657 CrossRef CAS.
- M. Ali and B. H. Abbasi, Ind. Crops Prod., 2013, 49, 400–406 CrossRef CAS.
- S. A. Sheshadri, S. Sriram and P. Balamurugan, et al., Melatonin improves bioreductant capacity and silver nanoparticles synthesis using Catharanthus roseus leaves, RSC Adv., 2015, 5(59), 47548–47554 RSC.
- S. Geetha, M. S. Ram, S. Mongia, V. Singh, G. Ilavazhagan and R. Sawhney, J. Ethnopharmacol., 2003, 87, 247–251 CrossRef CAS PubMed.
- K. Shimoi, S. Masuda, B. Shen, M. Furugori and N. Kinae, Mutat. Res., Fundam. Mol. Mech. Mutagen., 1996, 350, 153–161 CrossRef PubMed.
- E. M. Kwee and E. D. Niemeyer, Food Chem., 2011, 128, 1044–1050 CrossRef CAS.
- A. K. Mittal, J. Bhaumik, S. Kumar and U. C. Banerjee, J. Colloid Interface Sci., 2014, 415, 39–47 CrossRef CAS PubMed.
- H. Bar, D. K. Bhui, G. P. Sahoo, P. Sarkar, S. P. De and A. Misra, Colloids Surf., A, 2009, 339, 134–139 CrossRef CAS.
- M. Kowshik, S. Ashtaputre, S. Kharrazi, W. Vogel, J. Urban, S. K. Kulkarni and K. Paknikar, Nanotechnology, 2002, 14, 95 CrossRef.
- H. M. Magdi and B. Bhushan, Microsyst. Technol., 2015, 21, 2279–2285 CrossRef CAS.
- P. Mohanpuria, N. K. Rana and S. K. Yadav, J. Nanopart. Res., 2008, 10, 507–517 CrossRef CAS.
- D. Qu, W. Sun, Y. Chen, J. Zhou and C. Liu, Int. J. Nanomed., 2014, 9, 1871–1882 Search PubMed.
- N. Gogoi, P. J. Babu, C. Mahanta and U. Bora, Mater. Sci. Eng., C, 2015, 46, 463–469 CrossRef CAS PubMed.
- J. Mock, M. Barbic, D. Smith, D. Schultz and S. Schultz, J. Chem. Phys., 2002, 116, 6755–6759 CrossRef CAS.
- R. Mie, M. W. Samsudin, L. B. Din, A. Ahmad, N. Ibrahim and S. N. A. Adnan, Int. J. Nanomed., 2014, 9, 121 CrossRef PubMed.
- J. R. Morones, J. L. Elechiguerra, A. Camacho, K. Holt, J. B. Kouri, J. T. Ramírez and M. J. Yacaman, Nanotechnology, 2005, 16, 2346 CrossRef CAS PubMed.
- A. Nabikhan, K. Kandasamy, A. Raj and N. M. Alikunhi, Colloids Surf., B, 2010, 79, 488–493 CrossRef CAS PubMed.
- K. Jeeva, M. Thiyagarajan, V. Elangovan, N. Geetha and P. Venkatachalam, Ind. Crops Prod., 2014, 52, 714–720 CrossRef CAS.
- F. Buazar, M. Bavi, F. Kroushawi, M. Halvani, A. Khaledi-Nasab and S. Hossieni, J. Exp. Nanosci., 2016, 11, 175–184 CrossRef CAS.
- S. Jafarirad, M. Mehrabi, B. Divband and M. Kosari-Nasab, Mater. Sci. Eng., C, 2016, 59, 296–302 CrossRef CAS PubMed.
- C. M. Hudson, Z. W. Bent, R. J. Meagher and K. P. Williams, PLoS One, 2014, 9, e99209 Search PubMed.
- S. Nathisuwan, D. S. Burgess and J. S. Lewis, Pharmacotherapy, 2001, 21, 920–928 CrossRef CAS PubMed.
- E. Cella, M. Ciccozzi, A. L. Presti, M. Fogolari, T. Azarian, M. Prosperi, M. Salemi, M. Equestre, F. Antonelli, A. Conti, M. D. Cesaris, S. Spoto, R. A. Incalzi, R. Coppola, G. Dicuonzo and S. Angeletti, Sci. Rep., 2017, 7, 3534 CrossRef PubMed.
- Y. Sáenz, L. Briñas, E. Domínguez, J. Ruiz, M. Zarazaga, J. Vila and C. Torres, Antimicrob. Agents Chemother., 2004, 48, 3996–4001 CrossRef PubMed.
- A. M. Bal and I. M. Gould, Expert Opin. Pharmacother., 2005, 6, 2257–2269 CrossRef CAS PubMed.
- S. Anjum and B. H. Abbasi, Int. J. Nanomed., 2016, 11, 715 CrossRef CAS PubMed.
- A. Ahmad, F. Syed, A. Shah, Z. Khan, K. Tahir, A. U. Khan and Q. Yuan, RSC Adv., 2015, 5, 73793–73806 RSC.
- D. d. S. Lima, B. Gullon, A. Cardelle-Cobas, L. M. Brito, K. A. Rodrigues, P. V. Quelemes, J. Ramos-Jesus, D. D. Arcanjo, A. Plácido, K. Batziou, P. Quaresma, P. Eaton, C. Delerue-Matos, F. A. A. Carvalho, D. A. d. Silva, M. Pintado and J. R. d. S. Leite, J. Bioact. Compat. Polym., 2017, 32(4), 397–410 Search PubMed.
- P. Baiocco, A. Ilari, P. Ceci, S. Orsini, M. Gramiccia, T. Di Muccio and G. Colotti, ACS Med. Chem. Lett., 2011, 2, 230–233 CrossRef CAS PubMed.
- P. M. Loiseau and C. Bories, Curr. Top. Med. Chem., 2006, 6, 539–550 CrossRef CAS PubMed.
|
| This journal is © The Royal Society of Chemistry 2017 |
Click here to see how this site uses Cookies. View our privacy policy here.  Open Access Article
 *a,
Muhammad Siddique Afridib,
Faouzia Tanveera,
Ikram Ullaha,
Samina Bashira and
Christophe Hanod
![[thin space (1/6-em)]](https://www.rsc.org/images/entities/char_2009.gif) 000 rpm for 15 minutes and supernatants were stored at 4 °C for further analysis.
000 rpm for 15 minutes and supernatants were stored at 4 °C for further analysis.
![[thin space (1/6-em)]](https://www.rsc.org/images/entities/char_2009.gif) :
:![[thin space (1/6-em)]](https://www.rsc.org/images/entities/char_2009.gif) 1, 1
1, 1![[thin space (1/6-em)]](https://www.rsc.org/images/entities/char_2009.gif) :
:![[thin space (1/6-em)]](https://www.rsc.org/images/entities/char_2009.gif) 2, 1
2, 1![[thin space (1/6-em)]](https://www.rsc.org/images/entities/char_2009.gif) :
:![[thin space (1/6-em)]](https://www.rsc.org/images/entities/char_2009.gif) 5 and 1
5 and 1![[thin space (1/6-em)]](https://www.rsc.org/images/entities/char_2009.gif) :
:![[thin space (1/6-em)]](https://www.rsc.org/images/entities/char_2009.gif) 10 v/v) for the maximum biosynthesis of AgNPs. Briefly, 1 mL of each extract was mixed separately with 1 mL of SNS (1
10 v/v) for the maximum biosynthesis of AgNPs. Briefly, 1 mL of each extract was mixed separately with 1 mL of SNS (1![[thin space (1/6-em)]](https://www.rsc.org/images/entities/char_2009.gif) :
:![[thin space (1/6-em)]](https://www.rsc.org/images/entities/char_2009.gif) 1 ratio) and subsequent mixtures (1
1 ratio) and subsequent mixtures (1![[thin space (1/6-em)]](https://www.rsc.org/images/entities/char_2009.gif) :
:![[thin space (1/6-em)]](https://www.rsc.org/images/entities/char_2009.gif) 2, 1
2, 1![[thin space (1/6-em)]](https://www.rsc.org/images/entities/char_2009.gif) :
:![[thin space (1/6-em)]](https://www.rsc.org/images/entities/char_2009.gif) 5, and 1
5, and 1![[thin space (1/6-em)]](https://www.rsc.org/images/entities/char_2009.gif) :
:![[thin space (1/6-em)]](https://www.rsc.org/images/entities/char_2009.gif) 10 v/v) were formed by increasing the SNS volume to 10 mL. These mixtures were made in small capped bottles and the reactions were conducted at room temperature for varying time periods. Visual observation (change in the color of the reaction mixture) determined the bio-reduction of silver ions during various time intervals (15 min, 24 h and 30 days). All experiments were repeated three times.
10 v/v) were formed by increasing the SNS volume to 10 mL. These mixtures were made in small capped bottles and the reactions were conducted at room temperature for varying time periods. Visual observation (change in the color of the reaction mixture) determined the bio-reduction of silver ions during various time intervals (15 min, 24 h and 30 days). All experiments were repeated three times.
![[thin space (1/6-em)]](https://www.rsc.org/images/entities/char_2009.gif) cos
cos![[thin space (1/6-em)]](https://www.rsc.org/images/entities/char_2009.gif) θ
θ


![[thin space (1/6-em)]](https://www.rsc.org/images/entities/char_2009.gif) :
:![[thin space (1/6-em)]](https://www.rsc.org/images/entities/char_2009.gif) 1, 1
1, 1![[thin space (1/6-em)]](https://www.rsc.org/images/entities/char_2009.gif) :
:![[thin space (1/6-em)]](https://www.rsc.org/images/entities/char_2009.gif) 2, 1
2, 1![[thin space (1/6-em)]](https://www.rsc.org/images/entities/char_2009.gif) :
:![[thin space (1/6-em)]](https://www.rsc.org/images/entities/char_2009.gif) 5, and 1
5, and 1![[thin space (1/6-em)]](https://www.rsc.org/images/entities/char_2009.gif) :
:![[thin space (1/6-em)]](https://www.rsc.org/images/entities/char_2009.gif) 10 extract/SNS). The reaction mixtures started turning brown immediately when they were mixed and continued turning darker with time. These reaction mixtures were kept at room temperature for 24 hours; however no further change in color was observed after 6 hours, which suggests that the color attained by all the reaction mixtures was stable (Fig. 6A and B). In the case of the T-CE-mediated biosynthesis of AgNPs, the reaction mixture with a 1
10 extract/SNS). The reaction mixtures started turning brown immediately when they were mixed and continued turning darker with time. These reaction mixtures were kept at room temperature for 24 hours; however no further change in color was observed after 6 hours, which suggests that the color attained by all the reaction mixtures was stable (Fig. 6A and B). In the case of the T-CE-mediated biosynthesis of AgNPs, the reaction mixture with a 1![[thin space (1/6-em)]](https://www.rsc.org/images/entities/char_2009.gif) :
:![[thin space (1/6-em)]](https://www.rsc.org/images/entities/char_2009.gif) 10 ratio (T-CE/SNS) turned darker more rapidly than the rest of the T-CE/SNS reaction mixtures (Fig. 6A). However, in the case of the M + T-CE mediated biosynthesis of AgNPs, the reaction mixtures with 1
10 ratio (T-CE/SNS) turned darker more rapidly than the rest of the T-CE/SNS reaction mixtures (Fig. 6A). However, in the case of the M + T-CE mediated biosynthesis of AgNPs, the reaction mixtures with 1![[thin space (1/6-em)]](https://www.rsc.org/images/entities/char_2009.gif) :
:![[thin space (1/6-em)]](https://www.rsc.org/images/entities/char_2009.gif) 2, 1
2, 1![[thin space (1/6-em)]](https://www.rsc.org/images/entities/char_2009.gif) :
:![[thin space (1/6-em)]](https://www.rsc.org/images/entities/char_2009.gif) 5, and 1
5, and 1![[thin space (1/6-em)]](https://www.rsc.org/images/entities/char_2009.gif) :
:![[thin space (1/6-em)]](https://www.rsc.org/images/entities/char_2009.gif) 10 ratios turned brown more rapidly than the other reaction mixtures (Fig. 6B), which indicates that the M + T-induced CE is a better reducing source than the T-CE. This also indicates that higher concentrations of SNS speed up the biosynthesis of AgNPs, which agrees with a previous study involving Agrimoniae herba. extract as a reducing agent.50
10 ratios turned brown more rapidly than the other reaction mixtures (Fig. 6B), which indicates that the M + T-induced CE is a better reducing source than the T-CE. This also indicates that higher concentrations of SNS speed up the biosynthesis of AgNPs, which agrees with a previous study involving Agrimoniae herba. extract as a reducing agent.50

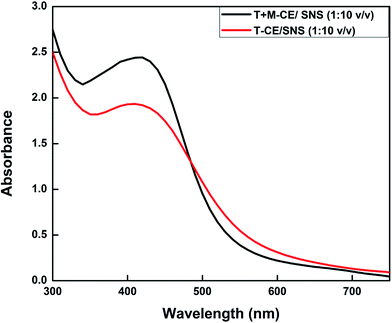
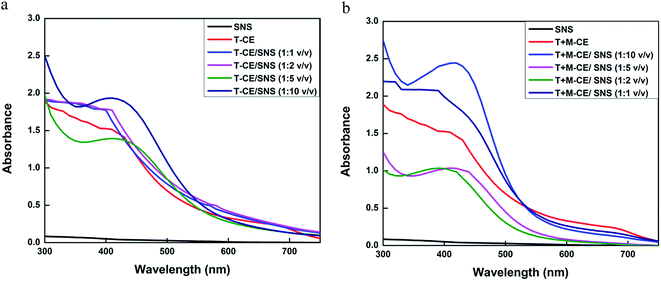
![[thin space (1/6-em)]](https://www.rsc.org/images/entities/char_2009.gif) :
:![[thin space (1/6-em)]](https://www.rsc.org/images/entities/char_2009.gif) 1 ratio of both types of reaction mixtures did not show any characteristic peak of AgNPs (Table 3). The highest absorbance with comparatively narrow peaks was observed when both extracts (T-CE and M + T-CE) were mixed separately with SNS in a 1
1 ratio of both types of reaction mixtures did not show any characteristic peak of AgNPs (Table 3). The highest absorbance with comparatively narrow peaks was observed when both extracts (T-CE and M + T-CE) were mixed separately with SNS in a 1![[thin space (1/6-em)]](https://www.rsc.org/images/entities/char_2009.gif) :
:![[thin space (1/6-em)]](https://www.rsc.org/images/entities/char_2009.gif) 10 ratio, which indicates the highest yield of nanoparticles. The increase in absorbance intensity is due to the increased number of AgNPs formed because of the reduction of silver ions. It is well known that the absorbance intensity mainly depends on the size and shape of AgNPs, and generally, the absorbance peak decreases as the size of the nanoparticles increases (Fig. 8).52
10 ratio, which indicates the highest yield of nanoparticles. The increase in absorbance intensity is due to the increased number of AgNPs formed because of the reduction of silver ions. It is well known that the absorbance intensity mainly depends on the size and shape of AgNPs, and generally, the absorbance peak decreases as the size of the nanoparticles increases (Fig. 8).52
![[thin space (1/6-em)]](https://www.rsc.org/images/entities/char_2009.gif) :
:![[thin space (1/6-em)]](https://www.rsc.org/images/entities/char_2009.gif) 10
10![[thin space (1/6-em)]](https://www.rsc.org/images/entities/char_2009.gif) :
:![[thin space (1/6-em)]](https://www.rsc.org/images/entities/char_2009.gif) 10
10![[thin space (1/6-em)]](https://www.rsc.org/images/entities/char_2009.gif) :
:![[thin space (1/6-em)]](https://www.rsc.org/images/entities/char_2009.gif) 5
5![[thin space (1/6-em)]](https://www.rsc.org/images/entities/char_2009.gif) :
:![[thin space (1/6-em)]](https://www.rsc.org/images/entities/char_2009.gif) 5
5![[thin space (1/6-em)]](https://www.rsc.org/images/entities/char_2009.gif) :
:![[thin space (1/6-em)]](https://www.rsc.org/images/entities/char_2009.gif) 2
2![[thin space (1/6-em)]](https://www.rsc.org/images/entities/char_2009.gif) :
:![[thin space (1/6-em)]](https://www.rsc.org/images/entities/char_2009.gif) 2
2![[thin space (1/6-em)]](https://www.rsc.org/images/entities/char_2009.gif) :
:![[thin space (1/6-em)]](https://www.rsc.org/images/entities/char_2009.gif) 1
1![[thin space (1/6-em)]](https://www.rsc.org/images/entities/char_2009.gif) :
:![[thin space (1/6-em)]](https://www.rsc.org/images/entities/char_2009.gif) 1
1


