
 Open Access Article
 This Open Access Article is licensed under a
 Creative Commons Attribution 3.0 Unported Licence
Ambient light induced antibacterial action of curcumin/graphene nanomesh hybrids
Z. M. Marković *a,
D. P. Kepićb,
D. M. Matijaševićc,
V. B. Pavlovićc,
S. P. Jovanovićb,
N. K. Stankoviće,
D. D. Milivojevićb,
Z. Spitalskya,
I. D. Holclajtner-Antunovićd,
D. V. Bajuk-Bogdanovićd,
M. P. Nikšićc and
B. M. Todorović Marković*b
*a,
D. P. Kepićb,
D. M. Matijaševićc,
V. B. Pavlovićc,
S. P. Jovanovićb,
N. K. Stankoviće,
D. D. Milivojevićb,
Z. Spitalskya,
I. D. Holclajtner-Antunovićd,
D. V. Bajuk-Bogdanovićd,
M. P. Nikšićc and
B. M. Todorović Marković*b
aPolymer Institute, Slovak Academy of Sciences, Dubravska cesta 9, 84541 Bratislava, Slovakia. E-mail: zm25101967@yahoo.com; zoran.markovic@savba.sk
bVinča Institute of Nuclear Sciences, University of Belgrade, P. O. B. 522, 11001 Belgrade, Serbia. E-mail: biljatod@vin.bg.ac.rs; Tel: +381 113408582
cFaculty of Agriculture, University of Belgrade, Nemanjina 6, 11080 Belgrade-Zemun, Serbia
dFaculty of Physical Chemistry, University of Belgrade, Studentski trg 12-16, 11158 Belgrade, Serbia
eThe School of Electrical Engineering, University of Belgrade, Bulevar kralja Aleksandra 73, 11000 Belgrade, Serbia
First published on 20th July 2017
Abstract
Curcumin and its derivates are well-known for their different biological activities including antibacterial. On the other hand there are controversial reports concerning the antibacterial potential of graphene and, in particular, graphene oxide. In this study we have reported for the first time the antibacterial activity of curcumin/graphene nanomesh hybrids under ambient light conditions. The graphene nanomesh was synthesized by electrochemical exfoliation of highly oriented pyrolytic graphite in 1 M solution of ammonium persulfate and further functionalized by curcumin. Identical values of minimum inhibitory concentration (1 mg mL−1) were determined for pure curcumin and curcumin/graphene nanomesh hybrids toward Staphylococcus aureus. All tested samples had more pronounced antibacterial activity against Gram positive bacteria, Staphylococcus aureus compared to Escherichia coli as a representative of Gram negative strains. The poor antibacterial potential of exfoliated graphene improves significantly by the functionalization with curcumin, which allows for its usage as a antibacterial coating.
1. Introduction
Graphene is a two dimensional material that has been extensively studied over the past decade due to its extraordinary properties (electronic, mechanical, optical and thermal).1–5 It is composed of a one atom thick carbon layer and can be synthesized by different procedures: chemical vapor deposition, epitaxial growth, mechanical/liquid exfoliation, electrochemical exfoliation, chemical or thermal reduction of graphene oxide etc.6–11 Electrochemical exfoliation of graphite to give graphene is a low-cost, environmentally friendly method. Different electrolytes can be used to get single or few layer graphene. Electrochemically exfoliated graphene is electrically conducting and water dispersible. It is functionalized at the edges with carboxyl and hydroxyl groups. The sheet core is similar to pristine graphene with elevated level of defects.12,13The strong antibacterial activity of graphene based materials against a wide range of bacterial cells, including Gram positive and Gram negative strains are still under investigation. It is assumed that the antibacterial properties of graphene are to be caused by chemical and physical interactions upon the direct contact of graphene sheets with bacteria in which the bacterial cell membrane seems to be the main target of this activity.14 Upon interactions among bacteria strains and graphene based materials, different types of bacteria membrane damages can be identified: ribonucleic acid (RNA) leakage, release of intracellular components and variations in the transmembrane capacity, lipid peroxidation initiated by the oxidative ability of graphene oxide. Different parameters of graphene based materials affect the bacteria membrane damage: lateral dimension of graphene sheets, concentration, surface area, surface roughness, hydrophilicity, dispersibility and functionalization.
A variety of mechanisms for the antibacterial activity of graphene materials have been proposed, including membrane stress, oxidative stress and electron transfer.15 Membrane stress: nanosheets of graphene can cause physical damage to bacterial membranes. Oxidative stress: Reactive Oxygen Species (ROS) produced by graphene are harmful to lipids and proteins of bacteria. After the deactivation of lipids and proteins, bacteria can no longer proliferate. Electron transfer: antibacterial activity may be produced via the transfer of electrons from the microbial membrane to the graphene surface rather than stemming from ROS mediated damage.16–18
Curcumin is a component of the Indian spice turmeric (Curcumin longa L.) and extracted from the rhizomes of it. Commercially available curcumin is a mixture of three curcuminoids, namely, curcumin, demethoxy- and bisdemethoxy-curcumin, the latter two amounting to nearly 30% in samples labeled “pure”.19 It shows a remarkable range of pharmacological activity, including antioxidant, anti-inflammatory and anticancer activity as well antibacterial.20–27 Paunović et al. found that photoexcited nanocurcumin displayed a significant cytotoxicity depending both on the irradiation time and nanocurcumin concentration.26 In the absence of blue light irradiation nanocurcumin displayed very small cytotoxicity. Recently some studies showed that curcumin suppresses adherence of Streptococcus mutants to human tooth surfaces and extra-cellular matrix protein.28 Furthermore, in this study it is emphasized that curcumin possesses a synergetic effect with important antibiotics against Staphylococcus aureus (S. aureus).29–31 Tyagi et al. have demonstrated in their study that membrane damage is a key mechanism of curcumin mediated killing of S. aureus and Escherichia coli (E. coli), i.e. curcumin caused membrane permeabilization of both bacteria strains despite their significantly different cell wall properties.27 However, very few studies have tackled the mechanism of antibacterial activity of curcumin which seems to differ depending on the strain being studied.
Recently it is reported that the synthesis of colloidal graphene based nanocarriers with high drug loading capacities and with targeting ligands at the outer space is a challenging issue.32 Muthoosamy et al. reported that curcumin–paclitaxel onto polymer-functionalized reduced graphene oxide is highly potent for synergistic anticancer treatment.33 Hatamie et al. reported that curcumin was used for green reduction and functionalization of chemically exfoliated graphene oxide sheets. It was found that cytotoxicity of curcumin/reduced graphene oxide sheets is concentration dependent. At concentrations higher than 100 μg mL−1 some slight cytotoxic effects are observed. In addition, the interaction of the reduced graphene oxide and cells resulted in apoptosis as well as morphological transformation of the cells.34 Mitra et al. showed recently that curcumin loaded collagen functionalized nano graphene oxide promote cell adherence and proliferation. The antimicrobial study reveals the curcumin loaded collagen functionalized nano graphene oxide scaffold has appreciable antibacterial activity. These authors claim as well that in vitro cell line study do not show toxicity of the collagen functionalized nano graphene oxide against NIH 3T3 fibroblast cell line.35 Choi et al. reported a facile and environmentally friendly approach for the synthesis of reduced graphene oxide using uric acid. These authors showed that graphene oxide and uric acid–reduced graphene oxide induced a dose-dependent decrease in cell viability and induced cytotoxicity in human ovarian cancer cells. The results from their study suggest that uric acid–reduced graphene oxide could cause apoptosis in mammalian cells and the toxicity of uric acid–reduced graphene oxide is significantly higher than graphene oxide.36
Graphene nanomesh is a structural derivate of graphene and is formed by removing large number of atoms from the graphitic plane to produce holes distributed on and through the atomic thickness of the graphene sheets.37 Due to its changed electronic properties induced by quantum confinement of the remaining graphitic structure there is a great possibility for electronic application of this material.38 Besides, a large number of hole-edge functional groups provides many more active sites and can increase the sensitivity or response toward targeted chemical or biological species.39
In this paper we have studied antibacterial activity of curcumin/graphene nanomesh hybrids in order to improve antibacterial properties of exfoliated graphene investigated previously.40 Graphene is exfoliated from highly oriented pyrolytic graphite (HOPG) through electrochemical exfoliation process with ammonium persulfate as an electrolyte. Colloids of curcumin and curcumin/graphene nanomesh hybrids were obtained by solvent exchange method. Structural and antibacterial properties of curcumin and curcumin/graphene nanomesh hybrids are investigated by applying atomic force microscopy, transmission electron microscopy, scanning electron microscopy, Fourier transform infrared spectroscopy, Raman spectroscopy, zeta potential measurements, electron paramagnetic resonance measurements and antibacterial tests.
2. Experimental section
2.1. Exfoliation of graphene
Electrochemical exfoliation of HOPG was performed in a two-electrode system using graphite rod as the counter electrode and a HOPG as the working electrode as reported previously.41 Electrolyte solution was prepared by dissolving (NH4)2S2O8 in water to obtain concentration of 1 M. Direct current (DC) voltage of +12 V was applied to the HOPG electrode and the voltage was kept constant until the exfoliation process completed (indicated by the total consumption of the HOPG electrode). Exfoliated product was collected by vacuum filtration and washed with copious amount of water to remove any residual salt. After washing the material was collected and dried in air. Further in the text this material will be designated as the EHOPG.2.2. Extraction of curcumin
An amount of approximately 50 g of dry turmeric powder (Curcuma longa L.) was placed in the Soxhlet apparatus. Ethanol (96% purity, Fisher Chemical) was used as an extraction solvent. The extraction was kept running until the yellow color of the extractions faded. Concentration of curcumin in solution was determined by gravimetry.2.3. Preparation of curcumin, EHOPG, and curcumin–EHOPG colloids
Ethanol solution of curcumin (10 mL) and water based EHOPG colloid (40 mL) were mixed and sonicated. The more volatile ethanol was subsequently removed from the solution using a rotary evaporator at 50 °C. Milli-Q water was added four times more and evaporated to the initial volume. Final solution was diluted in order to obtain concentration of 2 mg mL−1. Further in the text this material will be designated as the curcumin–EHOPG.For the comparison, curcumin colloid was prepared in the same way, with the final concentration of curcumin of 4 mg mL−1. EHOPG colloid was prepared by sonication of EHOPG powder in water and centrifugation.41 All colloids possess long-term stability. The EHOPG and curcumin–EHOPG samples are dialyzed through Sterlitech glass fiber extraction thimbles with pore size of 1 μm for 4 days.
2.4. Characterization of curcumin, EHOPG and curcumin–EHOPG colloids
Microstructure and morphology of curcumin, EHOPG and curcumin–EHOPG particles were recorded by transmission electron microscopy (TEM-JEOL JEM-1400, accelerating voltage 120 kV) and atomic force microscope (AFM-Bruker, Germany) equipped with ScanAsyst probes. All samples for TEM are deposited on lacey carbon copper grid (200 mesh). For AFM measurements samples for were deposited by spin-coating on freshly cleaved mica and dried in vacuum at 200 °C.All AFM images were obtained at 1 Hz, with a 512 × 512 image resolution over different square areas. The imaging mode used in our work was PeakForce QNM. Gwyddion software was used to measure lateral and height dimensions of the curcumin, EHOPG and curcumin–EHOPG samples as well as for determination of surface roughness-root-mean square roughness (rms).42
Zeta potential (ζ-potential) of the curcumin, EHOPG and curcumin–EHOPG particles were assessed by DLS using Zetasizer Nano-ZS (Malvern Instruments, UK) equipped with a 4 mW helium/neon laser (λ = 633 nm) and thermo-electric temperature controller, with the following parameters set for graphene colloidal particles: refractive index = 2.67, absorption = 0.01, and viscosity = 0.89 cP. All measurements were performed at 25 °C. Value of zeta potential was averaged from five measurements.
UV-vis absorption spectra of sample solutions were measured at 20 °C using a spectrophotometer Shimadzu UV-visible UV-2600 (Shimadzu Corporation, Tokyo, Japan) in the range of 200–800 nm and with 1 nm step. All samples were prepared with Milli-Q water in concentration of 0.5 mg mL−1.
The Fourier transform infrared spectroscopy (FTIR) spectra of the curcumin, EHOPG and curcumin–EHOPG KBr pellets were measured at room temperature in the spectral range from 400 to 4000 cm−1 on an Avatar 370, Thermo Nicolet spectrometer. KBr pellets were made by mixing 150 mg KBr powder and 1 mg curcumin, EHOPG and curcumin–EHOPG powder, respectively. The spectral resolution was 4 cm−1.
Raman spectra of the curcumin, EHOPG and curcumin–EHOPG samples were obtained by DXR Raman microscope (Thermo Scientific) using 532 nm excitation line with power of 5 mW. The spectral resolution was 1 cm−1. Acquisition time was 10 × 10 s. Raman spectra were recorded at room temperature. All samples are deposited on silicon substrates.
Electron Paramagnetic Resonance (EPR) analyses were performed at room temperature using a EPR Spectrometer MiniScope 300, Magnettech, Berlin, Germany, operating at a nominal frequency of 9.5 GHz. The microwave power was 1 mW (microwave attenuation of 20 dB), with a modulation amplitude of 0.2 mT. UV irradiation was performed within the EPR resonator, through irradiation window, using Hamamatsu LC8 spot light source, typeL9566-01, radiant wavelength range (300–450 nm).
The formation of singlet oxygen (1O2) was followed by specific reaction between 1O2 and 2,2,6,6-tetramethylpiperidine (TEMP) in which a stable radical adduct, TEMP–1O2 (or TEMPO) was formed. Samples, in concentration of 0.2 wt%, were mixed with TEMP (at a final concentration of 30 mM). Prepared mixtures were air-saturated before EPR measurements. All three mixtures were measured before and during light exposure. These mixtures were exposed to UV-vis light (λ > 300 nm) for 10 minutes.
The ability of dispersions to produce hydroxyl (HO˙) and superoxide (O2−˙) radicals was studied using 5,5-dimethyl-1-pyrroline-N-oxide (DMPO) as a spin trap for both of these radical species. For EPR measurements, we prepared mixtures of DMPO, in final concentration of 100 mM and sample, where concentration of material was 0.5 mg mL−1. As a control, we used DMPO solution and as well as Fenton reaction with DMPO. Fenton reaction was prepared by mixing of 30 μL of FeCl2 (concentration of 1 mM) and 20 μL of H2O2 (concentration of 10 mM) with DMPO.
2.5. Bacteria strains and culture conditions
The antibacterial activities of the curcumin, EHOPG and curcumin–EHOPG were performed against Escherichia coli ATCC 25922 and Staphylococcus aureus ATCC 25923. Selected species of bacteria originate from ATCC (American Type Culture Collection, Rockville, Maryland). The cultivation/assay medium for tested bacteria strains was Müeller Hinton Broth (MHB)/agar (MHA) (HiMedia Laboratories, India). Concentrations of approximately 105 to 106 CFU mL−1 were prepared from overnight broth culture of test strain and used for the antibacterial activity assays.2.6. Effect of curcumin, EHOPG and curcumin–EHOPG on cell growth monitored by measuring optical density (OD)
Curcumin, EHOPG and curcumin–EHOPG stock solutions of 4 mg mL−1, 1 mg mL−1 and 2 mg mL−1, respectively were sterilized by gamma irradiation at a dose of 10 kGy and used to examine the kinetics of bacterial growth using 96-well plates. pH of prepared colloids were adjusted to value 7. The wells of the microtiter plates, filled with 100 μL of two-fold serially diluted samples in water, were then inoculated with 100 μL of the bacterial suspension. Concentrations of curcumin ranged from 0.125 to 2 mg mL−1, for EHOPG from 0.125 to 0.5 mg mL−1 and for curcumin–EHOPG from 0.125 to 1 mg mL−1. Negative controls were wells with growth medium and curcumin, EHOPG or curcumin–EHOPG while MH broth with the tested bacteria served as positive controls. The microplate reader (ELx808, BioTek Instruments, Inc., USA) controlled by Gen5TM software was used to monitor the cell growth by measuring the turbidity OD630 (optical density at 630 nm) at 60 min intervals during 24 h. OD630 is a method used to determine the amount of light scattered by the bacteria rather than the amount of light absorbed and is proportional to the cell density.43 Plate was shaken for 10 s before every reading. The OD630 was corrected for OD of negative control at the same point of measurement.2.7. Bacteria growth in the presence of curcumin, EHOPG and curcumin/graphene determined by viable count
Bacteria growth in the presence of curcumin, EHOPG and curcumin–EHOPG was determined by macrodilution method, according to Klančnik et al.44 with slight modification. An aliquot of S. aureus inoculum was mixed with the same volume of curcumin, curcumin–EHOPG or EHOPG dilutions to give a final concentration of samples in the range of 0.25–2 mg mL−1, 0.25–1 mg mL−1 and 0.5 mg mL−1, respectively. Similarly, the curcumin, curcumin–EHOPG or EHOPG were added in 1 mL of E. coli suspension to give the final concentration of the samples of 2 mg mL−1, 1 mg mL−1 and 0.5 mg mL−1, respectively. These concentrations were chosen according to the results of previous assay. Negative controls were wells with growth medium and curcumin, EHOPG or curcumin–EHOPG while MH broth with the tested bacteria served as positive controls. The concentration of bacteria was determined at regular intervals during 24 h incubation by serial dilution of the samples and plating out the aliquot (10–100 μL) on the surface of MHA. The plates were incubated under aerobic conditions, at 37 °C for 24 h, and the total number of colonies was counted. The number of the tested bacteria (expressed as log10![[thin space (1/6-em)]](https://www.rsc.org/images/entities/char_2009.gif) CFU mL−1) was calculated by taking into account dilution of the samples and the amount plated out on the MHA. All experiments were performed in triplicates and the mean log10CFU mL−1 as well as the standard deviations were calculated.
CFU mL−1) was calculated by taking into account dilution of the samples and the amount plated out on the MHA. All experiments were performed in triplicates and the mean log10CFU mL−1 as well as the standard deviations were calculated.
2.8. Effect of curcumin, EHOPG and curcumin/graphene on cell growth visualized by SEM
Visualization of interactions between the curcumin, EHOPG and curcumin–EHOPG and bacterial strains was performed using scanning electron microscopy (SEM-JEOL JSM-6390LV) in vacuum with 10 kV acceleration voltages. Examination of the morphological changes of the bacterial cells was performed according to a slightly optimized version of the procedure described by Tyagi et al.45 S. aureus suspension of approximately 105 to 106 CFU mL−1 was treated with 1 mg mL−1 of curcumin, 0.5 mg mL−1 of EHOPG and 1 mg mL−1 of curcumin–EHOPG or left untreated as the control. E. coli suspension was treated with 2 mg mL−1 of curcumin, 0.5 mg mL−1 of EHOPG and 1 mg mL−1 of curcumin–EHOPG or left untreated as the control. These suspensions were incubated for an additional 8 h at 37 °C, harvested by centrifugation (6000 rpm, 10 min at 4 °C) and fixed with 2.5% glutaraldehyde over night at 4 °C. The obtained cell pellets were washed three times with 0.1 M sodium phosphate buffer (pH 7.2) and dehydrated with graded ethanol series 25%, 50%, 75%, 90% and 2 × 100%, 15 min each. The dehydrated samples were air dried immediately, followed by smearing on SEM stubs. All prepared samples of bacterial strains (treated with curcumin, EHOPG, curcumin–EHOPG and controls) were gold-covered by a Baltec scd 005 sputter coater accessory and recorded at room temperature. The samples are denoted as the following: E. coli control-ECC, S. aureus control-SAC, treated with curcumin-ECCU, and SACU, treated with EHOPG-ECEHOPG and SAEHOPG, treated with curcumin–EHOPG-ECCUEHOPG and SACUEHOPG, respectively. Samples elementary composition was obtained with energy dispersive spectroscopy (EDS, Oxford Aztec X-max). The scanned surface area was 10 × 10 μm2.2.9. Loss of 260 nm-absorbing material
The extracellular 260 nm-absorbing material released by the cells was determined using slightly modified method described by Carson et al.46 Bacterial suspensions (pretreatment sample) of approximately 105 to 106 CFU mL−1 were taken, diluted in a ratio 1:100, and filtered through a 0.22 μm pore size filter (Sartorius, Germany). The curcumin, EHOPG and curcumin–EHOPG were added in 1 mL of S. aureus suspension to reach final concentrations of 1 mg mL−1, 1 mg mL−1 and 0.5 mg mL−1, respectively. Cells without samples were used as a control. All the samples were incubated at 37 °C, and additional aliquots of control and treated cell suspensions were removed after 4 and 8 h, diluted and filtered as described above. The release of UV-absorbing material was measured using a Shimadzu UV-1800 UV-vis spectrophotometer. The obtained results of the measurements at 260 nm at each time were expressed as a proportion of the initial OD260 value. An OD260 is defined as the amount of light at a 260 nm wavelength which will be absorbed by an oligo if it is resuspended in 1 mL water and the concentration is read in a 1 cm quartz cuvette. The assay was carried out in triplicates.
3. Results
3.1. Surface morphology of the EHOPG, curcumin, curcumin–EHOPG
Surface morphology and microstructure of the curcumin, EHOPG and curcumin–EHOPG particles were studied on AFM and TEM and presented in Fig. 1a–h. Average lateral dimension of the EHOPG is 500 nm based on calculation of Gwyddion software whereas average height is 1 nm (inset of Fig. 1a). The obtained value of the EHOPG height is slightly higher than that for typical single layer graphene oxide (0.8 nm).47 It is thicker than the typical thickness of graphene (∼0.36 nm), due to bonding the oxygen-containing functional groups on each side of sheet.47–49 But the presence of numerous bonded oxygen functional groups (carbonyl, epoxy and hydroxyl) on the basal plane and the edges of EHOPG sheets contributes significantly to higher height value. TEM micrograph (Fig. 1e) confirms that the EHOPG sample is single layer graphene. There are several pores with average diameters of 15 nm over the entire surface of the EHOPG sample – Fig. 1a. The pores are uniformly distributed over the entire surface of the EHOPG sheets. Pores are clearly seen on the surface of the EHOPG sheet indicating the formation of porous graphene sheets. This porous single layer structure with a moderate density array of nanoscale holes punched in is defined as graphene nanomesh. It can be made only after exfoliation in 1 M solution of APS. In Fig. 1b, typical curcumin nanoparticle is presented. Its average diameter is 200 nm and it has spherical shape. The identical curcumin nanoparticles we can observe on TEM micrograph-Fig. 1f. In Fig. 1c, top view AFM image of the curcumin–EHOPG sample is presented. Average lateral dimension of curcumin functionalized EHOPG sheets is 5 μm whereas average height size is about 1 nm (inset of Fig. 1c). In Fig. 1d we can notice randomly distributed curcumin nanoparticles over the EHOPG surface. Curcumin nanoparticles are attached to the EHOPG surface on the unevenness (defect sites) of this surface. In Fig. 1g and h we can observe pores with average diameter of 150 nm. Functionalization of the EHOPG sheets with curcumin nanoparticles contributes to increase of pore diameters incorporated in the EHOPG sheets by APS.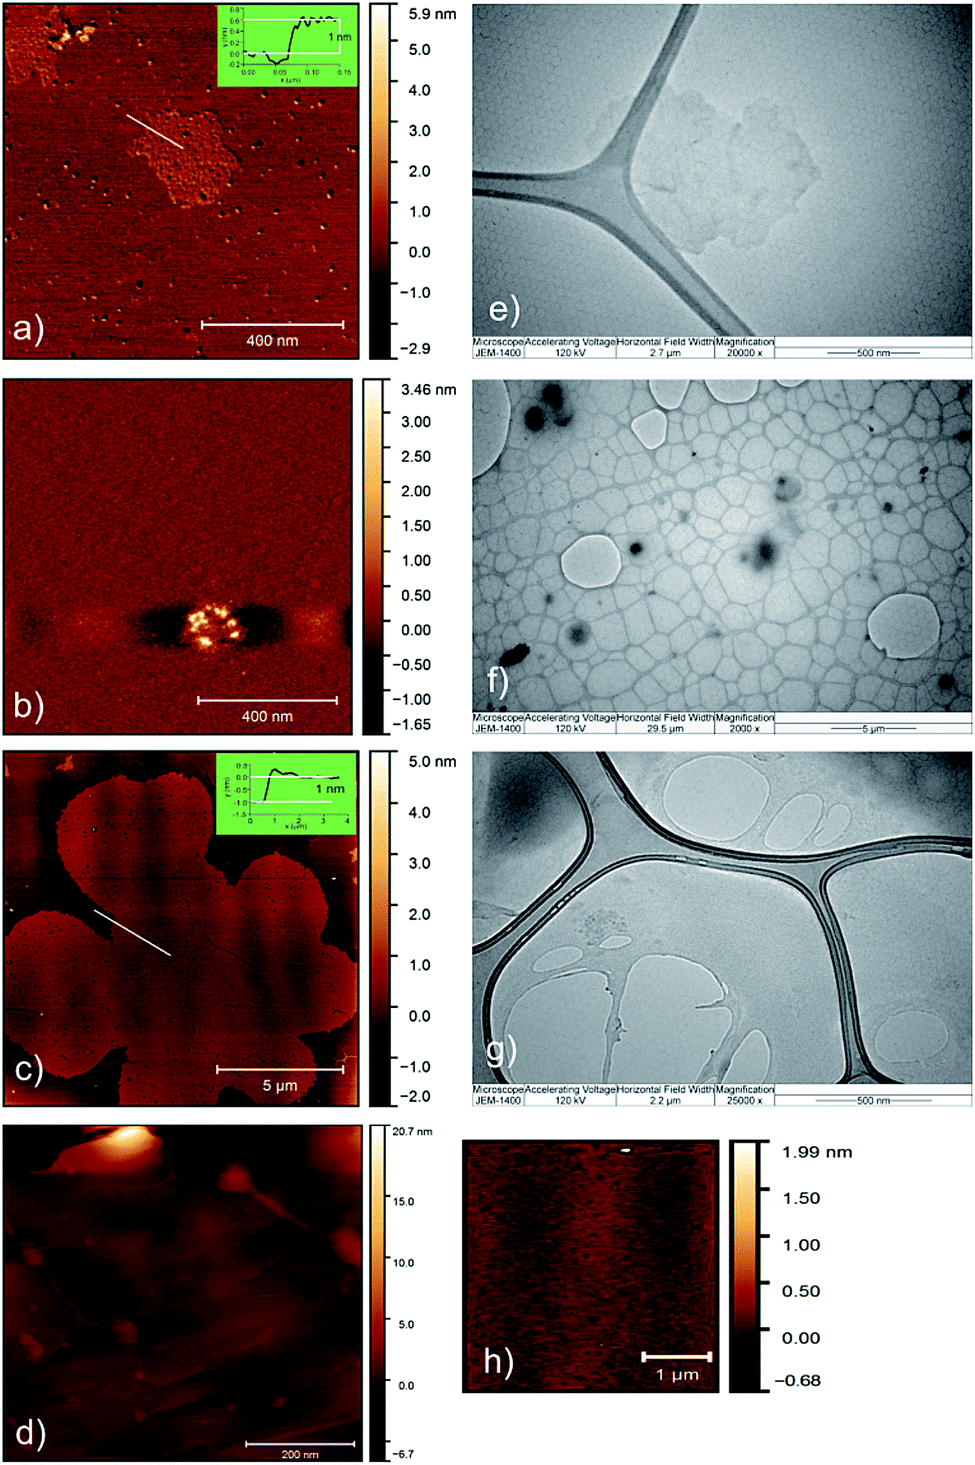 | ||
| Fig. 1 (a) Top view AFM image and height profile (inset) of the EHOPG sample; (b) top view AFM image of the curcumin sample; (c) top view AFM image and height profile (inset) of the curcumin–EHOPG sample; (d) top view magnified AFM image of the surface of the curcumin–EHOPG sample with randomly distributed curcumin nanoparticles; (e) TEM micrograph of the EHOPG sample; (f) TEM micrograph of the curcumin sample and (g) TEM image of the curcumin–EHOPG sample and (h) top view magnified AFM image of pores over the surface of the EHOPG. | ||
Average values of rms of the EHOPG and curcumin–EHOPG samples are determined by Gwyddion software42 and obtained values are 0.393 and 1.206 nm, respectively. After functionalization with curcumin rms of the curcumin–EHOPG sample is increased three times.
3.2. Zeta potential measurements of the EHOPG, curcumin and curcumin–EHOPG
Zeta potential is an important factor for characterizing the stability of colloids. We have measured zeta potentials of the EHOPG, curcumin and curcumin–EHOPG colloids. Values of zeta potentials of all samples are presented in Table 1. The pH values of aqueous colloids were tuned to 7 and 14. The measured values of zeta potentials indicate that colloids are stabilized electrostatically and have shown good stability. There was no sign of agglomeration of graphene sheets after more than two months. Colloids of all samples are negatively charged and stabilized by electrostatic forces. Values of zeta potentials are pH dependent which is consistent with the fact that the ionization of carboxylic acid groups is strongly related to pH.| Sample | Zeta potential (mV) | |
|---|---|---|
| pH 7 | pH 14 | |
| Curcumin | −45.48 | −56.0 |
| EHOPG | −30.2 | −41.7 |
| Curcumin–EHOPG | −41.9 | −41.6 |
By increasing pH of all colloids, zeta potentials are increased and their stabilities are much better, except for the curcumin–EHOPG colloids. For these colloids values of zeta potential have not changed. In the acid environment all colloids become unstable.
3.3. UV-vis and FTIR measurements of EHOPG, curcumin and curcumin–EHOPG
Fig. 2a presents UV-vis spectra of the EHOPG sample-curve 1, the curcumin sample-curve 2 and the curcumin–EHOPG sample-curve 3. As for the EHOPG sample we can notice one broad absorption peak at 270 nm which is assigned to π–π transition of C–C bonds.50 The curcumin spectrum exhibits two absorption bands: the first at 235 nm which is assigned to π–π transition of C–C bonds; and the second at 422 nm which is corresponded to n–π* transition of C![[double bond, length as m-dash]](https://www.rsc.org/images/entities/char_e001.gif) O bonds.19 As for the curcumin–EHOPG sample, one absorption peak at 270 nm which corresponds to π–π transition of C–C bonds is detected. The second shoulder at 472 nm corresponds to n–π* transition of CO bonds.
O bonds.19 As for the curcumin–EHOPG sample, one absorption peak at 270 nm which corresponds to π–π transition of C–C bonds is detected. The second shoulder at 472 nm corresponds to n–π* transition of CO bonds.
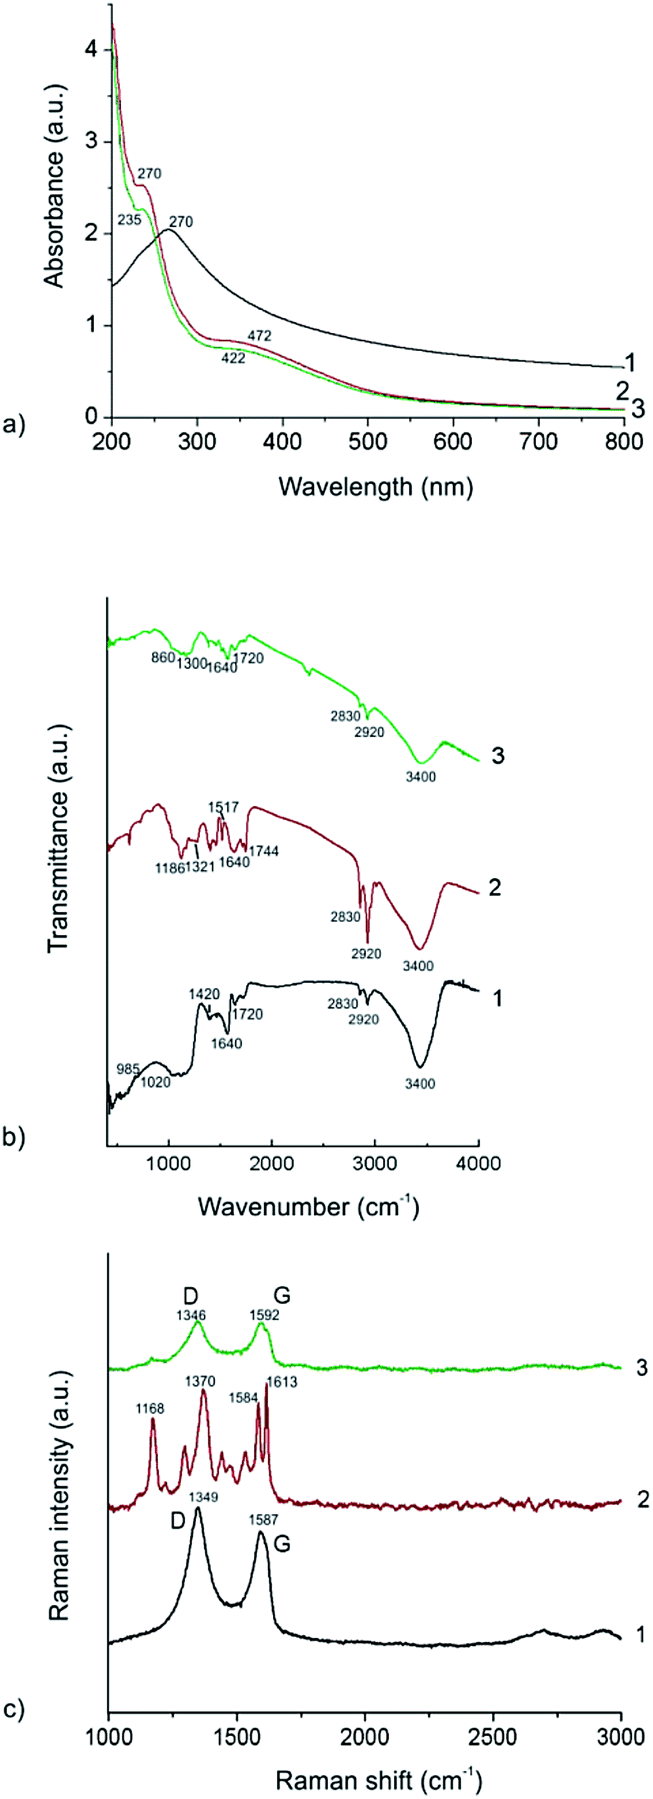 | ||
| Fig. 2 (a) UV-vis spectra of the EHOPG sample-curve 1; the curcumin sample-curve 2; the curcumin–EHOPG sample; (b) FTIR spectra of the EHOPG sample-curve 1; the curcumin sample-curve 2; curcumin–EHOPG sample-curve 3; (c) Raman spectra of the EHOPG-curve 1; the curcumin sample-curve 2; curcumin–EHOPG sample-curve 3. | ||
The FTIR spectra of the curcumin, EHOPG and curcumin–EHOPG particles are presented in Fig. 2b. The FTIR spectra of all samples show one wide peak at 3400 cm−1 which stem from O–H vibrations and two small peaks at 2830 and 2920 cm−1 which stem from C–H stretching vibrations.
As for EHOPG sample (curve 1), the peak at 2170 cm−1 indicates skeletal vibrations from un-oxidized graphitic domains. The peak at 1720 cm−1 indicate the presence of CO stretching vibrations while the peaks at 1420 and 1050 cm−1 stem from C–O stretching vibrations. The peak at 1640 cm−1 stem from mixing of CC and CO vibrations. The peaks at 985 and 1020 cm−1 stem from intercalated sulfate ions.41
As for the curcumin sample (curve 2), we can identify several peaks which stemming from carbonyl groups (1744, 1714, 1640, 1517 cm−1) whereas the band at 1321–1186 cm−1 stem from CH3 vibrations.19 The peak at 1120 cm−1 stem from O–CH3 vibrations. The peaks at 2830 and 2920 cm−1 which stemming from C–H stretching vibrations appears in the curcumin FTIR spectrum due to the presence of ethanol.
As for the curcumin–EHOPG sample (curve 3), there are overlappings of some bands between 860 and 1780 cm−1. Band at 860–1300 cm−1 stem from mixing vibrations of sulfate ions and CH3 and O–CH3 vibrations whereas the peaks at 1640 and 1720 cm−1 stem from CO vibrations.
3.4. Raman spectroscopy of EHOPG, curcumin, curcumin–EHOPG
Raman spectroscopy is a very powerful tool for chemical analysis of different materials especially carbon nanomaterials.51 As for graphene there are three characteristic features: G band at 1580 cm−1 which is assigned to the E2g phonon of sp2 bonds of carbon atoms, the D band at 1350 cm−1 as a breathing mode of k-point phonons of A1g symmetry, which is attributed to local defects and disorders particularly the defects located at the edges of graphene and 2D band at 2700 cm−1 which represents the second harmonic of the D band.52In Fig. 2c, Raman spectra of the EHOPG (curve 1), curcumin (curve 2) and curcumin–EHOPG (curve 3) are presented. Raman spectra of all samples are normalized to G band (the EHOPG and curcumin–EHOPG) and to the highest peak intensity of curcumin sample. Raman spectra of the EHOPG and curcumin–EHOPG are fitted with 2 Lorentzian peaks and the fitting results are given in Table 2.
| Sample | D band (cm−1) | G band (cm−1) | FWHM (cm−1) |
|---|---|---|---|
| EHOPG | 1349.4 | 1586.6 | 61.65 |
| Curcumin–EHOPG | 1346.1 | 1591.9 | 62.01 |
Based on data presented in Table 2 we can conclude the following: the G band of the EHOPG is up-shifted 6.6 cm−1 compared to the starting material (HOPG-1580 cm−1) due to intercalation of sulfate ion during the exfoliation process. After functionalization of the EHOPG with curcumin G band is up-shifted 5.3 cm−1 additionally. This up-shift indicates that there is a charge transfer between the EHOPG and curcumin and EHOPG gives their electrons to curcumin. The ratio between carbon atoms with sp2 and sp3 hybridization in the graphitic lattice is an indication of the degree of oxidation or a covalent functionalization reaction. This ratio is estimated using Raman spectroscopy as the ID/IG ratio, where ID and IG are the intensities of the peaks at ∼1350 and 1580 cm−1.53 The ID/IG ratio has been changed from 1.03 (EHOPG) to 1.06 (curcumin–EHOPG). This difference is very small (about 3%). But it can indicate covalent functionalization of EHOPG by curcumin. This result is in a strong correlation with zeta potential measurements which have shown long-term stability of these colloids.
3.5. Electron paramagnetic resonance spectroscopy of EHOPG, curcumin and curcumin–EHOPG
EPR spectroscopy was used to determinate the ability of the EHOPG, curcumin and curcumin–EHOPG samples to produce different ROS: singlet oxygen (1O2), hydroxyl (HO˙) and superoxide radical (O2−˙).The singlet oxygen production of studied dispersions was analyzed using a selective trap agent TEMP (Fig. 3). The technique is based on reaction between TEMP and singlet oxygen which leads to formation a stable, EPR active compound, 2,2,6,6-tetramethylpiperidine-1-oxyl (TEMPO). The singlet oxygen production in sample was measured before and after photo-excitation.
 | ||
| Fig. 3 EPR spectra of TEMP solution in dark conditions (T = 0 minutes, black line) and after 10 minutes of UV-light exposure (T = 10, red curve), TEMP mixed with the EHOPG, curcumin and curcumin–EHOPG at T = 0 and 10 minutes. | ||
The control measurements, TEMP solution before and after light exposure showed a small TEMPO formation. After adding samples, there are no significant changes in the intensity of signal characteristic for TEMPO. Even after 10 minutes of light exposure, there is no intensity increase of TEMPO signal.
As for production of hydroxyl and superoxide radicals, we used DMPO as a spin trap. First, we measured DMPO with and without light exposure and noticed that there is no significant EPR signals. But with Fenton reaction, very strong, EPR signals can be observed.
EPR measurements of samples mixed with DMPO did not show any differences compared to EPR spectra of clean DMPO-Fig. 4. Even after light exposure, the production of hydroxyl and superoxide radicals cannot be detected. These results suggest that analyzed samples cannot produces oxygen contacting radical species, under studied conditions.
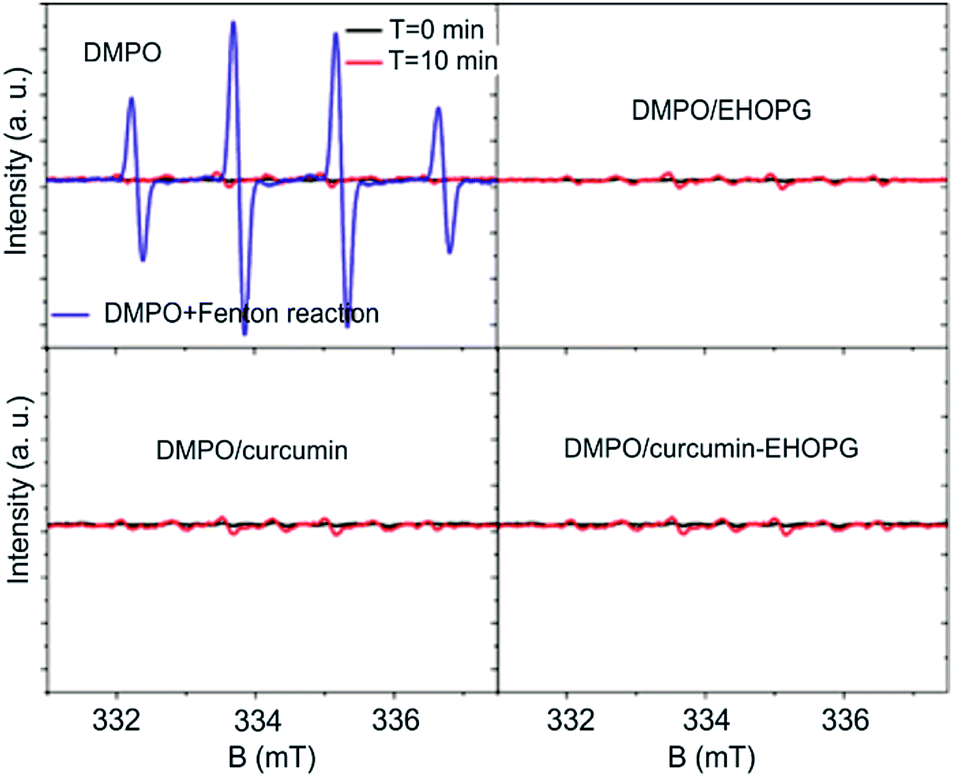 | ||
| Fig. 4 EPR spectra of DMPO solution in dark conditions (T = 0, black line), after 10 minutes of UV-light exposure (T = 10, red curve), with Fenton reaction (blue curve), DMPO mixed with EHOPG, curcumin and curcumin–EHOPG at T = 0 and 10 minutes. | ||
These results suggest that investigated samples do not produce singlet oxygen. Furthermore, prolonged UV photo-excitation did not caused changes in singlet oxygen production.
There are some reports concerning singlet oxygen and superoxide production of curcumin.54,55 Curcumin produced singlet oxygen upon irradiation (wavelength higher than 400 nm) in toluene or acetonitrile; in acetonitrile curcumin also quenched 1O2. In such case the degradation of curcumin after photoexcitation must proceed though the triplet excited state of curcumin.56 Photo-physical studies reported the lifetime of triplet excited state of curcumin to be in microseconds, suggesting that the degradation may proceed very fast and compete with singlet oxygen formation. Our EPR measurements of singlet oxygen and superoxide have shown that the EHOPG, curcumin and curcumin–EHOPG samples do not produce ROS under any conditions.
3.6. Antibacterial activity of EHOPG, curcumin and curcumin–EHOPG
The effect of the EHOPG, curcumin, and curcumin–EHOPG on the growth of E. coli and S. aureus was investigated. The growth curves of tested bacteria treated with different concentrations of EHOPG (0.125–0.5 mg mL−1), curcumin (0.125–2 mg mL−1) and curcumin–EHOPG (0.125–1 mg mL−1), evaluated by measuring of OD630 are shown in Fig. 5a–f. Due to the presence of the material that affects the interpretation of the data, the optical density of the bacteria cultures was corrected for OD630 of sterile media with the EHOPG, curcumin or curcumin–EHOPG at each point on the curve. The material influenced the results by changing the colour of the medium or by its own precipitation by the end of the incubation.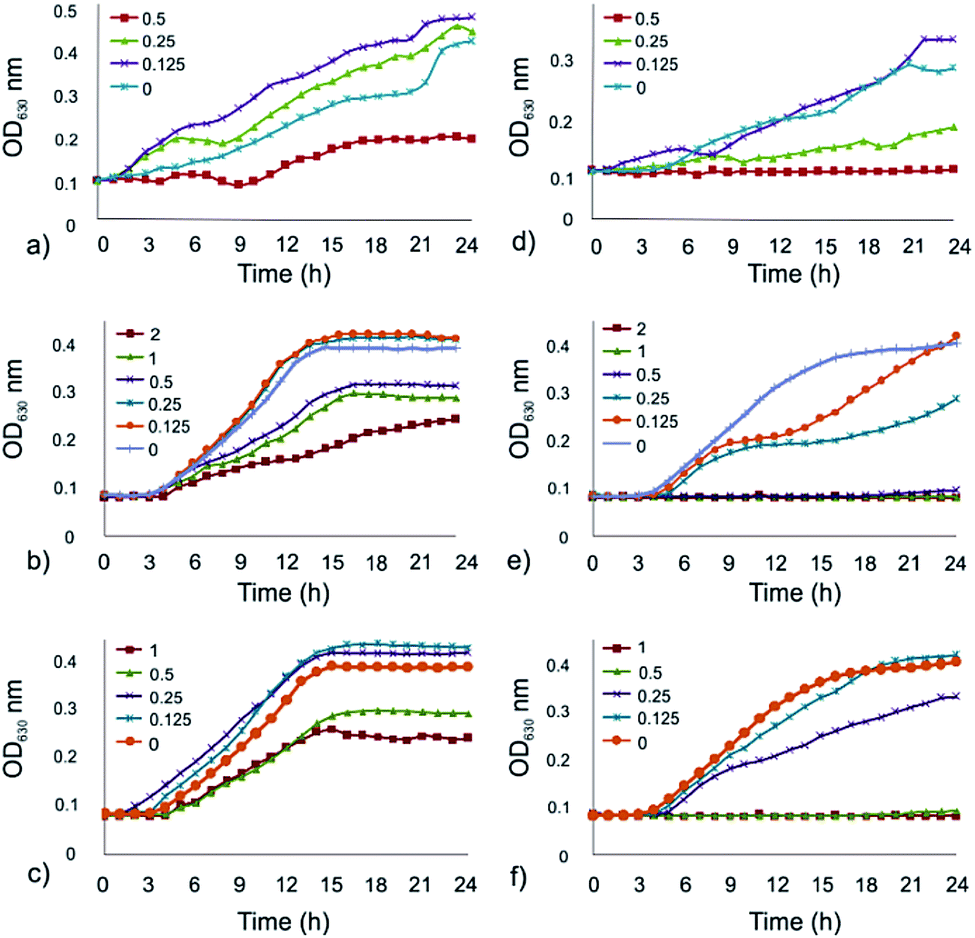 | ||
| Fig. 5 Optical density of test culture in the media supplemented with: (a) EHOPG at the concentration 0–0.5 mg mL−1 – E. coli, (b) curcumin at the concentration 0–2 mg mL−1 – E. coli, (c) curcumin–EHOPG at the concentration 0–1 mg mL−1 – E. coli, (d) EHOPG at the concentration 0–0.5 mg mL−1 – S. aureus, (e) curcumin at the concentration 0–2 mg mL−1 – S. aureus, (f) curcumin–EHOPG at the concentration 0–2 mg mL−1 – S. aureus. | ||
The results of measuring of OD630 showed that E. coli cells were able to grow in the presence of the applied concentrations of the samples (Fig. 5a–c). At the concentrations of curcumin ranging from 0.5 to 2 mg mL−1 lower OD630 values were detected compared to control, the same results were obtained with 0.5 mg mL−1 of the EHOPG and with 0.5 and 1 mg mL−1 of the curcumin–EHOPG. Lower concentrations of samples (curcumin, EHOPG and curcumin–EHOPG) did not influence the growth of E. coli which was able to reach the same final OD630 as untreated cells.
In the case of S. aureus treated with the EHOPG (Fig. 5d), a bacterial growth phase was not detected when the concentration of 0.5 mg mL−1 was used. The concentration 0.25 mg mL−1 of the EHOPG induced an extended lag phase and the attained OD630 value amounted to half of the maximum. S. aureus cells exposed to 0.125 mg mL−1 of EHOPG were able to grow undisturbed. When the concentrations of curcumin were in the range of 0.5 to 2 mg mL−1, no growth of S. aureus could be detected within 24 h (Fig. 5e). The treatment with 0.25 mg mL−1 of curcumin resulted in a lower final OD630 value, while at 0.125 mg mL−1 S. aureus cells were able to grow undisturbed. Similar results were obtained when S. aureus cells were treated with the curcumin–EHOPG (Fig. 5f).
The concentrations of 0.5 and 1 mg mL−1 acted inhibitory, while at 0.25 mg mL−1 of the curcumin–EHOPG lower final OD630 value was observed. At the lowest tested concentration (0.125 mg mL−1) of curcumin–EHOPG growth curve run parallel with that of the positive control and reached the same final OD630.
Since the total number of bacteria, including live and dead ones is assayed by OD630, a decline phase could not be detected on the growth curves. Additionally, considering the difficulty in interpreting results due to precipitation of material, an alternative viable count assay was utilized. As shown in Table 3, E. coli cells were able to grow in the presence of EHOPG, curcumin and curcumin–EHOPG at the concentrations of 0.5 mg mL−1, 2 mg mL−1 and 1 mg mL−1, respectively but the decline phase started earlier compared with the control.
CFU mL−1 determined by the broth macrodilution methoda
| blog10CFU mL−1 |
|||||
|---|---|---|---|---|---|
| Bacterial strain | 0 h | 3 h | 6 h | 9 h | 24 h |
| a C – control, log10CFU mL−1 without EHOPG, curcumin and curcumin–EHOPG.b Data are expressed as mean ± standard deviation (n = 3).c Within the same column, means followed by different letters are significantly different at α ≤ 0.05 (ANOVA, Tukey's HSD test). |
|||||
| ECC | 5.3 ± 0.3ac | 7.0 ± 0.5a | 8.6 ± 0.3a | 8.7 ± 0.3a | 9.9 ± 0.6a |
| U (2 mg mL−1) | 5.2 ± 0.2a | 6.4 ± 0.2a | 7.7 ± 0.3b | 8.2 ± 0.1 ab | 7.3 ± 0.2b |
| ECEHOPG (0.5 mg mL−1) | 5.4 ± 0.3a | 6.3 ± 0.1a | 7.7 ± 0.2b | 8.0 ± 0.2b | 7.2 ± 0.2b |
| ECCUEHOPG (1 mg mL−1) | 5.3 ± 0.2a | 6.3 ± 0.1a | 7.8 ± 0.2b | 8.5 ± 0.2 ab | 7.5 ± 0.3b |
| SAC | 5.1 ± 0.2a | 6.5 ± 0.2a | 7.2 ± 0.4a | 8.5 ± 0.4a | 8.8 ± 0.3a |
| SACU (2 mg mL−1) | 4.8 ± 0.3a | 4.3 ± 0.1c | 2.9 ± 0.2e | 0.0 ± 0.0g | 0.0 ± 0.0e |
| SACU (1 mg mL−1) | 5.0 ± 0.1a | 4.5 ± 0.2c | 4.4 ± 0.1d | 4.0 ± 0.1f | 3.8 ± 0.2d |
| SACU (0.5 mg mL−1) | 5.0 ± 0.1a | 4.5 ± 0.2c | 5.3 ± 0.2c | 5.6 ± 0.2d | 6.1 ± 0.3c |
| SACU (0.25 mg mL−1) | 5.1 ± 0.2a | 5.2 ± 0.2b | 6.1 ± 0.1b | 6.5 ± 0.3c | 8.0 ± 0.2b |
| SAEHOPG (0.5 mg mL−1) | 4.9 ± 0.2a | 5.4 ± 0.2b | 5.2 ± 0.2c | 5.4 ± 0.2d | 5.7 ± 0.3c |
| SACUEHOPG (1 mg mL−1) | 5.2 ± 0.3a | 4.4 ± 0.1c | 4.8 ± 0.2 cd | 4.7 ± 0.2e | 4.1 ± 0.1d |
| SACUEHOPG (0.5 mg mL−1) | 4.9 ± 0.2a | 5.0 ± 0.1b | 5.3 ± 0.2c | 6.0 ± 0.2 cd | 6.0 ± 0.2c |
| SACUEHOPG (0.25 mg mL−1) | 5.0 ± 0.1a | 5.1 ± 0.2b | 6.4 ± 0.4b | 7.5 ± 0.3b | 8.8 ± 0.4a |
Treatment of S. aureus with 2 mg mL−1 of curcumin resulted in approximately 1 log10 reduction during the first 6 h and after 9 h bactericidal effect was established. The concentration of 1 mg mL−1 of curcumin and curcumin–EHOPG was noted as minimum inhibitory concentration (MIC) since a significant decrease (>90%) in inoculum viability after 24 h of incubation was observed. At the concentration of 0.5 mg mL−1 of curcumin, EHOPG and curcumin–EHOPG bacteriostatic activity was observed and after 24 h there was no significant difference between samples (α ≤ 0.05).
3.7. Morphology of bacteria strains
Fig. 6a–d present surface morphology of ECC, ECEHOPG, ECCU, ECCUEHOPG samples whereas Fig. 6e–h present the corresponding EDS spectra of these samples. As we can observe from Fig. 6a average lengths of E. coli strains are 2 μm. In Fig. 6b we could detect very small visual damages on bacteria membrane after interaction with the EHOPG. Similar changes can be observed in Fig. 6c and d for interactions of E. coli with the curcumin and curcumin–EHOPG.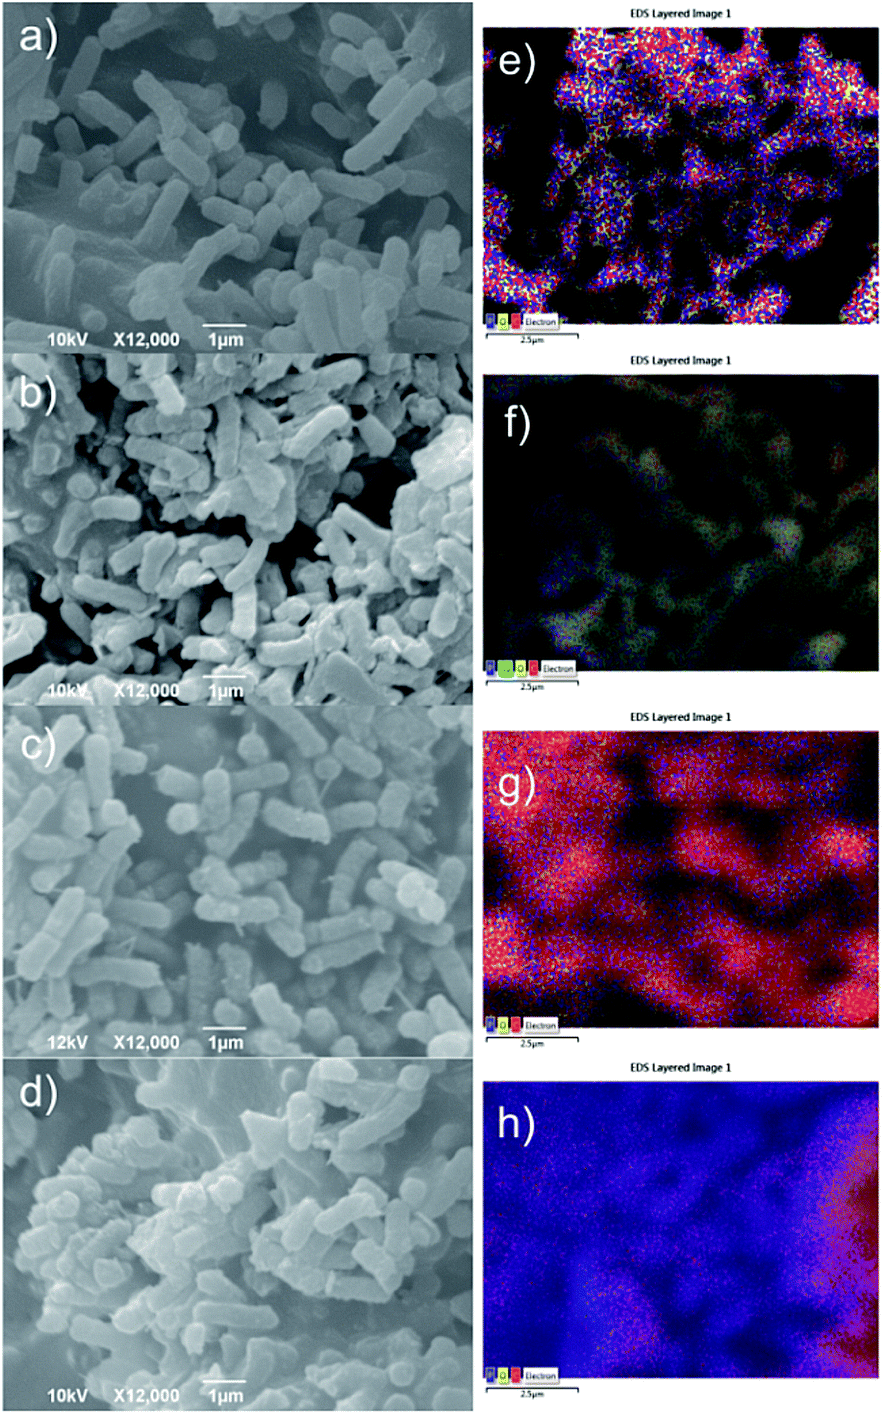 | ||
| Fig. 6 SEM micrographs of (a) ECC, (b) ECEHOPG, (c) ECCU, (d) ECCUEHOPG samples and corresponding EDS distribution of detected elements over the scanned area of the sample (e–h). | ||
EDS distribution of elements on untreated bacteria membrane have shown homogeneous distribution of C, O, Na and P on bacteria membrane-Fig. 6e. After interaction with the EHOPG, curcumin, curcumin–EHOPG, distributions of certain elements have been changed. The EDS qualitative analysis of the ECC, ECEHOPG, ECCU and ECCUEHOPG samples presented in Table 4 have shown that the content of C has changed very low, content of O is 3 and 5 times higher for the ECEHOPG and ECCU, respectively. For the ECCUEHOPG sample the content of O decreased slightly whereas the content of P is 2.3 times higher compared to the ECC. In Fig. 6f we can observe non-uniform distribution of P, whereas Fig. 6g presents uniform distributions of C and P. Fig. 6h indicates uniform distribution of P. We can observe in this figure that P could be detected all over investigated surface even in areas that bacteria strains could not be noticed. This fact may indicate bacterial membrane damage.
| Sample | C | P | Na | O | P:C |
O:C |
|---|---|---|---|---|---|---|
| ECC | 97.11 | 0.63 | — | 2.25 | 0.006 | 0.023 |
| ECEHOPG | 92.41 | — | 1.30 | 6.29 | — | 0.068 |
| ECCU | 88.12 | 0.83 | — | 11.05 | 0.009 | 0.125 |
| ECCUEHOPG | 96.54 | 1.47 | 0.15 | 1.84 | 0.015 | 0.019 |
| SAC | 82.45 | 2.88 | 2.47 | 12.20 | 0.035 | 0.148 |
| SAEHOPG | 90.37 | 1.79 | 2.27 | 5.58 | 0.020 | 0.062 |
| SACU | 94.42 | — | 0.12 | 5.46 | — | 0.058 |
| SACUEHOPG | 94.38 | — | 0.07 | 5.55 | — | 0.059 |
Fig. 7a–d present SEM micrographs of surface morphology of SAC, SAEHOPG, SACU and SACUEHOPG samples whereas Fig. 7e–h present corresponding EDS distributions of elements detected on bacteria membrane. As can be seen from Fig. 7a average diameter of S. aureus is 500 nm. In Fig. 7b one can observe very small changes on bacteria membranes after interaction with the EHOPG.
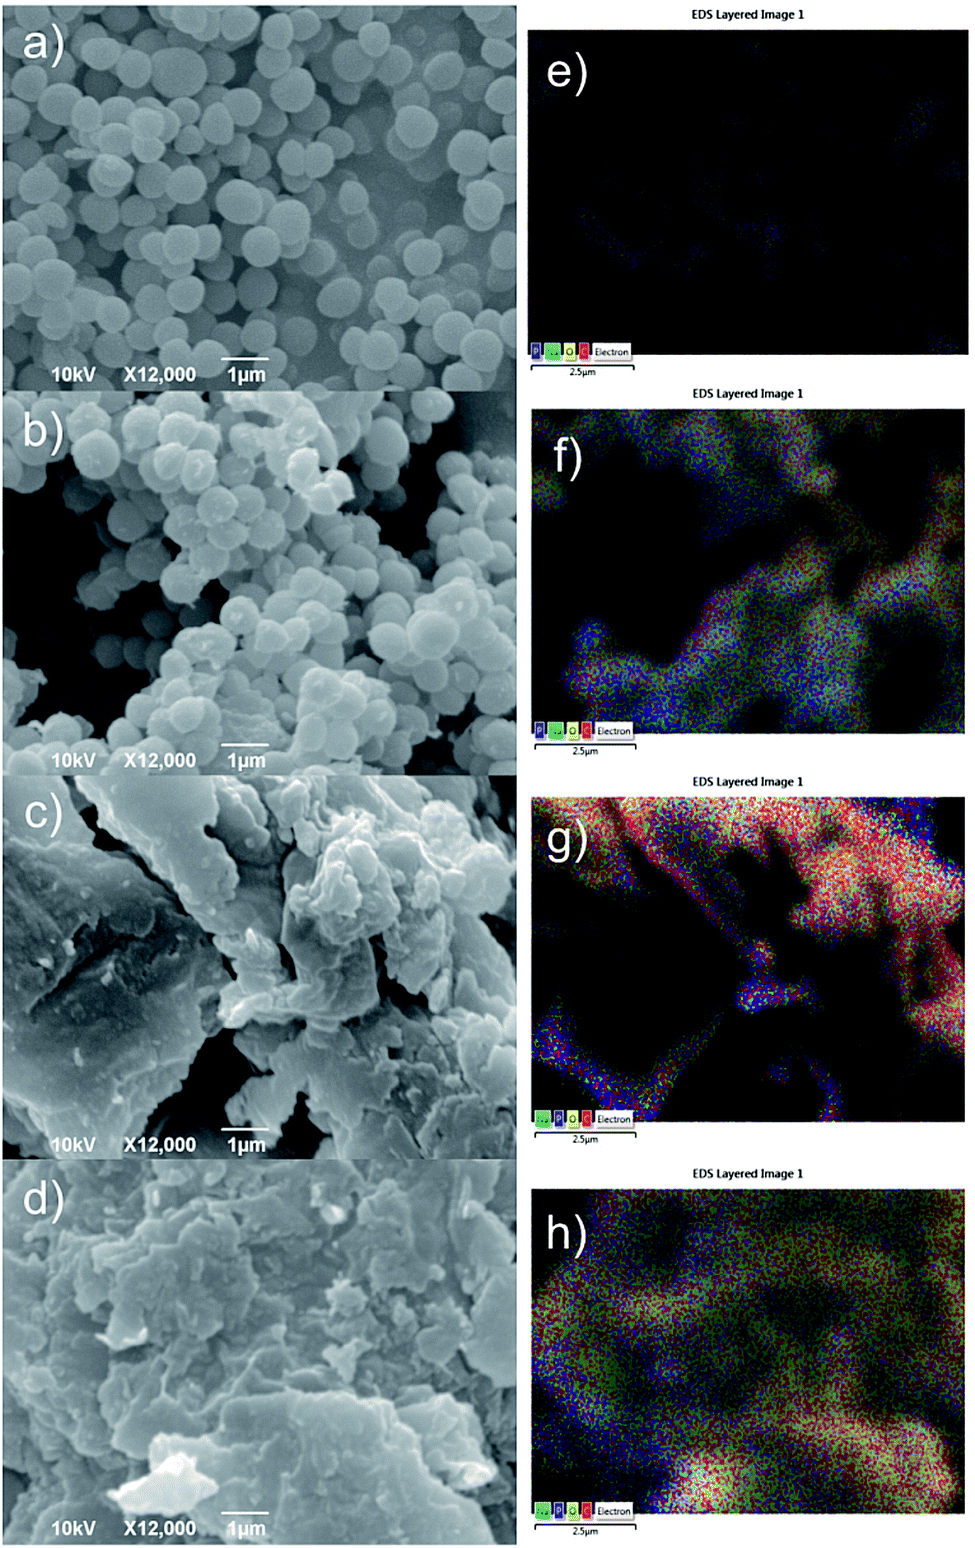 | ||
| Fig. 7 SEM micrographs of (a) SAC, (b) SAEHOPG, (c) SACU, (d) SACUEHOPG samples and corresponding EDS distribution of detected elements over the scanned area of the sample (e–h). | ||
In Fig. 7c and d we cannot observe any bacteria strains. EDS distribution of detected elements are homogeneous only on untreated S. aureus (Fig. 7e) whereas there are some changes in distribution of elements of treated bacteria strains (Fig. 7f–h). Table 4 presents changes of contents of detected elements on bacteria membrane. The content of C increased after interaction of S. aureus with all samples whereas the content of O decreased almost twice after interaction of S. aureus with all samples. P could not be detected over the scanned area on the SACU and SACUEHOPG. Complete absence of P on bacteria membrane after interaction with the curcumin and curcumin–EHOPG may indicate membrane damage.
3.8. Loss of 260 nm-absorbing material
The presence of materials, in cell free medium, that absorb at 260 nm indicate that large molecules (e.g. nucleic acids) have been lost from the cell interior and that major membrane damage has occurred. The OD260s values of the filtrates from S. aureus control suspensions remained approximately the same after 4 h as well as after 8 h. The OD260s of the filtrates from S. aureus suspensions treated with 1 mg mL−1, 0.5 mg mL−1 and 1 mg mL−1 of curcumin, EHOPG and curcumin–EHOPG also remained almost the same during the whole assay period (Fig. 8).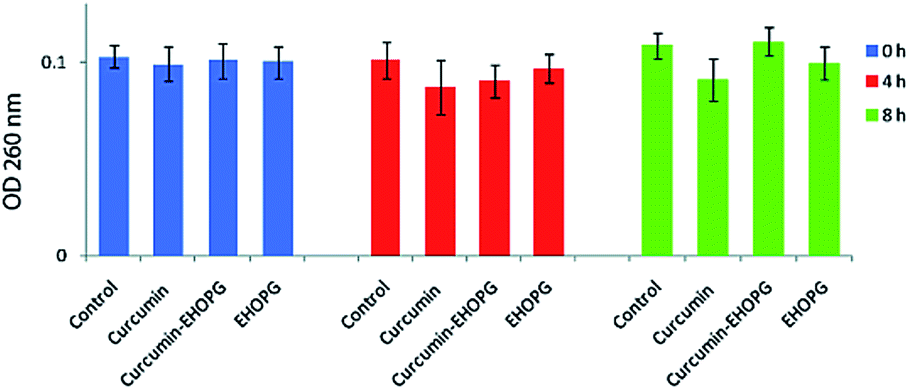 | ||
| Fig. 8 Presence of 260 nm-absorbing material in the filtrates of S. aureus after treatment with curcumin, curcumin–EHOPG and EHOPG at 4 and 8 h, compared to S. aureus control suspension. The mean ± SD for three replicates are illustrated. | ||
4. Discussion
Different parameters such as lateral dimension of graphene sheets, surface roughness, concentration, functionalization, dispersibility, chemical composition, hydrophobicity affect significantly the antibacterial activity of graphene and curcumin–graphene nanomesh hybrids.14In this study we have tried to investigate antibacterial activity of the EHOPG, curcumin and curcumin–graphene nanomesh hybrids. Our goal was to consider the effect of EHOPG functionalization by curcumin on its own antibacterial activity.
We have established that the EHOPG functionalization by curcumin contributes to the increase of lateral dimension of graphene sheets ten times, pores incorporated in the graphene sheets increase ten times as well and surface roughness of the curcumin–EHOPG sample increases three times. EPR measurements have shown that there is no production of singlet oxygen and superoxide by any of the investigated samples.
In our study the EHOPG sample showed bacteriostatic activity toward S. aureus in the concentration of 0.5 mg mL−1 whereas the EHOPG sample did not induce the inhibition of E. coli bacterial growth in concentrations of 0.125 and 0.25 mg mL−1. Treatment with 0.5 mg mL−1 concentration of the EHOPG sample resulted in a lower final OD630 value. The same minimum inhibitory concentration (1 mg mL−1) was determined for curcumin and curcumin–EHOPG samples toward S. aureus. All tested samples had more pronounced antibacterial activity against Gram positive bacteria, S. aureus compared with E. coli as a representative of Gram negative strains. Schematic diagram of possible antibacterial activity of curcumin–EHOPG nanomesh hybrid is presented in Fig. 9.
 | ||
| Fig. 9 Schematic diagram of possible mechanism of antibacterial activity of curcumin–EHOPG nanomesh hybrid. | ||
An explanation for the different sensitivity among the strains could be the outer membrane surrounding the peptidoglycan (cell wall) in Gram-negative bacteria, which restricts diffusion through its lipopolysaccharide (LPS) covering. In addition, the periplasmatic space contains enzymes (such as hydrolytic and detoxifying) which are capable of breaking down foreign molecules introduced from the environment.38 On the other hand, Gram-positive bacteria lack the outer membrane and therefore are expected to be more sensitive to exposure of the curcumin, curcumin–EHOPG and EHOPG.
In previous reports by other authors are pointed out that the possible mechanism of antibacterial activity of curcumin is membrane damage.27 Furthermore, curcumin caused membrane permeabilization of both E. coli and S. aureus despite their significantly different cell wall properties. It was found also that when peptidoglycan (PGN) from S. aureus combined with curcumin gradually blocked the antibacterial activity of curcumin in concentration of 0–125 μg mL−1.57 Microscopy analysis has shown damage of the cell wall, disruption of the cytoplasmic contents, broken cell membrane and cell lysis after the treatment with curcumin. As for graphene possible mechanisms of its antibacterial activity are membrane rupture and oxidative stress.
Regarding to the obtained experimental results we have assumed that curcumin is responsible for the inhibition of bacterial growth. Furthermore, curcumin–EHOPG nanomesh hybrid has stronger antibacterial activity toward S. aureus compared to E. coli. In the case of E. coli bacterial strains, samples expressed similar activity. The membrane walls of most Gram-positive bacteria consist mainly of numerous layers (up to 30) of glycan, with amino acid bridges connecting each layer to other layers above and below it. Lipopolysaccharide is only attached to the outer membrane of the two layers in Gram-negative bacteria.57 Curcumin may attach to the membrane wall especially to peptidoglycan and interrupt its integrity.
Since the pronounced leakage of intracellular materials was not observed at 260 nm, when S. aureus cells were treated with 1 mg mL−1, 1 mg mL−1 and 0.5 mg mL−1 of curcumin, curcumin–EHOPG and EHOPG, respectively it can be concluded that the bacterial membrane wall was the primary target on which samples acted. Moreover, previous studies reported that the leakage of intracellular materials was induced at bactericidal concentrations of phenolic compounds while on the other hand, bacteriostatic concentrations did not cause the draining out of 260 nm absorbing material.58 Curcumin–graphene nanomesh hybrids have stronger antibacterial activity toward S. aureus because their membrane walls have simpler structure that those of E. coli. Mitra et al. obtained similar results with curcumin loaded collagen functionalized nano graphene oxide scaffold.35
5. Conclusions
In this study we have used curcumin nanoparticles to functionalize exfoliated graphene sheets. Exfoliated graphene is a material with very interesting properties because it is at the same time water dispersible and conductive. It is synthesized by electrochemical exfoliation of HOPG in APS solution. Curcumin–EHOPG nanomesh hybrids were obtained by solvent exchange method. Obtained curcumin–EHOPG nanomesh hybrids have shown strong antibacterial activity especially toward S. aureus. As for E. coli bacteria strains curcumin and curcumin–EHOPG samples inhibited their growth in the same concentration. Obtained results demonstrate that curcumin–EHOPG nanomesh hybrids are good candidates for antibacterial devices.Conflicts of interest
There are no conflicts of interest to declare.Acknowledgements
This research was supported by the Ministry of Education, Science and Technological Development of the Republic of Serbia (project no. 172003 and III 46010) and multilateral scientific and technological cooperation in the Danube region (DS021). Research was also supported by the SASPRO Programme project 1237/02/02-b. The research leading to these results has received funding from the People Programme (Marie Curie Actions) European Union's Seventh Framework Programme under REA grant agreement No. 609427. Research has been further co-funded by the Slovak Academy of Sciences. We are gratefully acknowledged to Mrs Marcela Kimličkova for performing zeta potential measurements.Notes and references
- K. S. Novoselov, A. K. Geim, S. V. Morozov, D. Jiang, Y. Zhang, S. V. Dubonos, I. V. Grigorieva and A. A. Firsov, Science, 2004, 306, 666 CrossRef CAS PubMed.
- S. Bae, H. Kim, Y. Lee, X. Xu, J. S. Park, Y. Zheng, J. Balakrishnan, T. Lei, H. R. Kim, Y. I. Song, Y. J. Kim, K. S. Kim, B. Özyilmaz, J. H. Ahn, B. H. Hong and S. Iijima, Nat. Nanotechnol., 2010, 5, 574 CrossRef CAS PubMed.
- S. Y. Yang, W. N. Lin, Y. L. Huang, H. W. Tien, J. Y. Wang, C. C. M. Ma, S. M. Li and Y. S. Wang, Carbon, 2011, 49, 793 CrossRef CAS.
- N. W. Pu, Y. Y. Peng, P. C. Wang, C. Y. Chen, J. N. Shi, Y. M. Liu, M. D. Ger and C. L. Chang, Carbon, 2014, 67, 449 CrossRef CAS.
- Q. Zhao and S. Hao, J. Compos. Mater., 2007, 41, 201 CrossRef CAS.
- A. Reina, X. Jia, J. Ho, D. Nezich, H. Son, V. Bulovic, M. S. Dresselhaus and J. Kong, Nano Lett., 2008, 9, 30 CrossRef PubMed.
- S. Lee, K. Lee and Z. Zhong, Nano Lett., 2010, 10, 4702 CrossRef CAS PubMed.
- P. W. Sutter, J. I. Flege and E. A. Sutter, Nat. Mater., 2008, 7, 406 CrossRef CAS PubMed.
- K. Muthoosamy and S. Manickam, Ultrason. Sonochem., 2017, 39, 478 CrossRef CAS.
- K. Muthoosamy, R. G. Bai and S. Manickam, Curr. Drug Delivery, 2014, 11, 701 CrossRef CAS.
- K. Muthoosamy, R. G. Bai, J. B. Abubakar, S. M. Sudheer, H. N. Lim, H. S. Loh, N. M. Huang, C. H. Chia and S. Manickam, Int. J. Nanomed., 2015, 10, 1505 CAS.
- J. Liu, C. K. Poh, D. Zhan, L. Lai, S. H. Lim, L. Wang, X. Liu, N. G. Sahoo, C. Li, Z. Shen and J. Lin, Nano Energy, 2013, 2, 377 CrossRef CAS.
- M. Zhou, J. Tang, Q. Cheng, G. Xu, P. Cui and L. Qin, Chem. Phys. Lett., 2013, 572, 61 CrossRef CAS.
- H. M. Hegab, A. ElMekawy, L. Zou, D. Mulchahy, C. P. Saint and M. Ginić Marković, Carbon, 2016, 105, 362 CrossRef CAS.
- A. M. Pinto, I. C. Gonçalves and F. D. Magalhães, Colloids Surf., B, 2013, 111, 188 CrossRef CAS PubMed.
- S. C. Smith and D. F. Rodrigues, Carbon, 2015, 91, 122 CrossRef CAS.
- J. Li, G. Wang, H. Zhu, M. Zhang, X. Zheng, Z. Di, X. Liu and X. Wang, Sci. Rep., 2014, 4, 4359 CrossRef PubMed.
- L. Shi, J. Chen, L. Teng, L. Wang, G. Zhu, S. Liu, Z. Luo, X. Shi, Y. Wang and L. Ren, Small, 2016, 12, 4165 CrossRef CAS PubMed.
- Z. Marković, J. Prekodravac, D. Tošić, I. Holclajtner-Antunović, M. Milosavljević, M. Dramićanin and B. Todorović-Marković, J. Serb. Chem. Soc., 2015, 80, 63 CrossRef.
- O. P. Sharma, Biochem. Pharmacol., 1976, 25, 1811 CrossRef CAS PubMed.
- T. Masuda, Y. Toi, H. Bando, T. Maekawa, Y. Takeda and H. Yamaguchi, J. Agric. Food Chem., 2002, 50, 2524 CrossRef CAS PubMed.
- K. Mehta, P. Pantazis, T. McQueen and B. Agarval, Anti-Cancer Drugs, 1997, 8, 471 CrossRef.
- A. N. Nurfina, M. S. Reksohadiprodjo, H. Timmerman, U. Jenie, D. Sigiyanto and H. J. van der Goot, Eur. J. Med. Chem., 1997, 32, 321 CrossRef CAS.
- N. Sreejayan, M. N. A. Rao, K. I. Priyadarsini and A. T. P. Devasagayam, Int. J. Pharm., 1997, 151, 127 CrossRef CAS.
- P. Venkatesan and M. N. Rao, J. Pharm. Pharmacol., 2000, 52, 1123 CrossRef CAS PubMed.
- V. Paunović, B. Ristić, Z. Marković, B. Todorović Marković, M. Kosić, J. Prekodravac, T. Kravić Stevović, M. Micušik, Z. Spitalsky, V. Trajković and L. Harhaji Trajković, Biomed. Microdevices, 2016, 18, 37 CrossRef PubMed.
- P. Tyagi, M. Singh, H. Kumari, A. Kumari and K. Mukhopadhyay, PLoS One, 2015, 10, e0121313 Search PubMed.
- J. Song, B. Choi, E. J. Jin, Y. Yoon and H. K. Choi, Eur. J. Clin. Microbiol. Infect. Dis., 2012, 31, 1347 CrossRef CAS PubMed.
- W. J. Betts and D. W. Wareham, BMC Microbiol., 2014, 14, 172 CrossRef PubMed.
- K. M. Moghaddam, M. Iranshahi, M. C. Yazdi and A. R. Shahverdi, Int. J. Green Pharm., 2009, 3, 141 CrossRef.
- S. H. Mun, D. K. Joung, Y. S. Kim, O. H. Kang, S. B. Kim, Y. S. Seo, Y. C. Kim, D. S. Lee, D. W. Shin, K. T. Kweon and D. Y. Kwon, Phytomedicine, 2013, 20, 714 CrossRef CAS PubMed.
- A. R. Maity, A. Chakraborty, A. Mondal and N. R. Jana, Nanoscale, 2014, 6, 2752 RSC.
- K. Muthoosamy, I. Babangida Abubakar, R. Geetha Bai, H. S. Loh and S. Manickam, Sci. Rep., 2016, 6, 32808 CrossRef CAS PubMed.
- S. Hatamie, O. Akhavan, S. K. Sadrnezhaada, M. M. Ahadian, M. M. Shirolkar and H. Q. Wang, Mater. Sci. Eng., C, 2015, 55, 482 CrossRef CAS PubMed.
- T. Mitra, P. J. Manna, S. T. K. Raja, A. Gnanamani and P. P. Kundu, RSC Adv., 2015, 5, 98653 RSC.
- Y. J. Choi, E. Kim, J. W. Han, J. H. Kim and S. Gurunathan, Molecules, 2016, 21, 375 CrossRef PubMed.
- Y. Lin, Y. Liao, Z. Chen and J. W. Connell, Mater. Res. Lett., 2017, 5, 209–234 CrossRef.
- J. Bai, X. Zhong, S. Jiang, Y. Huang and X. Duan, Nat. Nanotechnol., 2010, 5, 190 CrossRef CAS PubMed.
- T. H. Han, Y. K. Huang, A. T. L. Tan, V. P. Dravid and J. Huang, J. Am. Chem. Soc., 2011, 133, 15264 CrossRef CAS PubMed.
- Z. M. Marković, D. M. Matijašević, V. B. Pavlović, S. P. Jovanović, I. D. Holclajtner-Antunović, Z. Špitalsky, M. Mičušik, M. D. Dramićanin, D. D. Milivojević, M. P. Nikšić and B. M. Todorović Marković, J. Colloid Interface Sci., 2017, 500, 30 CrossRef PubMed.
- Z. M. Marković, M. D. Budimir, D. P. Kepić, I. D. Holclajtner-Antunović, M. D. Dramićanin, V. D. Spasojević, D. B. Peruško, Z. Špitalský, M. Mičušik, V. B. Pavlović and B. M. Todorović-Marković, RSC Adv., 2016, 6, 39275 RSC.
- www.gwyddion.net, version 2.42.
- F. Widdel, Theory and measurement of bacterial growth, Grundpraktikum Mikrobiologie, Universität Bremen, 2007, vol. 4, p. 11 Search PubMed.
- A. Klančnik, S. Piskernik, B. Jeršek and S. S. Možina, J. Microbiol. Methods, 2010, 81, 121 CrossRef PubMed.
- A. K. Tyagi, D. Bukvički, D. Gottardi, M. Veljić, M. E. Guerzoni, A. Malik and P. D. Marin, J. Evidence-Based Complementary Altern. Med., 2013, 2013, 382927 Search PubMed.
- C. F. Carson, B. J. Mee and T. V. Riley, Antimicrob. Agents Chemother., 2002, 46, 1914 CrossRef CAS PubMed.
- H. C. Schniepp, J. L. Li, M. J. McAllister, H. Sai, M. Herrera-Alonso, D. H. Adamson, R. K. Prud'homme, R. Car, D. A. Saville and I. A. Aksay, J. Phys. Chem. B, 2006, 110, 8535 CrossRef CAS PubMed.
- M. J. McAllister, J. L. Li, D. H. Adamson, H. C. Schniepp, A. A. Abdala, J. Liu, M. Herrera-Alonso, D. L. Milius, R. Car, R. K. Prud'homme and I. A. Aksay, Chem. Mater., 2007, 19, 4396 CrossRef CAS.
- O. Akhavan, Carbon, 2010, 48, 509 CrossRef CAS.
- D. Li, M. B. Muller, S. Gilje, R. B. Kaner and G. Wallace, Nat. Nanotechnol., 2008, 3, 101 CrossRef CAS PubMed.
- L. M. Malard, M. A. Pimenta, G. Dresselhaus and M. S. Dresselhaus, Phys. Rep., 2009, 473, 51 CrossRef CAS.
- A. C. Ferrari, Solid State Commun., 2007, 14, 47 CrossRef.
- V. Georgakilas, M. Otyepka, A. B. Bourlinos, V. Chandra, N. Kim, K. C. Kemp, P. Hobza, R. Zboril and K. S. Kim, Chem. Rev., 2012, 112, 6156 CrossRef CAS PubMed.
- C. F. Chignell, P. B. Krzysztof, J. Reszka, A. G. Motten, R. H. Sik and T. A. Dahl, Photochem. Photobiol., 1994, 59, 295 CrossRef CAS PubMed.
- H. H. Tønnesen, H. de Vries, J. Karlsen and B. V. Henegouwen, J. Pharm. Sci., 1987, 76, 371 CrossRef.
- K. I. Priyadarsini, J. Photochem. Photobiol., C, 2009, 10, 81 CrossRef CAS.
- S. H. Mun, S. B. Kim, R. Kong, J. G. Choi, Y. C. Kim, D. W. Shin, O. H. Kang and D. Y. Kwon, Molecules, 2014, 19, 18283 CrossRef PubMed.
- Disinfection, Sterilization and Preservation, ed. S. S. Block, Lippincott Williams & Wilkins, Philadelphia, 2001 Search PubMed.
| This journal is © The Royal Society of Chemistry 2017 |