 Open Access Article
Cellulose enzymatic saccharification and preparation of 5-hydroxymethylfurfural based on bamboo hydrolysis residue separation in ionic liquids†
Bekbolat Kassanov,
Ju Wang,
Yan Fu and
Jie Chang *
*
School of Chemistry and Chemical Engineering, South China University of Technology, Guangzhou 510640, PR China. E-mail: changjie@scut.edu.cn
First published on 14th June 2017
Abstract
Ionic liquid/ethanol was used in bamboo hydrolysis residue (BHR) to separate lignin and cellulose. The optimal dissolution conditions were as follows: 160 °C, 150 min, 1![[thin space (1/6-em)]](https://www.rsc.org/images/entities/char_2009.gif) :
:![[thin space (1/6-em)]](https://www.rsc.org/images/entities/char_2009.gif) 1 of volume ratio of [AMIM]Cl to ethanol, 1
1 of volume ratio of [AMIM]Cl to ethanol, 1![[thin space (1/6-em)]](https://www.rsc.org/images/entities/char_2009.gif) :
:![[thin space (1/6-em)]](https://www.rsc.org/images/entities/char_2009.gif) 10 of mass ratio of solid to liquid, when the dissolution rate was 41.7%, the purity of crude lignin was 86.7%, while that of cellulose product was 92.0%. Additionally the recycling effect of [AMIM]Cl/ethanol was ideal. The crystal structure of cellulose had not been destroyed; its crystallinity increased. Cellulose enzymatic saccharification was investigated, and the optimum process conditions were as follows: 50 °C, 48 h, 2 g L−1 of cellulase concentration, pH = 4.5, when the saccharification yield reached 83.7%. The cellulose crystal structure was destroyed and its degree of crystallinity was decreased after saccharification. Then the monosaccharide was used to convert to 5-hydroxymethylfurfural (5-HMF) under Brønsted acids or Lewis acids catalysis in [AMIM]OAc. It was found that the catalytic effect of Lewis acids was much better than that of Brønsted acids investigated, especially CrCl3. Choosing CrCl3 as catalyst, the optimum process conditions were as follows: 1
10 of mass ratio of solid to liquid, when the dissolution rate was 41.7%, the purity of crude lignin was 86.7%, while that of cellulose product was 92.0%. Additionally the recycling effect of [AMIM]Cl/ethanol was ideal. The crystal structure of cellulose had not been destroyed; its crystallinity increased. Cellulose enzymatic saccharification was investigated, and the optimum process conditions were as follows: 50 °C, 48 h, 2 g L−1 of cellulase concentration, pH = 4.5, when the saccharification yield reached 83.7%. The cellulose crystal structure was destroyed and its degree of crystallinity was decreased after saccharification. Then the monosaccharide was used to convert to 5-hydroxymethylfurfural (5-HMF) under Brønsted acids or Lewis acids catalysis in [AMIM]OAc. It was found that the catalytic effect of Lewis acids was much better than that of Brønsted acids investigated, especially CrCl3. Choosing CrCl3 as catalyst, the optimum process conditions were as follows: 1![[thin space (1/6-em)]](https://www.rsc.org/images/entities/char_2009.gif) :
:![[thin space (1/6-em)]](https://www.rsc.org/images/entities/char_2009.gif) 10 of mass ratio of solid to liquid, 10 mol% (based on monosaccharide) CrCl3, 160 °C, 3 h, when the 5-HMF yield reached 56.8%.
10 of mass ratio of solid to liquid, 10 mol% (based on monosaccharide) CrCl3, 160 °C, 3 h, when the 5-HMF yield reached 56.8%.
Introduction
With the shortage of fossil energy and serious environment problems, people have been continuously trying to exploit new environmental energy resources.1 Biomass is considered as the ideal substitute for fossil energy because of its low price and renewability.2 Therefore, researching and developing the utilization of biomass energy has become the focus of many countries in the world. Lignocellulosic biomass is mainly composed of cellulose, hemicellulose and lignin, and their contents are various in different plants.3 Among all types of biomass, bamboo is thought as one of the most ideal chemical industrial feedstocks owing to its fast growth and high content of cellulose.4As we know, cellulose is the most-widely-used component in biomass. It can be used in fiber material, fermentation, papermaking, and so on.5,6 So, cellulose separation from bamboo is important for its utilization. There are many pretreatment methods for biomass separation, like acid treatment, alkali treatment, organic solvents method and steam explosion, but all of them have obvious shortcomings, such as polluting the environment and high energy consumption.7–10 Therefore, developing a new method is the priority among priorities. Ionic liquids (ILs) provide a new method for biomass pretreatment. ILs are consist of organic cation and inorganic or organic ions, and it is the melting state of liquid salt in the room temperature or near, also entirely composed by ion. They have several special characters, such as low vapor pressure, recyclable, pollution-free, high boiling point and can been designed, which makes them popular in many research fields. In the study of biomass, ILs have made great achievements.11–14 Yu et al. designed [BMIM]Br/ethanol to separate pine components based on Hansen solubility parameters theory, and got high-purity lignin and cellulose.15 Li et al. using [EMIM]OAc to pretreat switchgrass at 160 °C for 3 h, and the lignin yield reached to 69.2%.16 Obviously, ILs is the preferred method for biomass separation.
In recent years, the production of 5-hydroxymethylfurfural (5-HMF) by the dehydration of biomass-based sugars gained more and more attention.17–20 It is known that fructose has been selected as an ideal feedstock in many researches and many methods have been used to achieve excellent 5-HMF yield.21–25 However, 5-HMF is not suitable for industrial, large scale production because of the rareness in natural and expensive of fructose. Fortunately, glucose, derived from vast cellulose, can also be used as a candidate for the preparation of 5-HMF.26–28 But the development of the reaction is limited by some hindrances. Firstly, cellulose is hard to be degraded to glucose by common ways. Secondly, glucose has low volatility and high reactivity due to the high content of hydroxyl group, and liquid-phase should be utilized. The primary of glucose can only be dissolved in a few solvents, water, organic solvent dimethylsulfoxide (DMSO) and dimethylformamide (DMF), for instance. But the conversion of saccharide is inefficient when water was utilized as solvent. And when it takes place in the two latter solvents, the yield of 5-HMF can be improved but the separation is more complex and both of the two solvents are of unfavorable at the environment point of view. On the other side, the formation of glucose in straight-chain form and the generation of the enediol intermediate must be catalyzed by catalyst in the reaction.29–31
Enzymatic saccharification has been regarded as a promising technology in cellulose conversion to glucose for its non-pollution and efficiency which solved the first problem.32 Cellulase, the most commonly used enzyme in enzymatic saccharification of cellulose, is a multiple-components enzyme system which usually contains endoglucanase, cellobiohydrolase and β-glucosidase, and they act synergistically in the reactions.33 Kuo et al.34 found that the yield of glucose could reach to 90% after 72 h using cellulase to hydrolyze cellulose recovered from IL. Xiros et al.35 compared the enzymatic saccharification results of cellulose pretreated by IL and unpretreated and found that saccharification yield of cellulose pretreated by IL was 15% higher than that of unpretreated.
ILs have always been used in the conversion of saccharide to 5-HMF in relatively soft conditions. And higher yield of 5-HMF can be got when ionic liquids are combined with some catalysts such as Lewis acids and Brønsted acids. Up to now, Lewis acids such as SnCl4, CrCl2, CrCl3, FeCl3 and so on have been confirmed to be effective to catalyze fructose and glucose conversion into 5-HMF.36–38 Zhao et al.39 conducted the research that sugars converted into 5-HMF, found that very small amount of certain metal halides significantly reduced the fructose dehydration barrier in ionic liquids producing 5-HMF at high yields. Moreover, glucose was selectively converted to 5-HMF in good yield in ionic liquids with CrCl3 as catalyst. Hu et al.53 found that CrCl3, AlCl3 and SnCl4 were active in the conversion of glucose to 5-HMF and SnCl4 was the most efficient in the [EMIM]BF4 with a yield of 5-HMF more than 90%. Qi et al.40 developed an efficient method for converting glucose into 5-HMF by using the [BMIM]Cl as solvent, in the presence of CrCl3 catalyst and a 5-HMF yield of 72% was obtained with microwave heating at 140 °C in 1 h. Hu et al.41 conducted the one pot reaction for the conversion of inulin, consists of fructose, into 5-HMF, ionic liquids chloride as solvent, Brønsted acid, oxalic acid and citric acid as catalyst, found that the two reaction systems were very efficient at relatively lower temperature and could be reused after simple separation. And no one has studied what would happen if Brønsted acids utilized as catalyst in the conversion of glucose into 5-HMF.
In the present work, bamboo hydrolysis residue (mainly compose of cellulose and lignin), residue after hemicellulose extraction by hot liquid water treatment in our previous work,42 was used as material. We chose an IL to separate cellulose, and carried out the reaction for the conversion of monosaccharide derived from cellulose by enzymatic saccharification into 5-HMF using IL, Lewis acids or Brønsted acids as catalysts respectively, and their catalytic performance in the conversion of glucose to 5-HMF was studied, and the optimum process conditions was confirmed.
Experimental
1. Materials
Bamboo hydrolysis residue (mainly compose of cellulose and lignin), prepared at 170 °C, 60 min, solid to liquid ratio 1![[thin space (1/6-em)]](https://www.rsc.org/images/entities/char_2009.gif) :
:![[thin space (1/6-em)]](https://www.rsc.org/images/entities/char_2009.gif) 12 g mL−1 using hydrothermal method on bamboo powder, its chemical components was shown in Table S1 in ESI.† [AMIM]Cl, [AMIM]OAc, SnCl4, CrCl3, AlCl3, FeCl3, ethanol, oxalic acid, citric acid, malonic acid, benzoic acid, ethyl acetate, deuterated chloroform (CDCl3), microcrystalline cellulose, cellulase (produced from Aspergillus niger, 70 U mg−1 of FPA) and tannin were all purchased from Sigma-Aldrich.
12 g mL−1 using hydrothermal method on bamboo powder, its chemical components was shown in Table S1 in ESI.† [AMIM]Cl, [AMIM]OAc, SnCl4, CrCl3, AlCl3, FeCl3, ethanol, oxalic acid, citric acid, malonic acid, benzoic acid, ethyl acetate, deuterated chloroform (CDCl3), microcrystalline cellulose, cellulase (produced from Aspergillus niger, 70 U mg−1 of FPA) and tannin were all purchased from Sigma-Aldrich.
2. Separation of bamboo hydrolysis residue
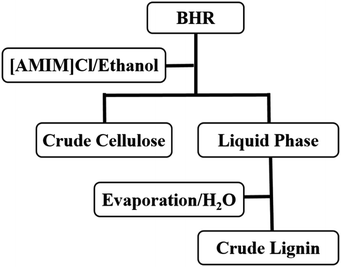
A certain amount of bamboo hydrolysis residue (BHR) were added in [AMIM]Cl/ethanol, and then put into a sealed autoclave, 150 rpm, in given temperature and desired time. When the reaction is end, filtration and separation were operated. Dry the solid product, named crude cellulose. Then add water into liquid phase, stir for 1 h, until flocculate appeared, then filtrate and separate the mixture. Dry the solid product, named crude lignin. The process for separation of residue was shown in Fig. 1. [AMIM]Cl was recycled by reduced pressure distillation.3. Method of calculation
BHR's dissolution rate is calculated as follow:
 | (1) |
The yield of cellulose and lignin is calculated by eqn (2) and (3), respectively.
| X = M1/MC × 100% | (2) |
| Y = M2/ML × 100% | (3) |
Cellulose content is determined by ethanol nitrate method; lignin content is determined by Klason method.43,44
4. Characterization analysis of products
XRD analysis of BHR and crude cellulose is obtained on Bruker D8 ADVANCE X-ray diffractometer, experiment condition: Ni filters, Cu target, pipe pressure is 40 kV, incident ray wavelength was 0.15418 nm, scanning scope is 10–40°. And the results were shown in ESI.†FT-IR analysis of crude cellulose and lignin is obtained on Nicolet Nexus 670, Fourier transform infrared spectrometer, wavelength range 4000–400 cm−1.
5. Enzymatic saccharification of cellulose and analysis of reducing sugar
2 g cellulose was added into a conical flask of 150 mL. Then add 0.05 mol L−1 citric acid–sodium citrate buffer solution and cellulase to the conical flask. Seal conical flask and put it into thermostatic oscillator (150 rpm) for enzymatic saccharification reaction. Saccharification rate was calculated as follow:
 | (4) |
The content of each monosaccharide was measured by an Agilent ion chromatograph (Dionex ICS-3000, column: CaboPacTMPA20, pulse ampere detector). A total of 1 g of saccharification products was added to a 500 mL of volumetric flask. Standard solutions were prepared using glucose, xylose, arabinose, galactose and fructose, whose concentrations were 2, 4, 6, 8 and 10 mg L−1.
Reducing sugar content was determined by DNS method.45 Reducing sugar standard curve is shown in eqn (5).
| A = 0.554c + 0.0408, R2 = 0.9988 | (5) |
Then XRD analysis of cellulose after enzymolysis was obtained on Bruker D8 ADVANCE X-ray diffractometer.
6. 5-HMF preparation
1.8 g (0.01 mol) reducing sugar, 0.1 mol [AMIM]OAc and a certain amount of catalyst were added into an agitated reactor (20 mL, 500 rpm) in given temperature and desired time for preparation of 5-HMF. At the end of the reaction, the reaction mixture was cooled down to room temperature immediately.After cooling to room temperature, 5-HMF was extracted from reaction mixture for ten times continuously using ethyl acetate. The absorbance (A) of extraction liquid was measured at 284 nm against a blank (the same reagents free from 5-HMF). The relationship between the concentration [x (μg mL−1)] of 5-HMF (R2 = 0.9967) was as follows:
| A = 0.1132x + 0.0154, R2 = 0.9967 | (6) |
The yield of 5-HMF was calculated from equation as follows:
 | (7) |
7. Identification of 5-HMF
5-HMF was separated from ethyl acetate via reduced pressure distillation. 5-HMF was identified by 1H NMR spectra and FT-IR spectra which is recorded as solutions in CDCl3 at room temperature, tetramethylsilane (TMS) as internal marker. 1H NMR spectra at room temperature was collected on a Bruker spectrometer at 400 MHz. FTIR spectra of prepared 5-HMF at room temperature was recorded on a NEXUS 670 FT-IR Spectrometer in a range of 4000–400 cm−1.Results and discussion
1. Optimum conditions of separation process
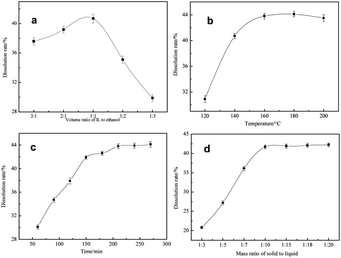
Effect of volume ratio of [AMIM]Cl to ethanol on dissolution rate of BHR was shown in Fig. 2(a). As shown in Fig. 2(a), when the volume ratio was from 3![[thin space (1/6-em)]](https://www.rsc.org/images/entities/char_2009.gif) :
:![[thin space (1/6-em)]](https://www.rsc.org/images/entities/char_2009.gif) 1 to 1
1 to 1![[thin space (1/6-em)]](https://www.rsc.org/images/entities/char_2009.gif) :
:![[thin space (1/6-em)]](https://www.rsc.org/images/entities/char_2009.gif) 1, the dissolution rate was increased, from 37.6% to 40.7%. It could be that the viscosity of solvent system was decreased with the increase of ethanol content, which benefitted the mass transfer. But a significant downtrend was shown from 1
1, the dissolution rate was increased, from 37.6% to 40.7%. It could be that the viscosity of solvent system was decreased with the increase of ethanol content, which benefitted the mass transfer. But a significant downtrend was shown from 1![[thin space (1/6-em)]](https://www.rsc.org/images/entities/char_2009.gif) :
:![[thin space (1/6-em)]](https://www.rsc.org/images/entities/char_2009.gif) 1 to 1
1 to 1![[thin space (1/6-em)]](https://www.rsc.org/images/entities/char_2009.gif) :
:![[thin space (1/6-em)]](https://www.rsc.org/images/entities/char_2009.gif) 3, and when the volume ratio of [AMIM]Cl to ethanol was 1
3, and when the volume ratio of [AMIM]Cl to ethanol was 1![[thin space (1/6-em)]](https://www.rsc.org/images/entities/char_2009.gif) :
:![[thin space (1/6-em)]](https://www.rsc.org/images/entities/char_2009.gif) 3, dissolution rate was only 29.9%, which suggested that the [AMIM]Cl's content was more important for its excellent ability to destroy chemical structures in BHR's dissolution. And it could be seen that 1
3, dissolution rate was only 29.9%, which suggested that the [AMIM]Cl's content was more important for its excellent ability to destroy chemical structures in BHR's dissolution. And it could be seen that 1![[thin space (1/6-em)]](https://www.rsc.org/images/entities/char_2009.gif) :
:![[thin space (1/6-em)]](https://www.rsc.org/images/entities/char_2009.gif) 1 was the best volume ratio.
1 was the best volume ratio.
Effect of reaction temperature on dissolution rate of BHR was shown in Fig. 2(b). As shown in Fig. 2(b), dissolution rate was increased as temperature rose between 120 and 180 °C. This was because the dissolution of lignin was an endothermic process. When the temperature rose to 160 °C, dissolution rate reached to 43.8%, and when 180 °C, it only had been raised by 0.03%. Rising the temperature continuously, dissolution rate had a little decrease because of generation of insoluble product like humins. Besides, [AMIM]Cl would become unstable at too high temperature.46 Therefore, 160 °C is the optimum temperature.
Effect of reaction time on dissolution rate of BHR was shown in Fig. 2(c). As shown in Fig. 2(c), dissolution rate was increased as time went on, and from 60 min to 150 min, dissolution rate increased significantly, and reached to 41.9% in 150 min. However, the dissolution rate had little increase from 150 min to 270 min, and when reaction time was 270 min, dissolution rate only reached to 44.1%, indicating lignin didn't dissolve in this period. So, 150 min was the optimal time.
Effect of mass ratio of solid to liquid on dissolution rate of BHR was shown in Fig. 2(d). As is shown in Fig. 2(d), as the mass ratio of solvent was increased, dissolution rate was also increased in all investigated mass ratios. And when it was in the range of 1![[thin space (1/6-em)]](https://www.rsc.org/images/entities/char_2009.gif) :
:![[thin space (1/6-em)]](https://www.rsc.org/images/entities/char_2009.gif) 3–1
3–1![[thin space (1/6-em)]](https://www.rsc.org/images/entities/char_2009.gif) :
:![[thin space (1/6-em)]](https://www.rsc.org/images/entities/char_2009.gif) 1, dissolution rate was evidently increased, up to 41.7%. However, there was no clearly increase with the solvent added continuously, and dissolution rate only reached to 42.2% when 1
1, dissolution rate was evidently increased, up to 41.7%. However, there was no clearly increase with the solvent added continuously, and dissolution rate only reached to 42.2% when 1![[thin space (1/6-em)]](https://www.rsc.org/images/entities/char_2009.gif) :
:![[thin space (1/6-em)]](https://www.rsc.org/images/entities/char_2009.gif) 20. So, the best mass ratio was 1
20. So, the best mass ratio was 1![[thin space (1/6-em)]](https://www.rsc.org/images/entities/char_2009.gif) :
:![[thin space (1/6-em)]](https://www.rsc.org/images/entities/char_2009.gif) 10 from the point of view of saving.
10 from the point of view of saving.
Thus, the optimum separation condition of lignin and cellulose was determined as follows: 1![[thin space (1/6-em)]](https://www.rsc.org/images/entities/char_2009.gif) :
:![[thin space (1/6-em)]](https://www.rsc.org/images/entities/char_2009.gif) 1 of volume ratio of [AMIM]Cl to ethanol, 160 °C, 150 min, 1
1 of volume ratio of [AMIM]Cl to ethanol, 160 °C, 150 min, 1![[thin space (1/6-em)]](https://www.rsc.org/images/entities/char_2009.gif) :
:![[thin space (1/6-em)]](https://www.rsc.org/images/entities/char_2009.gif) 10 of mass ratio of solid to liquid, when the dissolution rate of BHR could reach to 41.7%.
10 of mass ratio of solid to liquid, when the dissolution rate of BHR could reach to 41.7%.
2. Cyclic utilization of [AMIM]Cl
Ionic liquid's recyclability is one of great advantages in biomass pretreatment. The repeat use times was shown in Fig. S3.† We could see that the dissolution rate was decreased as recycling times. Firstly, this was due to the loss of IL in experiment. Secondly, a bit of non-distilled water could inhibit lignin hydrolysis because common lignin was poorly soluble in water.47 And at last, it might be that residual lignin in IL could also inhibit lignin hydrolysis. But the dissolution rate still could reach to about 35% after reuse 4 times, indicating that the cyclic utilization of [AMIM]Cl is ideal.3. Products characterization analysis
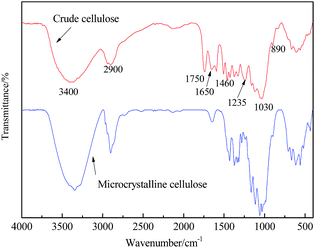
FT-IR spectrograms of crude cellulose and microcrystalline cellulose were shown in Fig. 3, respectively. Generally speaking, bands in FT-IR spectrograms appears at 3400, 2900, 1730, 1200–1300 and 890 cm−1, the bands at 3400 cm−1 belonged to stretching vibration of –OH, and the bands at 2900 cm−1 belonged to stretching vibration of methyl and methylene, the bands at 1750 cm−1 belonged to C![[double bond, length as m-dash]](https://www.rsc.org/images/entities/char_e001.gif) O in alduronic acid.48 But because of presence of impurities, absorption bands appearing in crude cellulose were a little more than that of microcrystalline cellulose. Even so, we also could see that strong absorption bands in crude cellulose were consistent with cellulose's characteristic absorption bands.
O in alduronic acid.48 But because of presence of impurities, absorption bands appearing in crude cellulose were a little more than that of microcrystalline cellulose. Even so, we also could see that strong absorption bands in crude cellulose were consistent with cellulose's characteristic absorption bands.
4. Optimum conditions of enzymatic saccharification determination
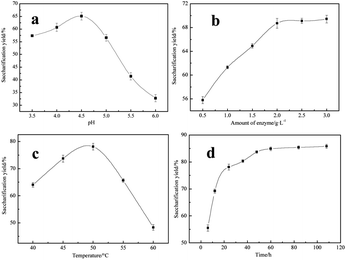
Crude cellulose was taken as raw material to produce reducing sugar via enzymatic saccharification. Initial pH value, amount of cellulase, reaction temperature and time were investigated in following researches.Effect of initial pH value on the saccharification yield was shown in Fig. 4(a). It is known that as a kind of protein, enzyme activity was efficient in certain range of pH. As shown in Fig. 4(a), when the pH was in the range of 3.5–4.5, saccharification yield rose, and reached to 65.1% when 4.5, but when pH was beyond 4.5, saccharification yield declined rapidly, and only was 32.8% when 6, which indicated that cellulase had begun to become inactive in this period. Based on the above analysis, 4.5 was the ideal initial pH value.
Effect of amount of enzyme on the saccharification yield was shown in Fig. 4(b). As shown in Fig. 4(b), saccharification yield was increased significantly with the increase of enzyme amount in the range of 0.5–2 g L−1, while enzyme amount was beyond 2 g L−1, there was no obvious increase of saccharification yield. That was because enzymatic hydrolysis of cellulose was a solid–liquid heterogeneous reaction, enzyme molecule would adsorb to cellulose's surface, then enzyme and substrate form unstable compounds, which could react further to become reducing sugar, adsorption quantity could reach to maximum when enzyme concentration was up to a certain value and saccharification yield was good, but adsorption quantity could not be increased when enzyme concentration was beyond the certain value.
Effect of reaction temperature on the saccharification yield was shown in Fig. 4(c). As shown in Fig. 4(c), cellulase's enzymatic activity is temperature-sensitive, saccharification yield was increased with the temperature from 40 to 50 °C, and reached to 78.1% at 50 °C because of enzyme activity enhancement in this period. But saccharification yield declined rapidly when temperature beyond 50 °C. That was because cellulase would become unstable, even inactive under higher temperature. Thus, 50 °C was the best temperature.
Effect of reaction time on the saccharification yield was shown in Fig. 4(d). As shown in Fig. 4(d), saccharification yield was increased rapidly in initial reaction stage, and reached to 83.7% for 48 h, because substrate fully contacted with cellulase in this period, which led to the quick saccharification. However, saccharification yield only had a little increase with the increase of time, and only increased by 2.1% for 108 h. It might be that reducing sugar produced gradually could inhibit the further enzymatic hydrolysis of cellulose. Moreover, enzyme activity declined as time went on. So, optimum reaction time was 48 h.
Based on the above analysis, optimum conditions of enzymatic saccharification using cellulase were as follows: reaction temperature 50 °C, initial pH 4.5, 2 g L−1 of dosage of cellulase, 48 h, when the saccharification yield could reach to 83.7%.
5. Analysis of reducing sugar
Determination results of monosaccharides in the reducing sugar mixture was illustrated in Table 1. It could be seen that most of products were glucose, whose content was reached up to 89.7%. And there was a little xylose, galactose and arabinose because of hemicellulose hydrolysis in crude cellulose. However, 3.8% of fructose was generated in saccharification because of isomerization of slight glucose probably, which was in favour of 5-HMF production.| Monosaccharide | Content (%) |
|---|---|
| Glucose | 89.7 |
| Fructose | 3.8 |
| Xylose | 4.4 |
| Galactose | 0.5 |
| Arabinose | 1.6 |
6. Influencing factors on the 5-HMF yield
Both Lewis acids and Brønsted acids were proved to have the ability to catalyze reducing sugars such as glucose and fructose to converse to 5-HMF. The first thing we did was to choose an ideal catalyst which made the highest 5-HMF yield in IL. [AMIM]Cl had been proved to be not stable enough at highly temperature in a long time though it is cheaper than [AMIM]OAc.46 So we tried to investigate the effect of [AMIM]OAc in this experiment. And effect of different catalysts on the 5-HMF yield was shown in Fig. 5. We could see that catalytic effect of Brønsted acids including benzoic acid (BA), citric acid (CA), oxalic acid (OA), malonic acid (MA), were all much worse than chosen metal chlorides, which might be that metal ion complexing actions of Lewis acids with IL could promote isomerization of glucose to fructose which was in favour of 5-HMF yield.49 Among which the best catalyst was SnCl4, and 5-HMF yield could reach to 46.8% in SnCl4/[AMIM]OAc. Conversion yield (45.9%) was also good in CrCl3/[AMIM]OAc, nearly to SnCl4, while the worst was AlCl3, only 26.5%. It could due to that [SnCl4+n]n− of [AMIM]n[SnCl4+n] complex formed and [CrCl3+n]n− of [AMIM]n[CrCl3+n] played an more important role in proton transfer which could better promote isomerization of glucose.50 Although performance of Brønsted acids was bad in this condition, but we couldn't fully demonstrate that Brønsted acids were poor because of restriction of experimental conditions, so OA's catalytic ability was investigated in following experiments.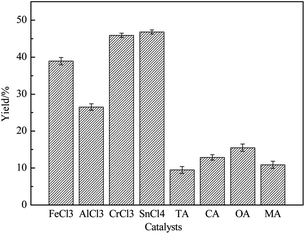 | ||
Fig. 5 Effect of different catalysts on 5-HMF yield (170 °C, 2 h, 10% of catalyst dosage based on mole number of reducing sugar, 1![[thin space (1/6-em)]](https://www.rsc.org/images/entities/char_2009.gif) : :![[thin space (1/6-em)]](https://www.rsc.org/images/entities/char_2009.gif) 15 of mass ratio of solid to liquid). 15 of mass ratio of solid to liquid). | ||
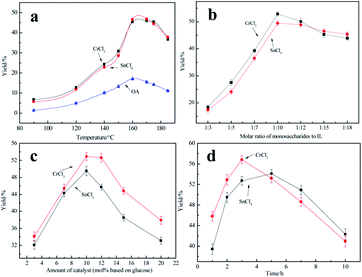
Effect of temperature on the 5-HMF yield was shown in Fig. 6(a). As was shown in Fig. 6(a), 5-HMF yield was increased from 90 °C to 170 °C, and when 160 °C, 5-HMF yields of SnCl4/[AMIM]OAc and CrCl3/[AMIM]OAc were 46.5% and 45.3%, respectively. But when it rose to 170 °C, 5-HMF yield hardly had increase, and when 185 °C, 5-HMF yield only was 37.8% which had a little reduction. This was due to many reasons. Firstly, the catalysts' activity was increased with the increase of temperature. Secondly, the viscosity of [AMIM]OAc declined significantly, which was beneficial to mass transfer. But if the temperature was too high, the deactivation of catalyst would have occurred. As for OA, 5-HMF yield was also increased with temperature, but when it was beyond 160 °C, 5-HMF yield was decreased because of probably OA's decomposition. So, based on above analysis, the catalytic ability of SnCl4 and CrCl3 to 5-HMF conversion was best in 160 °C.
Effect of molar ratio of reducing sugar to ILs (solid to liquid) on the 5-HMF yield was shown in Fig. 6(b). As was shown in Fig. 6(b), 5-HMF yields were increased in the range of 1![[thin space (1/6-em)]](https://www.rsc.org/images/entities/char_2009.gif) :
:![[thin space (1/6-em)]](https://www.rsc.org/images/entities/char_2009.gif) 3–1
3–1![[thin space (1/6-em)]](https://www.rsc.org/images/entities/char_2009.gif) :
:![[thin space (1/6-em)]](https://www.rsc.org/images/entities/char_2009.gif) 10 in CrCl3/[AMIM]OAc and SnCl4/[AMIM]OAc. And when 1
10 in CrCl3/[AMIM]OAc and SnCl4/[AMIM]OAc. And when 1![[thin space (1/6-em)]](https://www.rsc.org/images/entities/char_2009.gif) :
:![[thin space (1/6-em)]](https://www.rsc.org/images/entities/char_2009.gif) 10, 5-HMF yields were 52.9% and 49.5% in CrCl3/[AMIM]OAc and SnCl4/[AMIM]OAc, respectively. This was because reducing sugar molecule's motion range was wide in a larger amount of solvent, which was beneficial to reaction. But in the range of 1
10, 5-HMF yields were 52.9% and 49.5% in CrCl3/[AMIM]OAc and SnCl4/[AMIM]OAc, respectively. This was because reducing sugar molecule's motion range was wide in a larger amount of solvent, which was beneficial to reaction. But in the range of 1![[thin space (1/6-em)]](https://www.rsc.org/images/entities/char_2009.gif) :
:![[thin space (1/6-em)]](https://www.rsc.org/images/entities/char_2009.gif) 10–1
10–1![[thin space (1/6-em)]](https://www.rsc.org/images/entities/char_2009.gif) :
:![[thin space (1/6-em)]](https://www.rsc.org/images/entities/char_2009.gif) 18, 5-HMF yields began to decline, which might be that the reducing sugar molecule couldn't contact with catalysts in excess liquid. So, 1
18, 5-HMF yields began to decline, which might be that the reducing sugar molecule couldn't contact with catalysts in excess liquid. So, 1![[thin space (1/6-em)]](https://www.rsc.org/images/entities/char_2009.gif) :
:![[thin space (1/6-em)]](https://www.rsc.org/images/entities/char_2009.gif) 10 of molar ratio was best.
10 of molar ratio was best.
Effect of amount of catalyst on the 5-HMF yield was shown in Fig. 6(c). We could see that 5-HMF yields climbed up and then declined in SnCl4/[AMIM]OAc and CrCl3/[AMIM]OAc. And 5-HMF yields were increased from 3% to 10% because of catalyst enough adsorption in reducing sugar. Continuously adding catalysts, 5-HMF yields were decreased on the contrary, which was due to overreaction because of excess catalysts. In contrast, the catalytic effect of CrCl3 was better than that of SnCl4 no matter what amount of catalyst was. So, the ideal amount of catalyst was 10% (based on mole number of reducing sugar), when 5-HMF yields could reach to 52.9%.
Effect of reaction time on the 5-HMF yield was shown in Fig. 6(d). It could be seen that 5-HMF yields in two catalytic systems were all first increased and then decreased. 5-HMF yield was the highest in 3 h in CrCl3/[AMIM]OAc, reached to 56.8%. However, it began to decline with time after 3 h, and only was 40.9% when 10 h. As for SnCl4/[AMIM]OAc, 5-HMF yield was the highest in 5 h, reached to 54.1%, close to CrCl3/[AMIM]OAc in 3 h, and began to decline then, but not larger than CrCl3/[AMIM]OAc. 5-HMF was an unstable chemical, which was easy to produce side reactions, so it was improper to react for a long time. Also we could see was that catalytic rate of CrCl3 was faster than that of SnCl4 in [AMIM]OAc. Thus, 3 h was a better choice for the reaction.
In summary, we could conclude that Lewis acids were better than Brønsted acids for reducing sugar conversion to 5-HMF in [AMIM]OAc, especially CrCl3, and the optimum conditions of reducing sugar conversion to 5-HMF were as follows: 160 °C, 1![[thin space (1/6-em)]](https://www.rsc.org/images/entities/char_2009.gif) :
:![[thin space (1/6-em)]](https://www.rsc.org/images/entities/char_2009.gif) 10 of molar ratio of reducing sugar to IL, 10% of catalyst dosage (based on mole number of reducing sugar), 3 h, when 5-HMF yield was 56.8%.
10 of molar ratio of reducing sugar to IL, 10% of catalyst dosage (based on mole number of reducing sugar), 3 h, when 5-HMF yield was 56.8%.
7. Total mass balance
The whole research was divided into three steps, which were cellulose separation, cellulose enzymatic saccharification and 5-HMF preparation, respectively. After pretreatment in [AMIM]Cl/ethanol in optimum condition, the dissolution rate of BHR reached to 41.7%, and the mass ratio of undissolved solid, namely crude cellulose, was 58.3%, and the purity of crude cellulose was 92.0% according to components analysis and calculation. After adding water to liquid phase, solid product, namely crude lignin, the purity of crude lignin was 86.7% according to components analysis and calculation. And 83.7% of cellulose prepared was converted to reducing sugar at the optimum conditions. Finally, 56.8% reducing sugar was converted to 5-HMF. In the case of 1 g BHR, the total mass balance was shown in Fig. S4.† It could be seen that 27.7% BHR was converted to 5-HMF.8. The FT-IR and 1H NMR analysis of 5-HMF
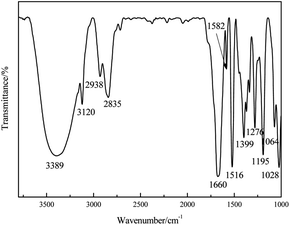
The FT-IR spectra of prepared HMF was shown in Fig. 7. The absorption peaks at 1028, 1064, 1276 and 1195 cm−1 in the spectra of prepared 5-HMF were associated with C–O–C vibration in furan ring. C![[double bond, length as m-dash]](https://www.rsc.org/images/entities/char_e001.gif) C vibration absorption peaks in furan ring were obtained at 1516 and 1582 cm−1. The strong peak at 1660 cm−1 in the spectra indicated the vibration of C
C vibration absorption peaks in furan ring were obtained at 1516 and 1582 cm−1. The strong peak at 1660 cm−1 in the spectra indicated the vibration of C![[double bond, length as m-dash]](https://www.rsc.org/images/entities/char_e001.gif) O. The absorption peaks at 2835 and 3389 cm−1 associated with the vibration of –CH2– and OH, respectively.51 All the functional groups mentioned were characteristic functional groups for 5-HMF, indicating that 5-HMF with high purity was achieved.
O. The absorption peaks at 2835 and 3389 cm−1 associated with the vibration of –CH2– and OH, respectively.51 All the functional groups mentioned were characteristic functional groups for 5-HMF, indicating that 5-HMF with high purity was achieved.
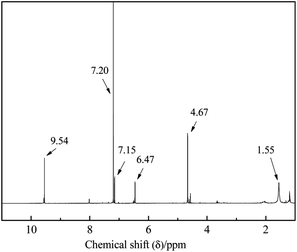
The 1H NMR spectra of prepared 5-HMF was shown in Fig. 8 and the intensity of each peak was listed in Table 2. It could be seen that 1H NMR (CDCl3, 400 MHz) δ: 9.54 (s, 1H, –CHO), 7.15 (1H, d, J = 4.0 Hz, H-3), 6.47 (d, 1H, H-4), 4.67 (2H, s, –CH2–), 1.6 (s, 1H, –OH) and their intensity were all in line with described in literature.52 So, from the above analysis, we could ensure that the product prepared was indeed 5-HMF.
| Peak (ppm) | Intensity |
|---|---|
| 9.54 | 2712 |
| 7.20 | 12![[thin space (1/6-em)]](https://www.rsc.org/images/entities/char_2009.gif) 724 724 |
| 7.15 | 1508 |
| 6.47 | 1278 |
| 4.67 | 4202 |
| 1.55 | 1172 |
Conclusions
In present work, we investigated the bamboo hydrolysis residue separation process in [AMIM]Cl/ethanol first, and when 1![[thin space (1/6-em)]](https://www.rsc.org/images/entities/char_2009.gif) :
:![[thin space (1/6-em)]](https://www.rsc.org/images/entities/char_2009.gif) 1 of volume ratio of [AMIM]Cl to ethanol, 160 °C, 150 min, 1
1 of volume ratio of [AMIM]Cl to ethanol, 160 °C, 150 min, 1![[thin space (1/6-em)]](https://www.rsc.org/images/entities/char_2009.gif) :
:![[thin space (1/6-em)]](https://www.rsc.org/images/entities/char_2009.gif) 10 of mass ratio of solid to liquid, cellulose with a purity of 92.0% and lignin with a purity of 86.7% were got. Using cellulase to catalyze cellulose saccharification, when 50 °C, initial pH 4.5, amount of cellulase 2 g L−1, 48 h, the saccharification yield could reach to 83.7%. Catalytic efficiency of different Brønsted acids and Lewis acids on the conversion of reducing sugar to 5-HMF in [AMIM]OAc. Brønsted acid was inefficient in the reaction with 5-HMF yield less than 20%. A higher yield of 5-HMF was obtained when Lewis acids were used as catalysts, indicating that Lewis acid was more efficient in the reaction, compared to Brønsted acids. Obvious differences were found among different Lewis acids and the highest yield of 5-HMF of 56.8% was achieved when CrCl3 was used as the catalyst.
10 of mass ratio of solid to liquid, cellulose with a purity of 92.0% and lignin with a purity of 86.7% were got. Using cellulase to catalyze cellulose saccharification, when 50 °C, initial pH 4.5, amount of cellulase 2 g L−1, 48 h, the saccharification yield could reach to 83.7%. Catalytic efficiency of different Brønsted acids and Lewis acids on the conversion of reducing sugar to 5-HMF in [AMIM]OAc. Brønsted acid was inefficient in the reaction with 5-HMF yield less than 20%. A higher yield of 5-HMF was obtained when Lewis acids were used as catalysts, indicating that Lewis acid was more efficient in the reaction, compared to Brønsted acids. Obvious differences were found among different Lewis acids and the highest yield of 5-HMF of 56.8% was achieved when CrCl3 was used as the catalyst.
Acknowledgements
This work was funded by the National Natural Science Foundation of China (21476090), the National Program on Key Basic Research Project of China (973 Program) (2013CB228104) and the Fundamental Research Funds for the Central Universities.Notes and references
- Y. C. Sun, J. K. Xu, F. Xu, R. C. Sun and G. L. Jones, RSC Adv., 2014, 4, 2743–2755 RSC.
- M. Wu, J. K. Liu, Z. Y. Yan, B. Wang, X. M. Zhang, F. Xu and R. C. Sun, RSC Adv., 2016, 6, 6196–6204 RSC.
- X. Liang, J. Liu, Y. Fu and J. Chang, Sep. Purif. Technol., 2016, 163, 258–266 CrossRef CAS.
- S. Kassaye, K. K. Pant and S. Jain, Renewable Energy, 2017, 104, 177–184 CrossRef CAS.
- V. Stigsson, D. I. Wilson and U. Germgärrd, Asia-Pac. J. Chem. Eng., 2008, 12, 217–231 Search PubMed.
- M. F. Li, Y. Sheng and R. C. Sun, Bioresour. Technol., 2016, 200, 971–980 CrossRef CAS PubMed.
- W. Lu, M. A. Alam, Y. Pan, J. J. Wu, Z. Wang and Z. Yuan, Bioresour. Technol., 2016, 218, 123–128 CrossRef CAS PubMed.
- A. Barakat, C. Mayer-Laigle, A. Solhy, R. A. D. Arancon, H. D. Vries and R. Luque, ChemInform, 2014, 46, 48109–48127 Search PubMed.
- I. F. Grigoras, R. E. Stroe, I. M. Sintamarean and L. A. Rosendahl, Bioresour. Technol., 2017, 231, 116–123 CrossRef CAS PubMed.
- J. Liu, J. Wang, Y. Fu and J. Chang, RSC Adv., 2016, 6, 94588–94594 RSC.
- A. Brandt, J. Gräsvik, J. P. Hallett and T. Welton, Green Chem., 2012, 15, 550–583 RSC.
- M. Mora-Pale, L. Meli, T. V. Doherty, R. J. Linhardt and J. S. Dordick, Biotechnol. Bioeng., 2011, 108, 1229–1245 CrossRef CAS PubMed.
- Q. P. Liu, X. D. Hou, N. Li and M. H. Zong, Green Chem., 2011, 14, 304–307 RSC.
- H. Wu, M. Mora-Pale, J. J. Miao, T. V. Doherty, R. J. Linhardt and S. J. Dordick, Biotechnol. Bioeng., 2011, 108, 2865–2875 CrossRef CAS PubMed.
- H. Yu, J. Hu and J. Chang, Ind. Eng. Chem. Res., 2011, 50, 7513–7519 CrossRef CAS.
- C. L. Li, B. Knierim, C. Manisseri, R. Arora, H. V. Scheller, M. Auer, K. P. Vogel, B. A. Simmons and S. Singh, Bioresour. Technol., 2010, 101, 4900–4906 CrossRef CAS PubMed.
- M. E. Zakrzewska, E. Bogel-Łukasik and R. Bogel-Łukasik, Chem. Rev., 2011, 42, 397–417 CrossRef PubMed.
- C. Moreau, A. Finiels and L. Vanoye, J. Mol. Catal. A: Chem., 2006, 253, 165–169 CrossRef CAS.
- C. Lansalot-Matras and C. Moreau, Catal. Commun., 2003, 4, 517–520 CrossRef CAS.
- Z. Xue, M. G. Ma, Z. Li and T. Mu, RSC Adv., 2016, 6, 98874–98892 RSC.
- M. Bicker, J. Hirth and H. Vogel, Green Chem., 2003, 5, 280–284 RSC.
- F. S. A. And and H. Yoshida, Ind. Eng. Chem. Res., 2006, 45, 2163–2173 CrossRef.
- X. Qi, M. Watanabe, T. M. Aida and R. L. Smith Jr, Green Chem., 2008, 10, 799–805 RSC.
- X. Qi, M. Watanabe and T. M. Aida, Catal. Commun., 2009, 10, 1771–1775 CrossRef CAS.
- Z. Xue, B. Cao, W. Zhao, J. Wang, T. Yu and T. Mu, RSC Adv., 2016, 6, 64338–64343 RSC.
- H. Yan, Y. Yang, D. Tong, X. Xiang and C. Hu, Catal. Commun., 2009, 10, 1558–1563 CrossRef CAS.
- G. Yong, Y. Zhang and J. Ying, Angew. Chem., Int. Ed., 2008, 47, 9345–9488 CrossRef CAS PubMed.
- X. Sun, Z. Liu, Z. Xue, Y. Zhang and T. Mu, Green Chem., 2015, 17, 2719–2722 RSC.
- K. I. Shimizu, R. Uozumi and A. Satsuma, Catal. Commun., 2009, 10, 1849–1853 CrossRef CAS.
- M. Watanabe, Y. Aizawa, T. Lida, H. Nishimura and H. Inomata, Appl. Catal., A, 2005, 295, 150–156 CrossRef CAS.
- K. I. Seri, Y. Inoue and H. Ishida, ChemInform, 2000, 31, 22–23 Search PubMed.
- C. Duan, Y. Long, J. Li, X. Ma and Y. Ni, Cellulose, 2015, 22, 2729–2736 CrossRef CAS.
- A. J. Griggs, J. J. Stickel and J. J. Lischeske, Biotechnol. Bioeng., 2012, 109, 676–685 CrossRef CAS PubMed.
- C. H. Kuo and C. K. Lee, Carbohydr. Polym., 2009, 77, 41–46 CrossRef CAS.
- C. Xiros, C. Vafiadi, E. Topakas and P. Christakopoulos, J. Chem. Technol. Biotechnol., 2012, 87, 629–634 CrossRef CAS.
- T. Chen and L. Lu, Chin. J. Chem., 2010, 28, 1773–1776 CrossRef CAS.
- F. C. D. Melo, R. F. D. Souza, P. L. A. Coutinho and M. O. D. Souza, J. Braz. Chem. Soc., 2014, 25, 2378–2384 Search PubMed.
- J. Guan, Q. Cao, X. Guo and X. Mu, Comput. Theor. Chem., 2011, 963, 453–462 CrossRef CAS.
- H. Zhao, J. E. Holladay, H. Brown and C. H. Zhang, Science, 2007, 316, 1597–1600 CrossRef CAS PubMed.
- X. Qi, M. Watanabe, T. M. Aida and R. L. Smith Jr, ChemSusChem, 2010, 3, 1071–1077 CrossRef CAS PubMed.
- S. Q. Hu, Z. F. Zhang, Y. X. Zhou, J. L. Song, H. L. Fan and B. X. Han, Green Chem., 2009, 11, 873–877 RSC.
- M. Sun, J. Liu, Y. Fu and J. Chang, Chin. J. Process Eng., 2016, 16, 86–92 CAS.
- H. Y. Zeng, J. Anhui Agric. Sci., 2011, 39, 11660–11774 Search PubMed.
- D. J. Nicholson, A. V. Leavitt and R. C. Francis, Cellul. Chem. Technol., 2014, 48, 53–59 CAS.
- Z. S. Ma, Y. Liu and Z. Wang, Adv. Mater. Res., 2014, 1081, 25–30 CrossRef.
- Y. Cao and T. Mu, Ind. Eng. Chem. Res., 2014, 53, 8651–8664 CrossRef CAS.
- B. Zhang, G. Q. Fu, Y. S. Niu, F. Peng, C. L. Yao and R. C. Sun, RSC Adv., 2016, 6, 15478–15484 RSC.
- C. A. Mullen and A. A. Boateng, J. Anal. Appl. Pyrolysis, 2011, 90, 197–203 CrossRef CAS.
- Y. Wang, C. M. Pedersen, T. Deng, Y. Qiao and X. Hu, Bioresour. Technol., 2013, 143, 384–390 CrossRef CAS PubMed.
- S. Lima, P. Neves, M. M. Antunes, M. Pillinger, N. Ignatyev and A. A. Valente, Appl. Catal., A, 2009, 363(1–2), 93–99 CrossRef CAS.
- C. L. Sun, S. W. Liu, L. Li, S. T. Yu and C. X. Xie, J. Qingdao Univ. Sci. Technol., Nat. Sci. Ed., 2011, 32, 311–334 Search PubMed.
- Y. Wang, C. M. Pedersen, T. Deng, Y. Qiao and X. Hu, Bioresour. Technol., 2013, 143, 384–390 CrossRef CAS PubMed.
- S. Hu, Z. Zhang, J. Song, Y. Zhou and B. Han, Green Chem., 2009, 11, 873–877 RSC.
Footnote |
| † Electronic supplementary information (ESI) available. See DOI: 10.1039/c7ra05020h |
| This journal is © The Royal Society of Chemistry 2017 |

