
 Open Access Article
 This Open Access Article is licensed under a
 Creative Commons Attribution 3.0 Unported Licence
Phonon characteristics, crystal structure, and intrinsic properties of a Y(Mg1/2Sn1/2)O3 ceramic
Chao Xinga,
Jianzhu Lia,
Huiling Chena,
Hengyang Qiaoa,
Jun Yanga,
Helei Dongb,
Haiqing Sunb,
Jing Wangb,
Xunqian Yina,
Ze-Ming Qic and
Feng Shi *a
*a
aSchool of Material Science & Engineering, Shandong University of Science and Technology, Qingdao, 266590, P. R. China. E-mail: sf751106@sina.com.cn; Fax: +86 532 80691718; Tel: +86 532 80691718
bScience and Technology on Electronic Test & Measurement Laboratory, North University of China, Taiyuan 030051, P. R. China
cNational Synchrotron Radiation Laboratory, University of Science and Technology of China, Hefei, 230029, P. R. China
First published on 14th July 2017
Abstract
Herein, a Y(Mg1/2Sn1/2)O3 (YMS) ceramic was synthesized using a conventional solid-state reaction method. Crystal structure of YMS was investigated via X-ray diffraction (XRD). Lattice vibrational modes were obtained through Raman scattering spectroscopy and Fourier transform far-infrared (FTIR) reflection spectroscopy to study its phonon characteristics. The main phase of YMS with the monoclinic P21/n symmetry has been certified via XRD. The Raman active modes fitted with the Lorentzian function can be divided into three parts: vibration related to A-site Y cations, B-site (1![[thin space (1/6-em)]](https://www.rsc.org/images/entities/char_2009.gif) :1 ordered structure of Mg2+:Sn4+), and O ions. The eight far-infrared spectrum modes corresponded to different atomic structures of the vibration modes. Dielectric properties (εr and tanδj/ω) were deduced using the four-parameter semi-quantum model (FPSQ) and Clausius–Mossotti equation, as well as the relationship between the damping coefficient and the intrinsic loss. The imaginary and real parts of the dielectric constant were obtained via the Kramers–Krönig analysis.
:1 ordered structure of Mg2+:Sn4+), and O ions. The eight far-infrared spectrum modes corresponded to different atomic structures of the vibration modes. Dielectric properties (εr and tanδj/ω) were deduced using the four-parameter semi-quantum model (FPSQ) and Clausius–Mossotti equation, as well as the relationship between the damping coefficient and the intrinsic loss. The imaginary and real parts of the dielectric constant were obtained via the Kramers–Krönig analysis.
1. Introduction
Rare-earth based microwave dielectric ceramics (MWDCs), with the formula of A(B′1/2B′′1/2)O3 (A = La, Ce, Nd, Pr, and Sm; B′ = Zn, Ni, Mg, and Co; and B′′ = Ti, Sn, and Zr), have been investigated for their potential application as dielectric resonators (DRs) and filters due to their suitable permittivities (εr), high quality factor (Q), and near zero temperature coefficient of resonant frequency (τf). Moreover, they possess monoclinic structure and P21/n space group with a 1:1 ordered structure at the B-site.1–4
The crystal structures, dielectric properties, and vibrational spectra of the A(B′1/2B′′1/2)O3 rare-earth based MWDCs, especially those of the lanthanide rare-earth ceramics, have been studied by many researchers.5–8 Some studies were mainly concentrated on the reduction of their sintering temperatures and modification of their properties via additives such as ZnO–B2O3–SiO2 (ref. 9) and Ni2+.10 However, the Y-based rare-earth ceramics with the structure A(B′1/2B′′1/2)O3 have not been reported to date. The vibrator parameters of Y(Mg1/2Sn1/2)O3 (YMS) ceramic have not been investigated by Raman scattering spectroscopy and Fourier transform far-infrared reflection spectroscopy together, and the intrinsic properties of YMS are unknown.
In this study, the YMS ceramic was synthesized through a conventional solid-state sintering technique. X-ray diffraction and vibrational spectra (via Raman and FTIR spectroscopies) were obtained. The four-parameter semi quantum (FPSQ) models were used to calculate the intrinsic properties (dielectric constant and loss), which were compared with the data calculated by the Clausius–Mossotti equation (molecular polarizabilities), as well as the relationship between the damping coefficient and the intrinsic dielectric loss. The contributions of the Raman and IR modes to the properties were analyzed. The Kramers–Krönig (K–K) analysis was performed to obtain the imaginary and real parts of the dielectric constant to examine the vibrator parameters of the YMS ceramic. This study may provide a basis for future research on the structure–property relationship of rare-earth based A(B′1/2B′′1/2)O3-type MWDCs.
2. Experimental
Y(Mg1/2Sn1/2)O3 ceramic was synthesized using the conventional solid-state reaction method. Y2O3, MgCO3, and SnO2 powders with the purity of 99.9% in a stoichiometric amount of Y:Mg:Sn = 2:1:1 molar ratio were added in a polyethylene bottle having a zirconia ball for 12 h, dried, and then calcined at 1200 °C for 4 h. After ball-milling for 12 h again, these mixed powders were dried and pressed on the discs of 15 mm × 1 mm; finally, they were sintered at 1500 °C for 4 h.
XRD was performed using a Rigaku D/max-rB X-ray diffractometer having a Cu-Kα incident source of the range of 10–80° (0.02°, 2θ step size, and 1 s per step). Raman scattering spectra were obtained at room temperature by the Nexus 670 spectrometer equipped with a liquid-N2-cooled CCD detector and an Olympus BXL microscope (100 × and 20 × objectives). Measurements were obtained in back-scattering geometry using a Nd:YVO4 laser at 514 nm line as the excitation source (10 mW). For a 5 s interval, the cumulative time is usually 10 sets, and the spectral resolution is greater than 2 cm−1. The FTIR spectra were obtained at room temperature using the Bruker IFS 66v FTIR spectrometer with a highly sensitive DTGS detector. The laser source was He–Ne.
A Hewlett–Packard 4278A capacitance meter was used to gauge the capacitance (C) and dielectric loss (tanδ, Q = 1/tanδ) at 1 MHz. The dielectric constant εr was calculated as follows: εr = (14.4Cd)/D2, where d and D are the average diameter and thickness of the sample, respectively.
The pellet surfaces were carefully polished using micron-scale Al2O3 powders prior to XRD, Raman, and FTIR spectroscopy measurements, which were rubbed off about 20 micrometers.
3. Results and discussion
The XRD pattern after Rietveld refinement of the YMS sample is presented in Fig. 1. The main crystalline phase of the sample is YMS with monoclinic symmetry (Inorganic Crystal Structure Database #161439), whose peaks have been indexed. A second phase of Y2Sn2O7 (International Center for Diffraction Data #87-1217) with a cubic structure is observed because this phase is difficult to be completely eliminated from the samples prepared via the mixed oxide route.11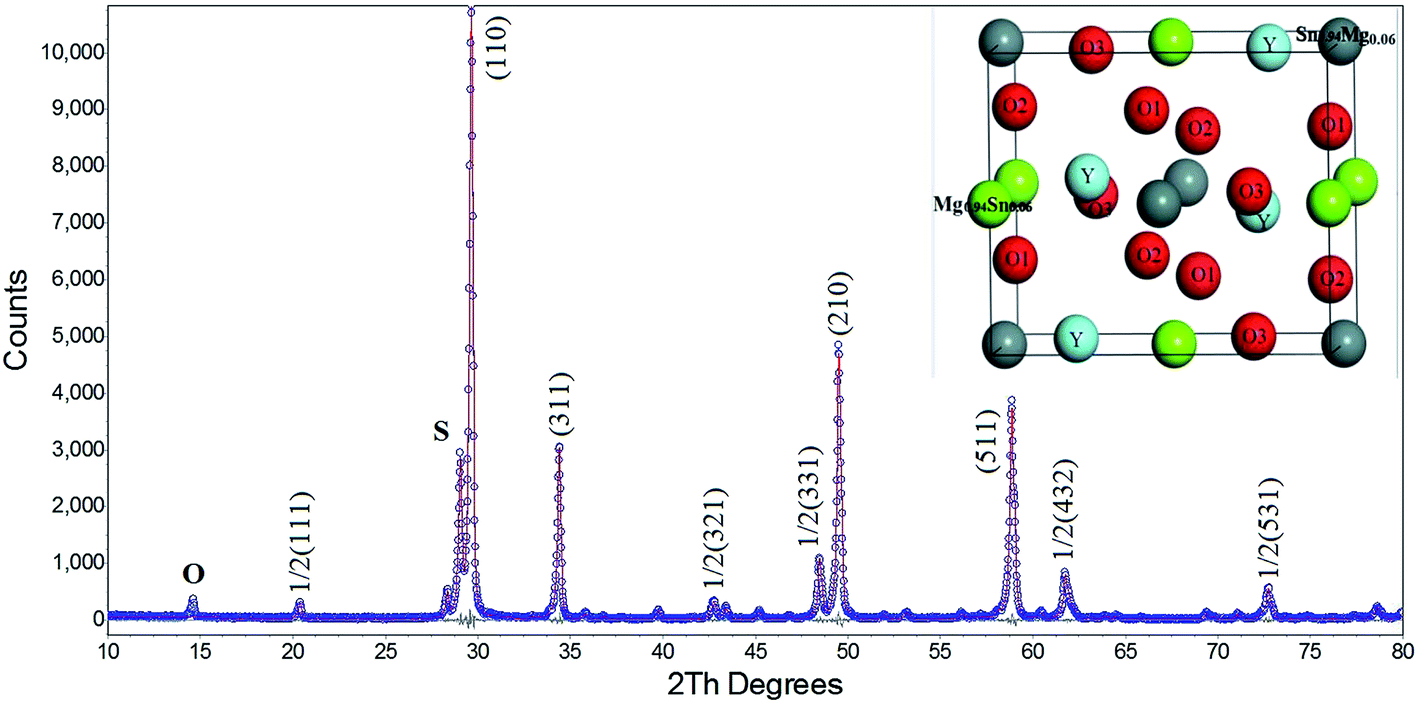 | ||
| Fig. 1 Observed XRD data (○ marks) and calculated (red line) from the Rietveld refinements of Y(Mg1/2Sn1/2)O3. The indices and the crystal structure diagram are labeled in the image. | ||
There are some extra peaks that can be observed, corresponding to the superlattice reflection peaks. According to Glazer,12 a superlattice reflection of a particular combination of odd (o) and even (e) Miller indices represents a specific deviation from the undeformed cubic structure, such as octahedral oblique (ooe, oeo, eoo) (ooo, h + k + 1 > 3), and a balance (eeo, eoe, oee) of the anti-parallel displacement. In the diffraction pattern, the appearance of the peak at about 15 degrees and the presence of the 1/2(111) face confirmed the existence of a 1:1 ordered structure (Mg2+:Sn4+) at the B-site.13
The Rietveld refinement also proves the P21/n space group of the sample. The refined model exhibits a satisfactory quality of the Rietveld discrepancy parameters: weighted profile R-factor Rp = 5.55 and profile R-factor Rwp = 10.42. The refinement results are shown in Table 1. The fractional coordinates for each atom of the ceramic are listed in Table 2, and the crystal structure diagram is presented in Fig. 1.
| Formula | Y(Mg1/2Sn1/2)O3 |
| Crystal system | Monoclinic |
| Space group | P121/n1 |
| a (Å) | 4.4012639 |
| b (Å) | 6.0802406 |
| c (Å) | 7.9335377 |
| Cell volume (Å3) | 211.76260 |
| Z | 4 |
| Software | Topas3 |
| Radiation | Cu Kα |
| Temperature (K) | 293 |
| Profile range in degree | 10° ≤ 2θ ≤ 80° |
| No. of data points | 3501 |
|
|
| R-Factor: | |
| Rp | 5.55 |
| Rwp | 10.42 |
| Rexp | 6.30 |
| R-Bragg | 2.982 |
| Element | Site | Np | X | Y | Z | Ions | Occupancy |
|---|---|---|---|---|---|---|---|
| Y | 4e | 4 | 0.48590 | 0.55350 | 0.25020 | Y3+ | 1 |
| Mg1 | 2c | 2 | 0.00000 | 0.50000 | 0.00000 | Mg2+ | 0.94 |
| Mg2 | 2d | 2 | 0.50000 | 0.00000 | 0.00000 | Mg2+ | 0.06 |
| Sn1 | 2d | 2 | 0.50000 | 0.00000 | 0.00000 | Sn4+ | 0.94 |
| Sn2 | 2c | 2 | 0.00000 | 0.50000 | 0.00000 | Sn4+ | 0.06 |
| O1 | 4e | 4 | 0.29800 | 0.29500 | 0.05000 | O2− | 1 |
| O2 | 4e | 4 | 0.19900 | 0.80800 | 0.06100 | O2− | 1 |
| O3 | 4e | 4 | 0.60600 | −0.03200 | 0.25700 | O2− | 1 |
The Raman spectrum of YMS is presented in Fig. 2. According to the group theory analysis, the monoclinic structure MWDCs with the space group of P21/n has 24 Raman active modes (12Ag + 12Bg). The B-site 1:1 ordered structure presents four intense Raman active modes (A1g, 2F2g, and Eg),14 which originate from the cubic structure with phase splitting due to the increase in the degeneracy degree. While the remaining modes are of lower intensities, which are activated by the inactive vibrational modes, or originate from the folded Brillouin zone due to increase in the cell volume.13,15 However, all the Raman active modes cannot be identified because of the mutual influence of the Raman active vibration modes and resolution of the measuring instrument; herein, 8 peaks are observed in the Raman spectrum.
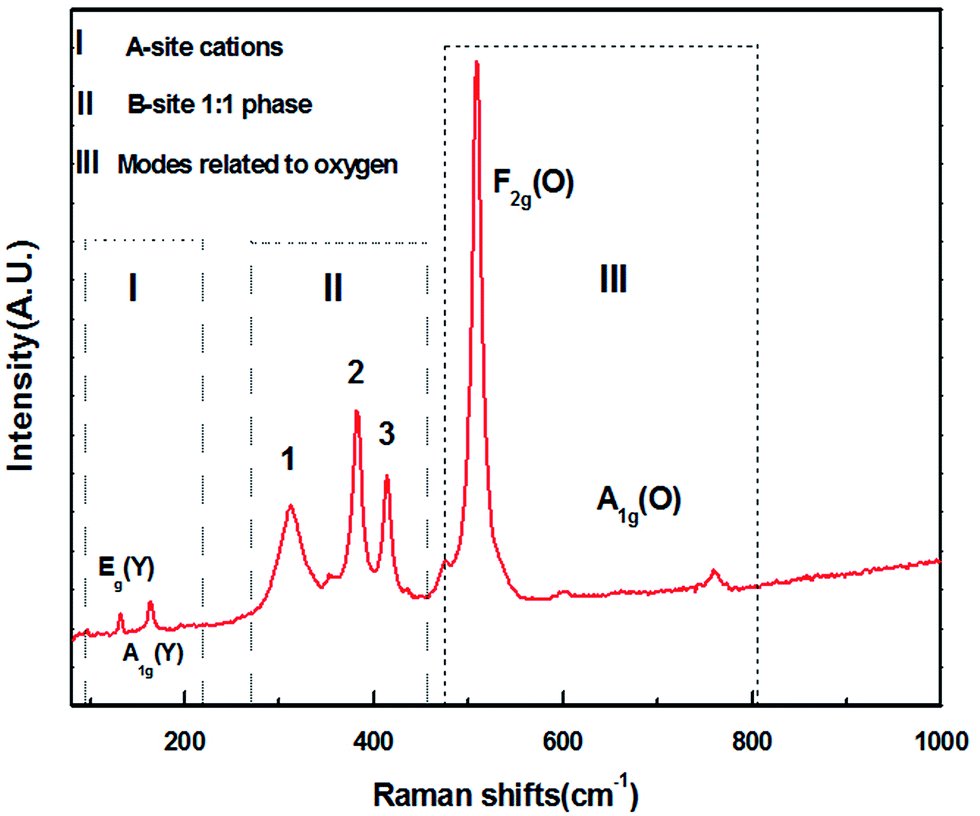 | ||
| Fig. 2 The Raman spectra of YMS ceramic in the range from 50 cm−1 to 1000 cm−1. | ||
Moreover, two modes within the range of 130–170 cm−1 are derived from the Y cations (A-site), which correspond to the F2g [Eg(Y) + A1g(Y)] vibration (part I). The modes within the range of 300–420 cm−1, i.e., modes 1, 2, and 3, correspond to the 1:1 ordered phase at the B-sites (part II). The other modes belong to the vibration of O ions, i.e., A1g(O) and F2g(O) (part III). The Raman mode at about 508 cm−1 is attributed to the F2g(O)-like mode, which is triple degenerate of the central symmetric oxygen ions. The modes at about 600 cm−1 and 780 cm−1 are attributed to the A1g-like mode, which corresponds to the symmetric breathing of oxygen octahedra owing to the displacement of oxygen atoms along the Mg–O–Sn axis. The Raman spectrum with active modes can be fitted with the Lorentzian function to obtain the full width of half maximum (FWHM) values, which are listed in Table 3.
| Modes | Eg(Y) | A1g(Y) | 1 F2g(A) | 2 F2g(A) | 3 F2g(A) | F2g(O) | A1g(O) |
|---|---|---|---|---|---|---|---|
| Frequency (cm−1) | 132.54 | 164.19 | 312.37 | 382.065 | 414.16 | 508.91 | — |
| FWHM (cm−1) | 2.71 | 7.01 | 35.01 | 14.26 | 13.63 | 12.50 | — |
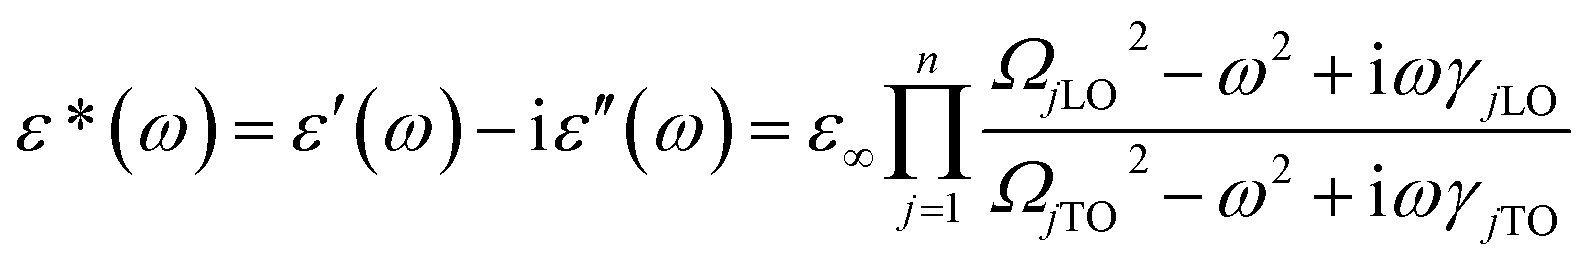
The IR reflection spectrum was obtained within the range of 50–700 cm−1 (Fig. 3). According to A. D. Arulsamy,16,17 dielectric constant is inversely proportional to wavenumber (frequency). The vibrational frequencies of the IR modes were obtained by fitting the curve with four-parameter semi-quantum model (FPSQ),18 which describes the correlation between the complex permittivity (ε*) and the vibrational modes, as shown in the following eqn (1):
 | (1) |
 | (2) |
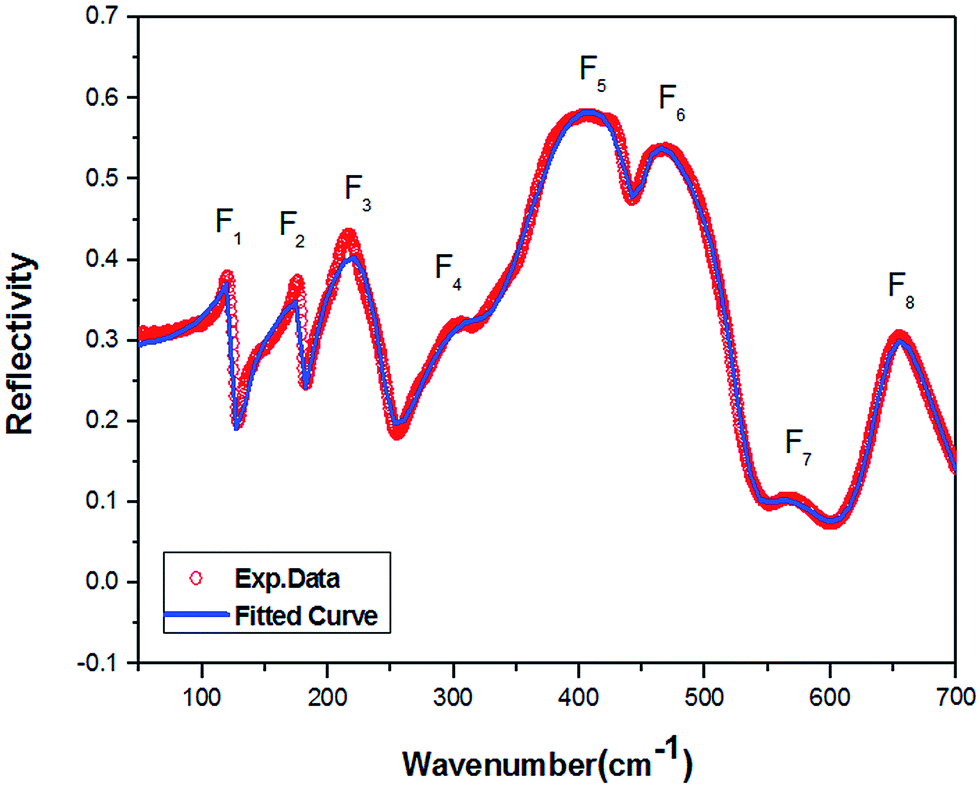 | ||
| Fig. 3 Fitting results for the FTIR reflection spectrum of Y(Mg1/2Sn1/2)O3 using the four-parameter model: experimental spectrum and the fitted curve. | ||
The contribution of each vibrational mode to the dielectric properties (permittivity εr and loss tanδj/ω) was discussed on the basis of the four-parameter model fitting results. The dielectric parameters can be derived from eqn (3) and (4) as follows:
 | (3) |
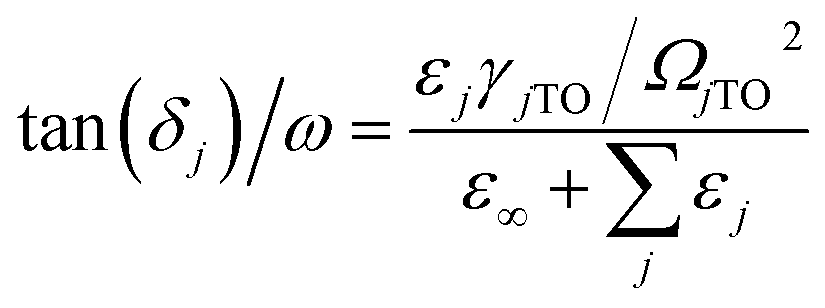 | (4) |
The calculated εj and tanδj/ω are also listed in Table 4. The vibrational modes at low and middle frequencies yield a larger contribution to εj and tan![[thin space (1/6-em)]](https://www.rsc.org/images/entities/i_char_2009.gif) δj/ω. Thus, the dielectric properties are mainly affected by the pattern involving more movements towards metal atoms. The modes F(1)1u, F(2)2u, and F(3)3u are primarily represented as the inverted translational vibration of the Y–MgO6 octahedron anti-translational vibration. In the range of 200–500 cm−1, the vibrational modes [F(4)4u, F(5)5u, and F(6)6u] correspond to the stretching vibrations of Mg–O–Sn. Within the range of 500 and 700 cm−1, F(7)7u and F(8)8u are regarded as the bending vibrations of Sn–O6.
δj/ω. Thus, the dielectric properties are mainly affected by the pattern involving more movements towards metal atoms. The modes F(1)1u, F(2)2u, and F(3)3u are primarily represented as the inverted translational vibration of the Y–MgO6 octahedron anti-translational vibration. In the range of 200–500 cm−1, the vibrational modes [F(4)4u, F(5)5u, and F(6)6u] correspond to the stretching vibrations of Mg–O–Sn. Within the range of 500 and 700 cm−1, F(7)7u and F(8)8u are regarded as the bending vibrations of Sn–O6.
| Number | Modes | Ωcal (cm−1) | ΩjTO (cm−1) | γjTO (cm−1) | ΩjLO (cm−1) | γjLO (cm−1) | Δεj | tanδj/ω (10−4 cm) |
|---|---|---|---|---|---|---|---|---|
| a ε∞ = 2.72. | ||||||||
| 1 | F(1)1u | 121 | 123.26 | 12.88 | 127.27 | 8.06 | 0.82 | 0.63 |
| 2 | F(2)2u | 176 | 180.93 | 11.49 | 182.53 | 6.42 | 0.29 | 0.92 |
| 3 | F(3)3u | 216 | 222.36 | 45.34 | 247.45 | 30.82 | 2.64 | 2.20 |
| 4 | F(4)4u | 306 | 311.54 | 63.93 | 323.81 | 56.13 | 1.08 | 0.65 |
| 5 | F(5)5u | 407 | 372.69 | 56.41 | 443.28 | 21.71 | 3.14 | 1.16 |
| 6 | F(6)6u | 469 | 446.69 | 22.29 | 530.83 | 37.18 | 0.10 | 0.01 |
| 7 | F(7)7u | 565 | 550.28 | 66.39 | 595.45 | 94.99 | 0.10 | 0.02 |
| 8 | F(8)7u | 655 | 639.22 | 31.83 | 697.71 | 110.52 | 0.12 | 0.009 |
The permittivity value (εr) obtained in this study is 12.16, and the value of IR fitting obtained by determining the sum of εj i.e., 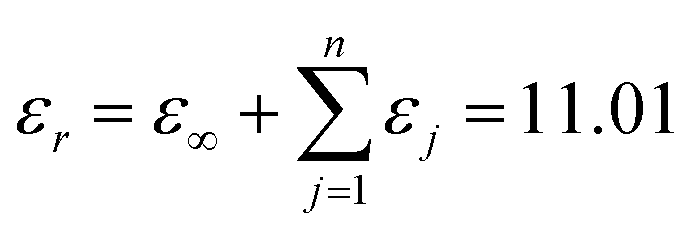 , which is closer to the value obtained using the FPSQ model. The difference between two data may be caused by various sintering temperatures or heating/cooling rates. However, the calculated dielectric loss is
 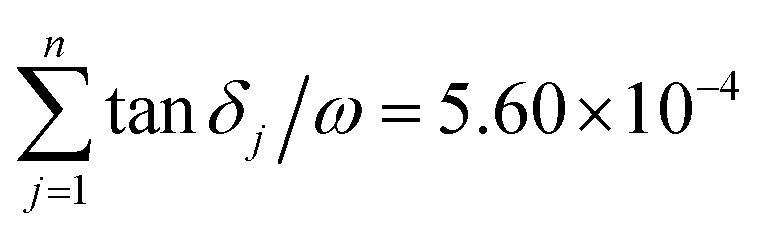 , and the experimental dielectric loss is 1.62 × 10⁻⁴. A significant difference is observed between the calculated dielectric loss and theoretical value; this discrepancy will be further investigated to improve the dielectric properties of the YMS ceramic.
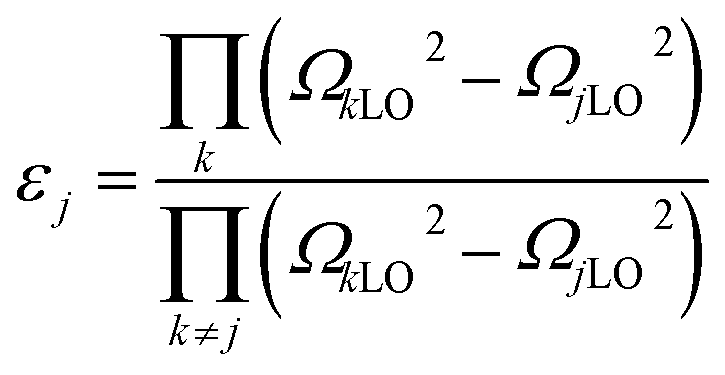
The relative permittivity εr correlates the polarization of the material in the atomic scale with the macroscopically measurable dielectric properties. According to Shannon,19 the molecular polarization can be expressed by the additive law:
| α[Y(Mg1/2Sn1/2)O3] = α(Y3+) + 1/2α(Mg2+) + 1/2α(Sn2+) + 3α(O2−) | (5) |
The theoretical dielectric constant can be calculated using the Clausius–Mossotti equation, and molecular polarizability is 11.46, close to the experimental value (εr = 12.16).
The classical radiation theory indicates that the half-width FWHM (Lorentz peak type) of the Raman spectrum is closely related to the frequency and damping. The damping coefficient can be calculated according to the following equation:
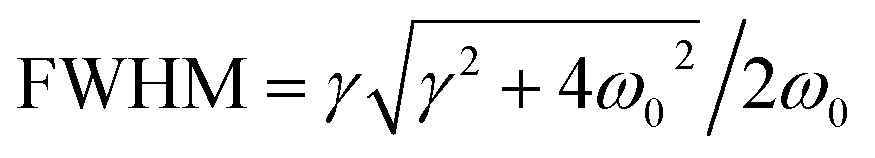 | (6) |
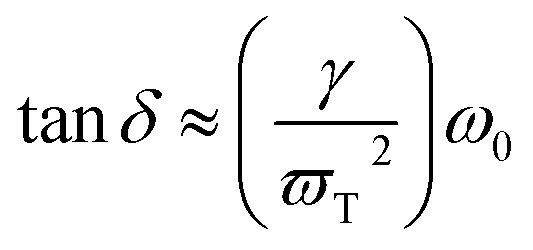 | (7) |
δj/ω = 8.79 × 10⁻⁴) and the experimental data (tanδj/ω = 1.62 × 10⁻⁴) is not very less, which may be due to the fact that the experimental conditions do not exactly match the theoretical ideal conditions. A number of experiments and theories are required to prove it, which will be the possible direction of our next study.
The complex permittivity is determined from the attenuation of the electromagnetic waves in the ceramic. The equation of the dielectric constant frequency is ε(ω) = ε′(ω) + iε′′(ω). The Kramers–Krönig dispersion relation is an effective method to evaluate the optical and dielectric parameters of materials from reflectance data measured at 45° incidence. The imaginary and real parts of the dielectric constant were obtained via the K–K analysis.
Fig. 4 shows the real part ε′ as a function of wavenumber ranging from 40 cm−1 to 700 cm−1, and five peaks are observed. For 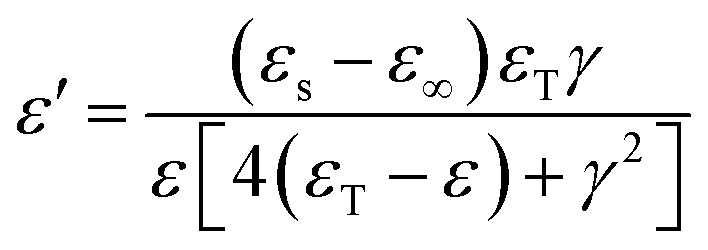 , when ε′(ω) reaches the maximum, the resonance frequency ωTO of the transducer can be determined from the real part of the dielectric constant. Among these five modes, no. 3 reaches the maximum value of the real part.
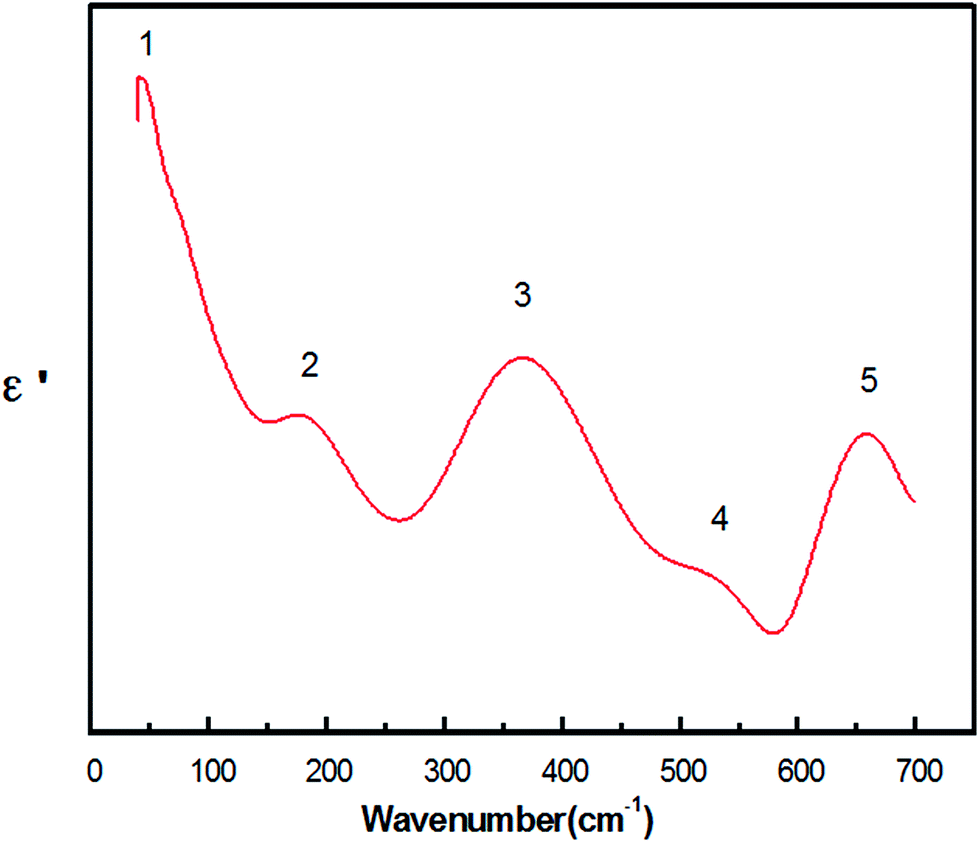 | ||
| Fig. 4 Real part of the dielectric constants ε′(ω) calculated from the K–K analysis for the Y(Mg1/2Sn1/2)O3 ceramic. | ||
Fig. 5 illustrates the imaginary part ε′′, which represents the absorption characteristics of oscillator to electromagnetic wave in the infrared region of 40–700 cm−1.21 Herein, 4 peaks were numbered, which were obtained via Lorentz fitting, and each peak corresponded to an IR-active pattern.
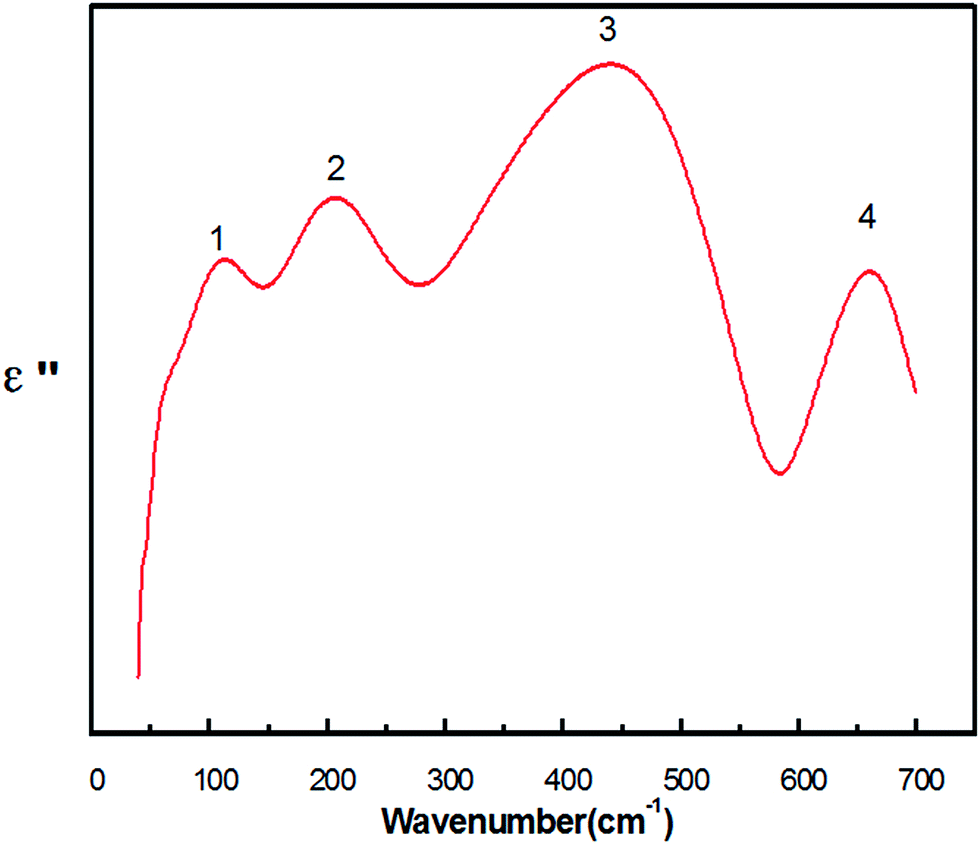 | ||
| Fig. 5 Imaginary part of the dielectric constants ε′′(ω) calculated from the K–K analysis for the Y(Mg1/2Sn1/2)O3 ceramic. | ||
4. Conclusion
The Y(Mg1/2Sn1/2)O3 ceramic was synthesized by the conventional solid-state reaction method and sintered at 1500 °C for 4 h. The crystal structure was investigated via XRD, and the vibration modes were researched via Raman and FTIR spectroscopies. The Rietveld refinement of the XRD data shows that the sample exhibits a monoclinic perovskite structure with the P21/n space group and proves that 1:1 ordered structure (Mg2+:Sn4+) exists at the B-site. The Raman spectrum was obtained, and it included three parts: vibration related to the A-site Y cations, B-site (1:1 ordered structure of Mg2+:Sn4+), and O ions. The IR-active modes are distributed into eight modes, and almost all the atoms participate in each IR vibrational mode; however, every atom exhibits different participation patterns. The permittivities inferred from the FPSQ and Clausius–Mossotti equation (molecular polarizabilities) are close to the experimental value. While the two calculated dielectric losses exhibit significant difference from the obtained data owing to the fact that the experimental conditions were not consistent with the ideal environment; this could be a potential direction to improve the properties of dielectric ceramics. The imaginary and real parts of the dielectric constant were obtained via the K–K analysis.
Acknowledgements
This work was supported by the National Natural Science Foundation of China (Grant No. 61501409), Natural Science Foundation of Shandong Province, China (Grant No. ZR2016EMM21), Scientific Research Foundation of Shandong University of Science and Technology for Recruited Talents (Grant No. 2016RCJJ002), and Opening Project of State Key Laboratory of High Performance Ceramics and Superfine Microstructure (Grant No. SKL201503SIC).References
- X. H. Sun, Y. Yang, Q. L. Zhang, X. Zhou, Z. Z. Hu and C. H. Huang, J. Mater. Sci., 2014, 49, 1058–1065 CrossRef CAS.
- B. J. Li, S. Y. Wang, C. L. Huang, Y. H. Lin and Y. B. Chen, J. Ceram. Soc. Jpn., 2014, 122, 951–954 CrossRef.
- R. Ubic, Y. Hu, K. Khamoushi and I. Abrahams, J. Eur. Ceram. Soc., 2006, 26, 1787–1790 CrossRef CAS.
- I. Levin, E. Cockayne, M. W. Lufaso, J. C. Woicik and J. E. Maslar, Chem. Mater., 2006, 18, 854–860 CrossRef CAS.
- F. Shi, H. Q. Sun, J. Wang and J. Zhang, J. Mater. Sci.: Mater. Electron., 2016, 27, 5383–5388 CrossRef CAS.
- C. L. Diao, C. H. Wang, N. N. Luo, Z. M. Qi, T. Shao, Y. Y. Wang and X. P. Jing, J. Am. Ceram. Soc., 2013, 96, 2898–2905 CrossRef CAS.
- C. F. Tseng, C. L. Huang and C. H. Hsu, J. Am. Ceram. Soc., 2006, 89, 1465–1470 CrossRef CAS.
- G. S. Babu, V. Subramanian, V. R. K. Murthy, I. N. Lin, C. T. Chia and H. L. Liu, J. Appl. Phys., 2007, 102, 064906 CrossRef.
- Y. C. Chen and H. C. Li, J. Mater. Sci.: Mater. Electron., 2014, 25, 4312–4318 CrossRef CAS.
- Y. C. Chen, Y. Y. Chen and S. L. Yao, J. Mater. Sci.: Mater. Electron., 2013, 24, 1150–1157 CrossRef CAS.
- Y. N. Wang, J. Mater. Sci.: Mater. Electron., 2013, 24, 4510–4515 CrossRef CAS.
- A. M. Glazer, Acta Crystallogr., 1975, 31, 756–762 CrossRef.
- G. S. Babu, V. Subramanian and V. R. K. Murthy, J. Eur. Ceram. Soc., 2007, 27(8), 2973–2976 CrossRef CAS.
- S. A. Prosandeev, U. Waghmare, I. Levin and J. Maslar, Phys. Rev. B: Condens. Matter Mater. Phys., 2005, 71, 214307 CrossRef.
- G. S. Babu, V. Subramanian, V. R. K. Murthy and R. L. Moreira, J. Appl. Phys., 2008, 103, 084104 CrossRef.
- A. D. Arulsamy, Ann. Phys., 2011, 326, 541–563 Search PubMed.
- F. Shi, H. Sun, H. Liu, G. Xu and J. Wang, Mater. Res. Bull., 2016, 75, 115–120 CrossRef CAS.
- C. H. Wang, X. J. Kuang, X. P. Jing, J. Lu, X. Lv and J. Shao, J. Appl. Phys., 2008, 103, 074105 CrossRef.
- R. D. Shannon, J. Appl. Phys., 1993, 73, 348–366 CrossRef CAS.
- R. Zurmuhlen, J. Petzelt, S. Kamba, V. V. Voitsekhovskii, E. Colla and N. Setter, J. Appl. Phys., 1995, 77, 5341–5350 CrossRef.
- D. M. Roessler, Br. J. Appl. Phys., 1966, 17, 1313 CrossRef CAS.
| This journal is © The Royal Society of Chemistry 2017 |