
 Open Access Article
 This Open Access Article is licensed under a Creative Commons Attribution-Non Commercial 3.0 Unported Licence
NiO and Co3O4 co-doped g-C3N4 nanocomposites with excellent photoelectrochemical properties under visible light for detection of tetrabromobisphenol-A
Yi Liua,
Jizhou Jiang *ab,
Yanjuan Suna,
Shengli Wua,
Yuan Caoa,
Wanyun Gonga and
Jing Zou*a
*ab,
Yanjuan Suna,
Shengli Wua,
Yuan Caoa,
Wanyun Gonga and
Jing Zou*a
aSchool of Chemistry and Environmental Engineering, School of Environmental Ecology and Bioengineering, Key Laboratory for Green Chemical Process of Ministry of Education, Wuhan Institute of Technology, Wuhan 430205, P. R. China. E-mail: jingzou@wit.edu.cn; 027wit@163.com
bDepartment of Physics, National University of Singapore, Singapore 117542. E-mail: phyjian@nus.edu.sg
First published on 19th July 2017
Abstract
Novel NiO/Co3O4/g-C3N4 nanocomposites with applications in photoelectrochemical sensing were designed and fabricated for the first time in this work. The morphology and microstructure of NiO/Co3O4/g-C3N4 were comprehensive investigated. The NiO/Co3O4/g-C3N4 nanocomposites exhibited higher photocurrent and donor density than those of pure g-C3N4, resulting in a higher photoelectrochemical activity for sensitive detection of TBBP-A in real water samples.
Tetrabromobisphenol-A (TBBP-A) is a brominated flame retardant and a persistent organic pollutant. It is widely used in many applications and has caused serious environmental problems and is a great threat to the ecological environment and human health because of its persistence, bioaccumulation and toxicity.1–3 TBBP-A has been mainly detected in air,4,5 water,6,7 sewage sludge,8,9 biological matrices10,11 and soil.12,13 Therefore, it is very important to monitor TBBP-A in organisms and environmental media rapidly and sensitively to assess the human and environmental risks of TBBP-A. Currently, several methods have been used to detect TBBP-A, such as gas chromatography-mass spectrometry (GC-MS), liquid chromatography-mass spectrometry (LC-MS), and tandem mass spectrometry (MS-MS).14–16 Although these methods are effective in detecting TBBP-A accurately, they required large amounts of organic solvent and complicated pretreatment procedures.
In recent years, the photoelectrochemical sensing method, which offers a fast response, low cost and high sensitivity, is an emerging technique for the environmental and biological detection of analytes. Therefore, many high activity photoelectrochemical nanomaterials have been widely investigated. g-C3N4-based nanocomposite, which is a newly developed novel photoelectron nanocomposite, can be used as an electron mediator for effective separation of photo-generated electron–hole pairs at the junction interface.17 Meanwhile, g-C3N4-based nanocomposites have also exhibited significantly improved optical and electrical activities,18–20 making it one of the most promising materials for the photoelectrochemical sensing method. Therefore, many researchers have made significant efforts to improve the photoelectrochemical activity of g-C3N4 by coupling it with other semiconductors, metals or carbon materials. For example, Cai and co-workers21 demonstrated a photoelectrochemical methodology for ultrasensitive detection of dopamine based on graphene/g-C3N4/TiO2 nanocomposites, which showed a 0.02 μmol L−1 detection limit under the optimized conditions. Our group has also provided an improved method to sensing octylphenol with NiO and Ni co-doped g-C3N4. Our g-C3N4-based nanocomposites modified electrode showed high electrochemical activity to octylphenol under infrared light irradiation.22 Another useful technique for quantitative assaying of T4 polynucleotide kinase activity based on Au/g-C3N4 nanohybrid was reported by Zhuang.23 An 2D ternary nano-junction g-C3N4/N-graphene/MoS2 was successfully designed and prepared, exhibiting an enhanced photoelectrochemical performance for simultaneous oxidation of methyl orange and reduction of Cr(VI).24 Ag modified g-C3N4 film electrodes, which displayed a high photoelectrocatalytic activity for the degradation of methylene blue, were successfully prepared by a liquid-based reaction onto the ITO substrates.25 The successful pairing of photoelectrochemical nanomaterials with a suitable doped catalyst is extremely important because the photoelectrochemical activity may be enhanced by improving the optical absorbance and separating photo-generated carriers at the junction interface. NiO and Co3O4 co-doped catalyst is probably one of the most ideal candidates due to their extraordinary inherent catalytic activity. Up to now, there have been no reports on detection of TBBP-A in real water samples by using photoelectrochemical technique with NiO and Co3O4 semiconductors co-doped g-C3N4 nanocomposites.
In this communication, NiO/Co3O4 co-doped g-C3N4 nanocomposites were successfully prepared by a step pyrolysis method, which is simple and low cost-effective. Nafion film electrodes were fabricated by dropping the mixture solution onto the glassy carbon electrode (GCE). The photoelectrochemical response of the g-C3N4/Nafion electrode significantly increased after modifying NiO/Co3O4 co-doped g-C3N4. On the basis of the NiO/Co3O4/g-C3N4 nanocomposites with excellent photoelectrochemical property, a simple and effective photoelectrochemical sensing method with a 0.1 μmol L−1 detection limit for sensitive detection of TBBP-A was developed through differential pulse voltammetry (DPV) under visible light irradiation. The photoelectrochemical sensing method was used for the analysis of TBBP-A in the real samples, and the precision and selectivity of the method were satisfactory.
NiO/Co3O4/g-C3N4 nanocomposites were prepared by pyrolysis method with a small amount of NiCl2·6H2O and Co(NO3)3·6H2O mixtures and 3 g melamine heated at 500 °C for 4 h in a muffle furnace under air atmosphere. The modified electrode of NiO/Co3O4/g-C3N4/GCE was fabricated by dropping the NiO/Co3O4/g-C3N4 nanocomposites suspension on the surface of bare GCE and dried naturally.
The morphology and structure of the NiO/Co3O4/g-C3N4 nanocomposites and g-C3N4 sheets were characterized by TEM. Fig. 1b shows a typically sheet structure of g-C3N4. As shown in Fig. 1a, it can be seen that the NiO and Co3O4 nanoparticles with about 30 nm diameter were dispersed on the ultrathin g-C3N4 sheets. Meanwhile, the high resolution TEM (HR-TEM) image (Fig. 1c) reveals the interface between NiO and Co3O4 nanoparticles. The d-spacing values of 0.209 and 0.243 nm are clearly observed, which consist of the (200) plane of NiO and (311) plane of Co3O4, respectively. The clear lattice fringes indicate the high crystallinity of the nanocomposites, suggesting the successful preparation of NiO and Co3O4 co-doped g-C3N4 nanocomposites.
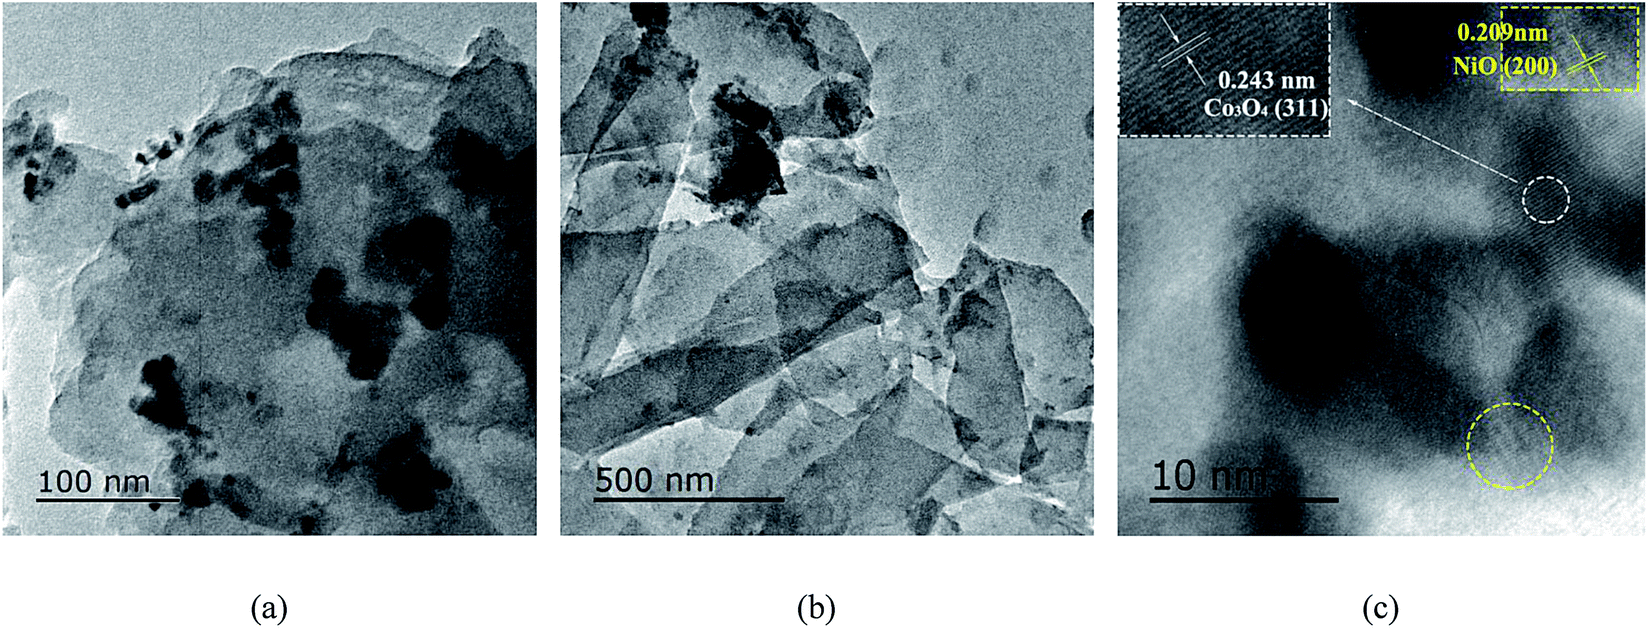 | ||
| Fig. 1 TEM images of (a) NiO/Co3O4/g-C3N4 and (b) g-C3N4, (c) HR-TEM image of NiO and Co3O4 from the areas labeled by the rounded frame. | ||
The crystalline structure of NiO/Co3O4/g-C3N4 nanocomposites and g-C3N4 sheets were characterized by XRD. In the XRD pattern of g-C3N4, the (002) peak at 2θ = 27.4° reflected the characteristic interlayer stacking structure, while the (100) diffraction at 13.1° indicated the interplanar structural packing, confirming that the layer-structured g-C3N4 was successfully synthesized. By comparing the XRD patterns of NiO/Co3O4/g-C3N4 nanocomposites and g-C3N4 sheets, it was found that the intensity of the (002) peak at 27.4° significantly decreases and the (100) peak at 13.1° disappears (Fig. 2), indicating a much-lowered long-range order in the atomic arrangements of g-C3N4 in the NiO/Co3O4/g-C3N4 nanocomposites. This result could be attributed to the decreased planar size and structural defects.26,27 We also observed three new peaks at 36.8°, 43.2° and 62.9°, where the former is corresponding to the (311) plane of the cubic phase of Co3O4 (JCPDS no. 43-1003), and the later two peaks are both the characteristic peaks for the cubic phase of NiO (JCPDS 47-1049). These results confirmed that we have successfully prepared the NiO/Co3O4/g-C3N4 hybrid nanocomposites, in accord with the result of the HR-TEM.
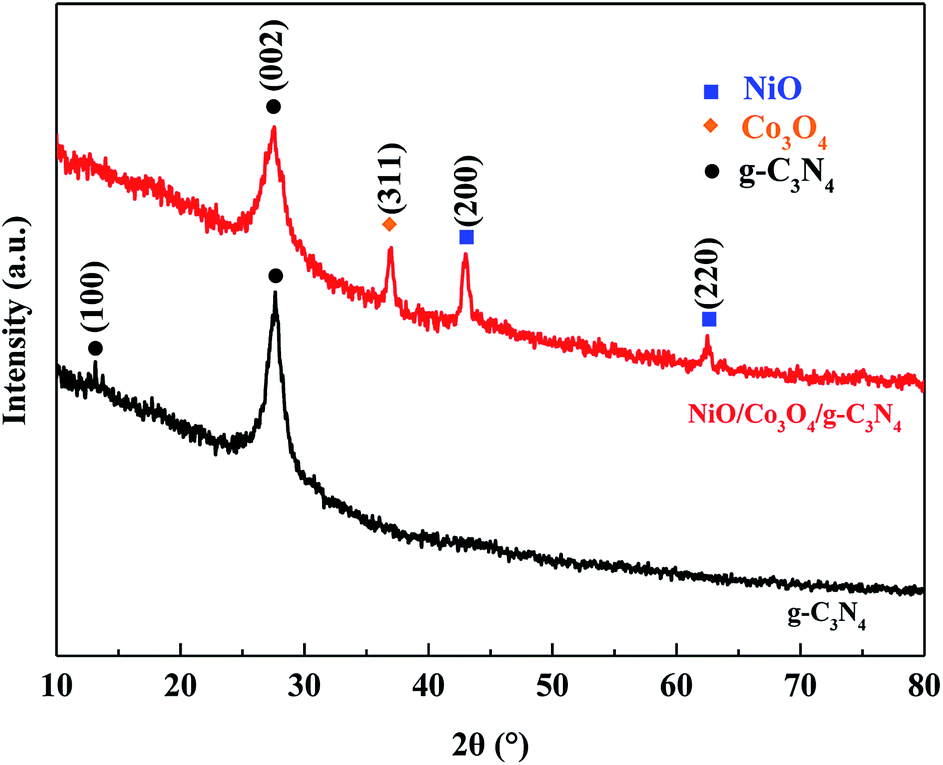 | ||
| Fig. 2 XRD patterns of NiO/Co3O4/g-C3N4 and g-C3N4. | ||
The optical absorption property of the materials can considerably determine their photocatalytic activity. The UV-vis diffuse reflectance spectra (DRS) analyses of NiO/Co3O4/g-C3N4, Co3O4/g-C3N4, NiO/g-C3N4 nanocomposites and pure g-C3N4 sheets are shown in Fig. 3a. The main absorption edge of g-C3N4 occurred at 457 nm (Eg = 2.71 eV), and the NiO/g-C3N4, Co3O4/g-C3N4, NiO/Co3O4/g-C3N4 nanocomposites are around 470 nm (Eg = 2.64 eV), 481 nm (Eg = 2.58 eV), 494 nm (Eg = 2.51 eV), respectively. This result indicated that NiO-doped and Co3O4-doped both widened the main absorption edge of g-C3N4 and the NiO/Co3O4 co-doped products exhibited the smallest band-gap, improving its conductivity. This result also implied that there was a synergistic effect between NiO and Co3O4 within the NiO/Co3O4/g-C3N4 nanocomposites. Interestingly, there is an extended visible-light absorption over 500–800 nm for all doped nanocomposites, which enables the possible utilization of low-energy visible light, or contributes to the high light-harvesting efficiency of the NiO/Co3O4/g-C3N4 nanocomposites.
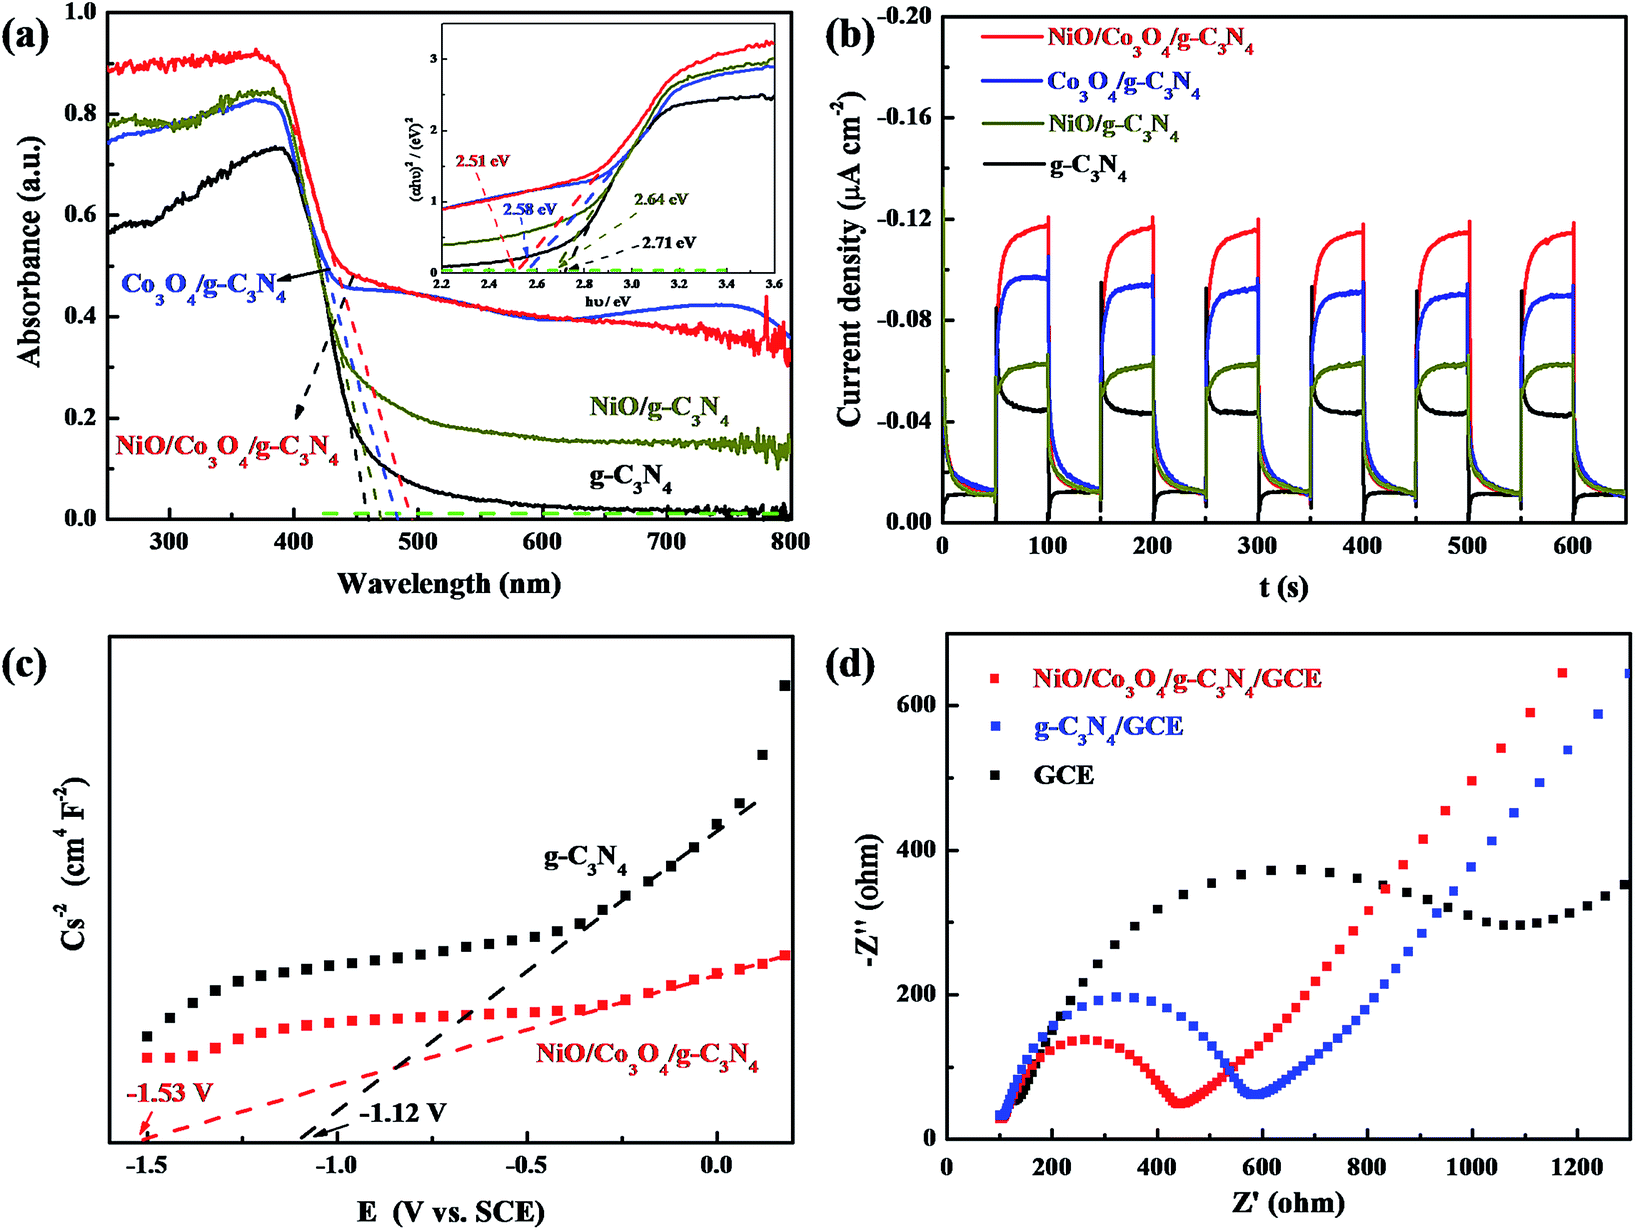 | ||
| Fig. 3 (a) DRS and (b) photocurrent density versus time (in 0.1 mmol L−1 Na2SO4 solution) of g-C3N4, Co3O4/g-C3N4, NiO/g-C3N4 and NiO/Co3O4/g-C3N4, (c) Mott–Schottky plots of g-C3N4 and NiO/Co3O4/g-C3N4, (d) EIS of different electrodes in 5 mmol L−1 K3[Fe(CN)6]/K4[Fe(CN)6], respectively. | ||
To further investigate the photoelectric response behavior of the NiO/Co3O4/g-C3N4 nanocomposites and to understand the role of NiO/Co3O4 in the nanocomposites, the transient photocurrents responses were recorded in 0.1 mol L−1 Na2SO4 with repeated light on/off cycles under a 300 W xenon lamp (λ > 420 nm) irradiation (Fig. 3b). NiO/g-C3N4, Co3O4/g-C3N4 and NiO/Co3O4/g-C3N4 nanocomposites all show higher photocurrent densities than that of the g-C3N4, suggesting that NiO- or Co3O4-doped can improve the conductivity of g-C3N4. Moreover, the NiO/Co3O4/g-C3N4 nanocomposites displayed a highest photocurrent density among all samples, which indicated that there was a synergistic effect between NiO and Co3O4 within the NiO/Co3O4/g-C3N4 nanocomposites, in concordance with the DRS results (Fig. 3a). These results also indicated that the dramatically increased photocurrent in NiO/Co3O4/g-C3N4 nanocomposites stems from effective charge carrier separation within the nanocomposites via electron transfer.
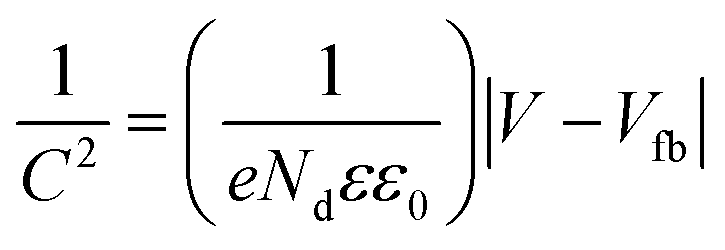
Additionally, for n-type semiconductor-electrode, the donor density was calculated by the standard formula:28
The electrochemical impedance value is one of the most important electrochemical parameters to understand the electrode materials. Thus, the electrochemical impedance spectroscopy (EIS) was used to characterize the interfacial properties of the nanocomposites in a solution of 0.1 mol L−1 KCl containing 5 mmol L−1 K3[Fe(CN)6]/K4[Fe(CN)6]. The Nyquist plot of the impedance spectra of different modified electrodes are shown in Fig. 3d. Compared with g-C3N4/GCE and GCE, the smallest semicircles of NiO/Co3O4/g-C3N4/GCE were observed in the higher frequency region, indicating that NiO/Co3O4/g-C3N4/GCE had a lowest transfer resistance.
Moreover, we have also explored the photoelectrochemical responses of TBBP-A at the NiO/Co3O4/g-C3N4/GCE. First, the electrochemical behaviors of TBBP-A at the different modified electrodes were investigated using differential pulse voltammetry (DPV) method in pH = 7.0 phosphate buffered saline (PBS) solution (Fig. 4a). By comparing the oxidation peak current at different modified electrodes, the strongest oxidation peak current of TBBP-A is observed at NiO/Co3O4/g-C3N4/Nafion/GCE, suggesting the NiO/Co3O4/g-C3N4 nanocomposites possess the strongest photoelectrochemical activity. Then we optimized the pH of the buffer solution. Because NiO has tendency to hydrolyze at pH values <5 or above 8, we investigated pH 5.8 to 8.0 PBS solutions. The oxidation peak current of TBBP-A at NiO/Co3O4/g-C3N4/GCE was the highest in pH = 5.8 PBS solution (Fig. 4b). Hence, pH = 5.8 PBS solution was selected as buffer solution in later experiments. Furthermore, based on the success of the NiO/Co3O4/g-C3N4 nanocomposites showing improved photoelectron activity, the electrochemical sensing method for analyzing TBBP-A in water samples was performed under visible-light irradiation as a function of the irradiation time. After two minutes of light irradiation, the oxidation peak current of TBBP-A was 2.5-fold than that of no light irradiation (Fig. 4c). The reason of improved photoelectron activity can be ascribed mainly to the effective separation of electron–hole pairs within NiO/Co3O4/g-C3N4 nanocomposites under visible-light irradiation.
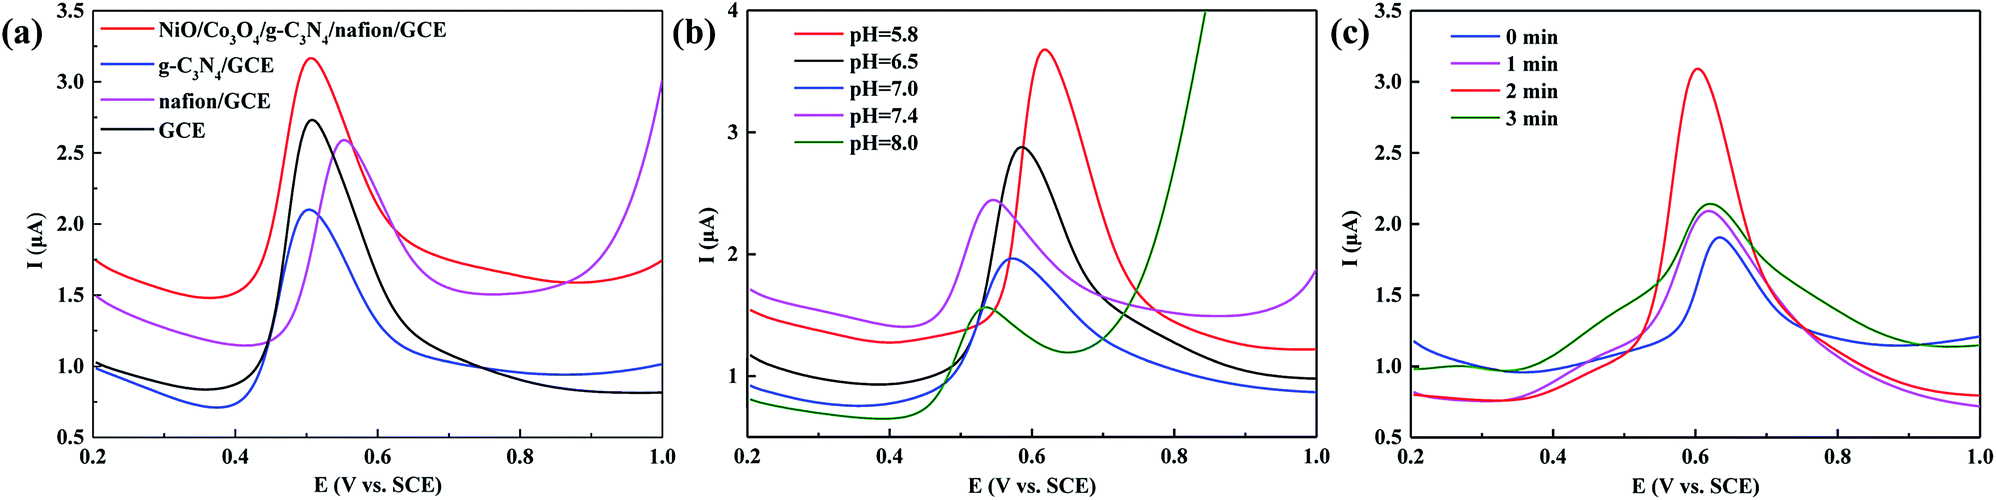 | ||
| Fig. 4 Differential pulse voltammograms of (a) different modified electrodes in pH = 7.0 PBS solution; (b) different pH solutions and (c) different lighting times (0.1 mmol L−1 TBBP-A, scan rate: 100 mV s−1). | ||
In addition, the relationship between peak current and scan rate is powerful tool to better understand the electrochemical performance of TBBP-A at NiO/Co3O4/g-C3N4/GCE. Thus, cyclic voltammograms (CV) at different scan rates were obtained. As shown in Fig. 5a, the relationship of the anodic (Ipa) peak currents versus the scan rate in the range 20 to 120 mV s−1, whose equation is Ipa (μA) = 0.0219v (V s−1) + 1.4533 (R = 0.995), suggesting that a controllable adsorption process occurring at NiO/Co3O4/g-C3N4/GCE.
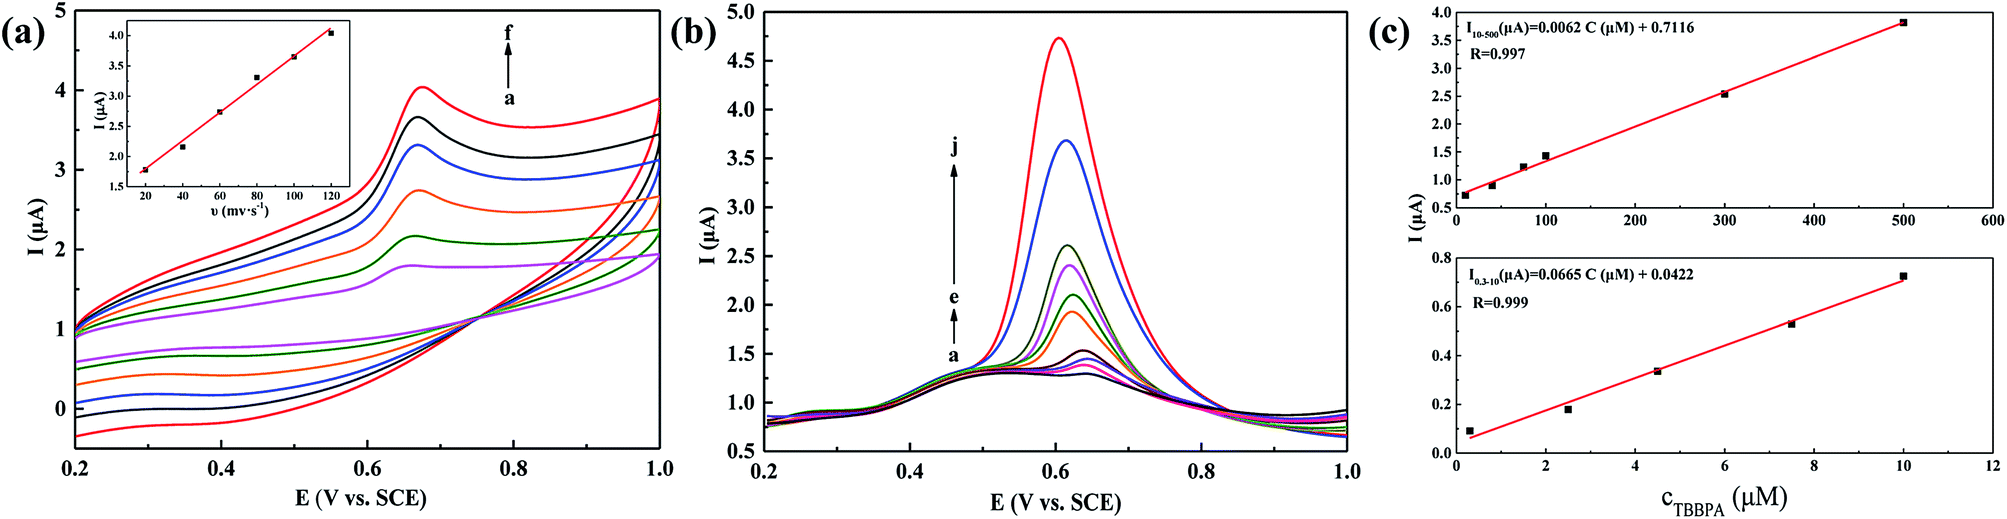 | ||
| Fig. 5 (a) Cyclic voltammograms of NiO/Co3O4/g-C3N4/GCE in 0.1 mmol L−1 TBBP-A in pH = 5.8 PBS solution at different scan rates (from (a to f): 20, 40, 60, 80, 100 and 120 mV s−1) (Inset) dependence of peak currents vs. scan rate. (b) Differential pulse voltammograms of NiO/Co3O4/g-C3N4/GCE in pH = 5.8 PBS containing different concentrations of TBBP-A from (a to e): 0.3 to 10 μmol L−1 and (e to j): 10 to 500 μmol L−1; (c) calibration plot of current vs. concentration (0.3 to 10 μmol L−1 and 10 to 500 μmol L−1). | ||
Fig. 5b shows the DPVs of a series of different concentrations TBBP-A in pH 5.8 PBS at the NiO/Co3O4/g-C3N4/GCE. The peak current displays a gradual increase with the increasing concentration of TBBP-A. Meanwhile, the anodic peak current increases linearly with the concentrations of TBBP-A from 0.3 to 10 μmol L−1 and 10 to 500 μmol L−1 (Fig. 5c), which correspond to two liner regression equations: Ipa (μA) = 0.0665C (μmol L−1) + 0.0422 (R = 0.999) and Ipa (μA) = 0.0062C (μmol L−1) + 0.7116 (R = 0.999), respectively. The limit of detection is about 0.1 μmol L−1 (S/N = 3). But when the concentration of TBBP-A is more than 500 μmol L−1, the electrochemical response becomes low, which could be attributed to the saturation of the electrode surface active sites.
Furthermore, we have investigated the electrochemical sensoring performance of the NiO/Co3O4/g-C3N4/GCE in the detection of TBBP-A in real water samples. Two kind of water sample are collected from Campus Lake and Yangtze River with random sampling. As shown in Table 1, the recoveries of TBBP-A in real samples were acceptable recoveries (94.1–109.6%), suggesting that the NiO/Co3O4/g-C3N4/GCE sensor could be used for detection of TBBP-A in practical water samples.
| Sensor | Samples | No | Added | Test | RSD (%) | Recovery (%) |
|---|---|---|---|---|---|---|
| NiO/Co3O4/g-C3N4/GCE | Campus Lake water (mol L−1) | 1 | 2.50 × 10⁻⁶ | 2.60 × 10⁻⁶ | 1.94 | 104.0 |
| 2 | 8.00 × 10⁻⁶ | 7.80 × 10⁻⁶ | 0.51 | 97.5 | ||
| 3 | 2.00 × 10⁻⁶ | 1.88 × 10⁻⁵ | 0.26 | 94.1 | ||
| Yangtze River water (mol L−1) | 1 | 1.50 × 10⁻⁶ | 1.64 × 10⁻⁶ | 0.45 | 109.6 | |
| 2 | 1.80 × 10⁻⁵ | 1.72 × 10⁻⁵ | 1.49 | 95.8 | ||
| 3 | 2.00 × 10⁻⁵ | 1.89 × 10⁻⁵ | 1.39 | 96.8 |
Meanwhile, the reproducibility of the modified electrode was also investigated by repetitively detecting 0.1 mmol L−1 TBBP-A for four times. The relative standard deviation (RSD) was 4.9%, demonstrating good reproducibility. The modified electrode was kept in refrigerator at 4 °C. After four weeks, it retained 92% of the initial peak current response, indicating that NiO/Co3O4/g-C3N4 film have long-term stability. The interferences were investigated in 0.1 mmol L−1 TBBP-A solution in the presence of bisphenol A, o-nitrophenol, m-nitrophenol, K+, CH3COO− and NO3−, respectively (Table 2). There was no influence on the peak current, suggesting the high selectivity of the NiO/Co3O4/g-C3N4/Nafion/GCE for the detection of TBBP-A.
| Interferences | C (mmol L−1) | Signal change (%) |
|---|---|---|
| Bisphenol A | 0.003 | +1.6 |
| o-Nitrophenol | 0.003 | +4.9 |
| m-Nitrophenol | 0.003 | +10.4 |
| K+ | 0.3 | +5.7 |
| CH3COO− | 0.3 | −0.4 |
| NO3− | 0.3 | −7.3 |
In conclusion, the functional NiO/Co3O4/g-C3N4 nanocomposites were synthesized by a simple method. Compared to g-C3N4, the nanocomposite reflects faster electronic conduction ability and stronger photoelectrochemical activity. An effective and sensitive detection method of TBBP-A was constructed with NiO/Co3O4/g-C3N4/GCE under visible light irradiation. It displayed two linear ranges from 0.3 to 10 μmol L−1 and 10 to 500 μmol L−1 with a limit of detection of about 0.1 μmol L−1. The NiO/Co3O4/g-C3N4 nanocomposites could be promising for applications in the field of photoelectrochemical sensing.
Fabrication of the modified electrode
NiO/Co3O4/g-C3N4/GCE was fabricated as follows: NiO/Co3O4/g-C3N4 nanocomposites suspension was prepared with 4.0 mg NiO/Co3O4/g-C3N4 dispersed into 4.0 mL of 0.1% Nafion solution. The solution was then sonicated ca. 10 minutes. Hereafter, bare GCE was mechanically polished to a mirror finish with 0.05 μm alumina slurry. Last, the above nanocomposites suspension of 5.0 μL was dropped on the surface of bare GCE. The modified electrode was dried naturally.Characterization
The X-ray powder diffraction (XRD) pattern was determined on an AXS D8 Advance X-ray Diffractometer (Bruker, Germany) equipped with Cu Kα radiation (λ = 1.54 Å) source in the 2θ range from 10 to 80° at a scanning rate of 0.025° s−1. The morphologies, structure and particle size of the as-prepared samples were carried out on a JSM-2100 transmission electron microscopy (TEM) (Electronics Co., Japan). The UV-vis diffuse reflectance spectra (DRS) were detected on a Cary Win 50 (Agilent, USA). The photoelectrochemical measurement was performed under a 300 W Xe lamp (Beijing Perfect Co., Ltd.). All electrochemical experiments and photoelectrochemical measurement were performed using a CHI 660E electrochemical workstation (Shanghai Chenhua Instrument Co., Ltd.) at room temperature. A three-electrode system equipped with a bare GCE or a prepared modified electrode as the working electrode, a Pt wire as the counter electrode and a saturated calomel electrode (SCE) as the reference electrode, was used for all electrochemical measurements.Acknowledgements
This work was financially supported by National Natural Science Foundation of China (Grant. 21471122), Graduate Student Education Innovation Foundation (Grants. CX2015147 and CX2016171), and President Foundation of Wuhan Institute of Technology (Grant. 2016062).Notes and references
- M. Hoffmann, E. Fiedor and A. Ptak, Toxicol. Lett., 2017, 269, 15–22 CrossRef CAS PubMed.
- F. Peng, G. Ying, B. Yang, Y. Liu, H. Lai, G. Zhou, J. Chen and J. Zhao, Environ. Toxicol. Chem., 2014, 33, 1705–1711 CrossRef CAS PubMed.
- T. Debenest, A.-N. Petit, F. Gagné, M. Kohli, N. Nguyen and C. Blaise, Chemosphere, 2011, 85, 50–55 CrossRef CAS PubMed.
- M. A.-E. Abdallah, S. Harrad and A. Covaci, Environ. Sci. Technol., 2008, 42, 6855–6861 CrossRef CAS PubMed.
- S. Harrad and M. A.-E. Abdallah, Chemosphere, 2011, 82, 1240–1245 CrossRef CAS PubMed.
- J. Eriksson, S. Rahm, N. Green, Å. Bergman and E. Jakobsson, Chemosphere, 2004, 54, 117–126 CrossRef CAS PubMed.
- Z. Zhang, A. Hibberd and J. Zhou, Anal. Chim. Acta, 2006, 577, 52–61 CrossRef CAS PubMed.
- E. Blanco, M. C. Casais, M. C. Mejuto and R. Cela, Anal. Chem., 2006, 78, 2772–2778 CrossRef CAS PubMed.
- S. Chu, G. D. Haffner and R. J. Letcher, J. Chromatogr. A, 2005, 1097, 25–32 CrossRef CAS PubMed.
- U. Berger, D. Herzke and T. M. Sandanger, Anal. Chem., 2004, 76, 441–452 CrossRef CAS PubMed.
- T. Hayama, H. Yoshida, S. Onimaru, S. Yonekura, H. Kuroki, K. Todoroki, H. Nohta and M. Yamaguchi, J. Chromatogr. B: Anal. Technol. Biomed. Life Sci., 2004, 809, 131–136 CrossRef CAS PubMed.
- C. Yu and B. Hu, J. Chromatogr. A, 2007, 1160, 71–80 CrossRef CAS PubMed.
- J. Jin, H. Peng, Y. Wang, R. Yang and J. Cui, Organohalogen Compd., 2006, 68, 85–88 CAS.
- R. Saint-Louis and E. Pelletier, Analyst, 2004, 129, 724–730 RSC.
- A. Covaci, S. Voorspoels, L. Ramos, H. Neels and R. Blust, J. Chromatogr. A, 2007, 1153, 145–171 CrossRef CAS PubMed.
- P. Korytár, A. Covaci, P. Leonards, J. De Boer and U. T. Brinkman, J. Chromatogr. A, 2005, 1100, 200–207 CrossRef PubMed.
- Y. Zheng, Y. Jiao, Y. Zhu, Q. Cai, A. Vasileff, L. Li, Y. Han, Y. Chen and S. Qiao, J. Am. Chem. Soc., 2017, 139, 3336–3339 CrossRef CAS PubMed.
- J. Jiang, RSC Adv., 2016, 6, 47368–47372 RSC.
- S. Samanta, S. Khilari, D. Pradhan and R. Srivastava, ACS Sustainable Chem. Eng., 2017, 5, 2562–2577 CrossRef CAS.
- J. Jiang, J. Zou, A. T. S. Wee and W. Zhang, Sci. Rep., 2016, 6, 34599 CrossRef CAS PubMed.
- Z. Cai, M. Rong, T. Zhao, L. Zhao, Y. Wang and X. Chen, J. Electroanal. Chem., 2015, 759, 32–37 CrossRef CAS.
- W. Gong, J. Zou, S. Zhang, X. Zhou and J. Jiang, Electroanalysis, 2016, 28, 227–234 CrossRef CAS.
- J. Zhuang, W. Lai, M. Xu, Q. Zhou and D. Tang, ACS Appl. Mater. Interfaces, 2015, 7, 8330–8338 CAS.
- Y. Hou, Z. Wen, S. Cui, X. Guo and J. Chen, Adv. Mater., 2013, 25, 6291–6297 CrossRef CAS PubMed.
- F. Qi, Y. Li, Y. Wang, Y. Wang, S. Liu and X. Zhao, RSC Adv., 2016, 6, 81378–81385 RSC.
- F. Zhao, H. Cheng, Y. Hu, L. Song, Z. Zhang, L. Jiang and L. Qu, Sci. Rep., 2014, 4, 5882 CrossRef CAS PubMed.
- Z. Zhou, Y. Shen, Y. Li, A. Liu, S. Liu and Y. Zhang, ACS Nano, 2015, 9, 12480–12487 CrossRef CAS PubMed.
- K. Gelderman, L. Lee and S. W. Donne, J. Chem. Educ., 2007, 84, 685 CrossRef CAS.
| This journal is © The Royal Society of Chemistry 2017 |