 Open Access Article
Creative Commons Attribution 3.0 Unported Licence
Synthesis of mixed-ligand Cu–MOFs and their adsorption of malachite green
Zhennan Shiab,
Ling Li *abc,
Yuxiang Xiaoab,
Yingxi Wangabc,
Keke Sunab,
Hangxing Wangab and
Li Liuabc
aHubei Collaborative Innovation Center for Advanced Organic Chemical Materials, Hubei University, 430062, People's Republic of China. E-mail: waitingll@yahoo.com; Fax: +86 2788663043; Tel: +86 2788662747
bMinistry-of-Education Key Laboratory for the Synthesis and Application of Organic Function Molecules, Hubei University, Xueyuan Road 11#, Wuchang, Wuhan City, Hubei Province 430062, People's Republic of China
cKey Laboratory of Green Preparation and Application for Materials, Ministry of Education, Hubei University, 430062, People's Republic of China
First published on 15th June 2017
Abstract
Different mixed-ligand MOFs with various ratios of Cu2+ and ligands (MOFs-1, MOFs-2, MOFs-3 and MOFs-4) were synthesized and characterized. The mixed-ligand MOFs-2 was the optimal adsorbent, as confirmed by studying the adsorption of malachite green (MG); the adsorption capacity of MOFs-2 for MG was calculated to be 185.4 mg g−1. Based on a combination of surface and pore structure analysis, it was concluded that size match is more important than surface area for adsorption. Adsorption isotherms were acquired, and the results showed that the adsorption is a physical process that obeys the Freundlich model. The adsorption mechanisms were tested, and the results showed that the adsorption has pseudo-first-order kinetics. MOFs-2 was proven to be stable in water and suitable to be recycled for waste water treatments.
1. Introduction
Currently, over 1![[thin space (1/6-em)]](https://www.rsc.org/images/entities/char_2009.gif) 000
000![[thin space (1/6-em)]](https://www.rsc.org/images/entities/char_2009.gif) 000 varieties of commercial dyes are in use; however, many of these are regarded as toxic or even carcinogenic, and they are difficult to degrade.1 Malachite green (MG) is one of the most common dyes; it not only deteriorates water quality, but also has a significant impact on human health due to toxic, carcinogenic, teratogenic or mutagenic effects.2,3 However, MG is an important industrial chemical, and its recovery is necessary.4,5
000 varieties of commercial dyes are in use; however, many of these are regarded as toxic or even carcinogenic, and they are difficult to degrade.1 Malachite green (MG) is one of the most common dyes; it not only deteriorates water quality, but also has a significant impact on human health due to toxic, carcinogenic, teratogenic or mutagenic effects.2,3 However, MG is an important industrial chemical, and its recovery is necessary.4,5
Among the techniques applied for removing dyes, adsorption technology is deemed to be one of the most effective approaches due to its wide application, efficient treatment, and convenient operation. Particularly, this method can be used to recycle beneficial products and other materials.6
As a traditional adsorbent, activated carbon is often used in the treatment of dyed wastewater; however, due to its inadequate adsorption of dyes, it is only applicable where the dye is present in a low concentration range. Therefore, the discovery of new materials for valid adsorption and removal of MG is highly valuable.
Metal–organic frameworks (MOFs) have drawn increasing attention owing to their high porosity and tunability.7,8 Research concerning the application of MOFs in wastewater treatment is receiving attention.9,10 MOF materials have been found to be effective and economical adsorbents for dyes in waste water.11–13 In order to improve the adsorption properties of MOFs, the choice of the primary organic moiety is becoming increasingly important.14 Compared to single ligand MOFs, mixed-ligand MOFs have achieved a new level of rational design and construction which involves the synergetic coordination of different ligands with metals and subsequent networking and which enables better performance in dye adsorption.15
In this study, different mixed ligand Cu–MOFs were synthesized; the adsorption of MG on the mixed-ligand Cu–MOFs was studied with adsorption isotherms, thermodynamics and kinetics. The feasibility of using mixed ligand Cu–MOFs as adsorbents for removing MG from wastewater was discussed.
2. Experimental
2.1 Chemicals and materials
All chemicals used were of analytical grade. Phthalate, isophthalic acid (H2BDC), trimesic acid (H3BTC), Cu(NO3)2, ethanol, acetone, and acetonitrile were obtained from Sigma Company. Ultrapure water (18.2 MU cm) was obtained from a WaterPro Water Purification System (Labconco Corporation, Kansas City, MO, USA). Dye wastewater was simulated with malachite green, and the stock solution of MG (1.0 × 10⁻⁵ mol L−1) was prepared by dissolving MG in ultrapure water; this was diluted to different concentrations for use. The MG concentrations were determined using an ultraviolet spectrophotometer at 620 nm. A calibration curve was obtained from the spectra of the standard solutions and was used to determine the residual concentrations of MG in solution.The powder X-ray diffraction (XRD) measurements were performed using a D8 Advance X-ray diffractometer (Bruker Company, USA). Fourier transform infrared (FT-IR) spectroscopy was carried out on a single frequency infrared spectrophotometer (PerkinElmer, USA). Also, scanning electron microscope images were obtained using a JSM6510LV scanning electron microscope (JEOL, Japan).
2.2 Instrumentation
A 100 °C mercury thermometer, electronic balance and 85-2 constant temperature magnetic stirrer (Shanghai Sile Instrument Factory), DF-101S heat collection thermostatic heating magnetic stirrer and DZF-6020 vacuum drying oven (Shanghai Jinghong Laboratory Equipment Co., Ltd.), 80-2 centrifugal precipitation machine (Jiangsu Jintan Zhongda Instrument Factory), SB-1000T ultrasonic cleaning machine (Ningbo Xinzhi Biotechnology Co., Ltd.), 101-A electric blast drying oven (Beijing Yong-Ming Medical Instrument Factory), UV-vis spectrophotometer, D8 Advance X-ray diffractometer, and single frequency infrared spectrophotometer (PerkinElmer, United States), and EPMA-8705QH2 scanning electron microscope (Shimadzu Corporation) were used.2.3 Cu–MOFs synthesis
Similar procedures were conducted for the synthesis of MOFs-1, MOFs-3, and MOFs-4 using different ratios of H2BDC and H3BTC, as shown in Table 1.
| Sample | Cu(NO3)2 | H2BDC | H3BTC | BET surface area (m2 g−1) | Pore volume (cm3 g−1) | Pore size (nm) |
|---|---|---|---|---|---|---|
| MOFs-1 | 1.0900 g | 0.4203 g | — | 51.7898 | 0.1899 | 14.6693 |
| MOFs-2 | 1.0900 g | 0.2512 g | 0.2117 g | 308.9701 | 0.1635 | 2.1167 |
| MOFs-3 | 1.0900 g | 0.1253 g | 0.3713 g | 589.6115 | 0.3076 | 2.0868 |
| MOFs-4 | 1.0900 g | — | 0.5301 g | 680.5944 | 0.3171 | 2.2754 |
2.4 Adsorption experiments
Before adsorption, the Cu–MOFs were dried in a vacuum oven at 180 °C for 3 h. The adsorbent (10.0 mg) was added to 5 mL solutions of MG with different concentrations. The mixture was oscillated well for a fixed time (5 to 60 min) at 25 °C. After adsorption, the solution was centrifuged at 5000 rpm for 5 min, and the concentration of residual MG was analyzed using a UV spectrophotometer at the maximum wavelength of 620 nm. For the kinetic studies, the supernatant was collected at different time intervals for the determination of unabsorbed MG. The adsorption efficiency (removal efficiency) was defined as follows:here, MG0 is the original concentration of MG, and MGt is the residual MG concentration at the fixed time.
2.5 Desorption experiments
In order to evaluate the feasibility of regenerating MOFs saturated with MG, solutions of methanol, ethanol and acetone were used as eluents to carry out desorption experiments. After adsorption of MG, the eluent solution was added to the used MOFs and the mixture was ultrasonicated for half an hour.3. Results and discussion
3.1 Characterization of Cu–MOFs
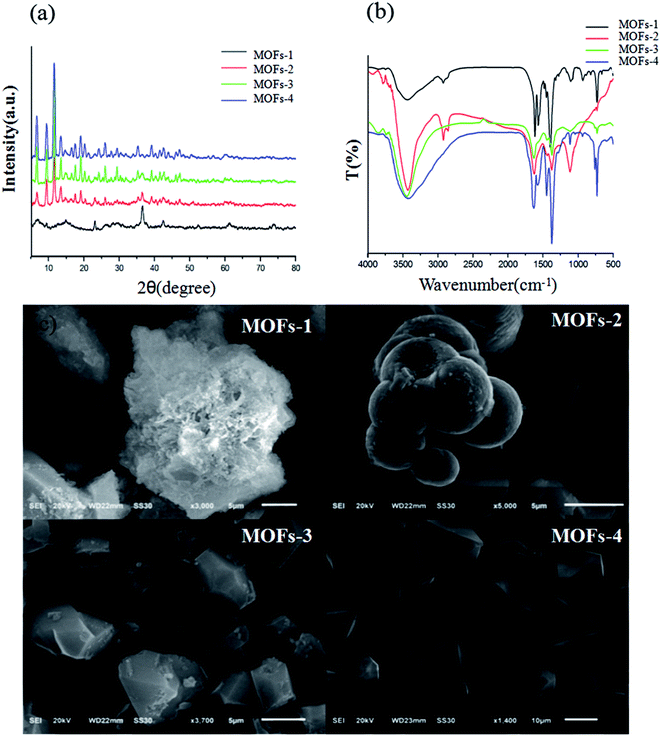
The powder XRD patterns of the different Cu–MOFs are shown in Fig. 1. It is evident that all the Cu–MOFs showed characteristic diffraction peaks with significant differences. All the diffraction peaks demonstrated that all the prepared MOFs could be readily indexed as crystalline.Further confirmation is provided by the presented FT-IR spectra. Similar FTIR spectra were observed for all the synthesized MOFs due to the presence of phenyl monocarboxylic acid groups. The band at about 1630 cm−1 represents the stretching vibration of the carboxylate groups, and the band at about 1370 cm−1 represents the symmetric stretching of the carboxylate groups. Evident hypochromatic shifts of the characteristic absorption peaks in the range of 1500 to 1720 cm−1 were observed, indicating the successful coordination of carboxyls with different ratios of H2BDC and H3BTC with Cu2+. All of the results demonstrated the successful synthesis of the Cu–MOFs.
The textures of the composites are presented in Fig. 1. MOFs-1 and MOFs-4 are single ligand-based MOFs. MOFs-1 showed a pyknotic micro-ball form, and MOFs-4 consisted of free, smooth square crystals. MOFs-2 and MOFs-3 showed evident interpenetration structures; this proved the successful coordination of Cu2+ with both mixed ligands.
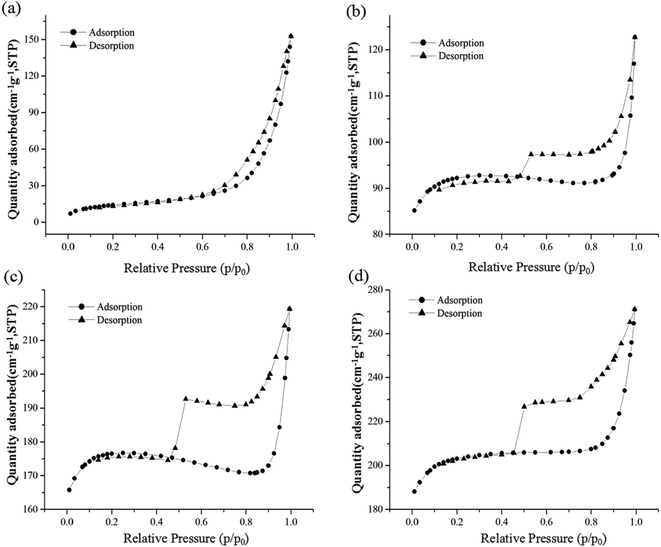
The surface area and pore size were analysed by N2 adsorption–desorption isotherms, as shown in Fig. 2. Similar isotherm shapes can be observed for MOFs-2, MOFs-3, and MOFs-4, with a certain adsorption capacity at low pressure and a hysteresis loop at medium and high pressures. Therefore, MOFs-2, MOFs-3, and MOFs-4 displayed I/IV mixed type isotherms. In comparison, MOFs-1 showed a type III isotherm. It can be concluded that MOFs-1 has a macroporous structure and MOFs-2, MOFs-3, and MOFs-4 have microporous and mesoporous structures.
The corresponding textural parameters are listed in Table 1. The pore size of MOFs-1 was 14.67 nm, which is larger than those of MOFs-2 (2.12 nm), MOFs-3 (2.09 nm), and MOFs-4 (2.28 nm). In addition, the BET surface areas of MOFs-1, MOFs-2, MOFs-3, and MOFs-4 were calculated to be 51.79, 308.97, 589.61, and 680.59 m2 g−1, respectively.
3.2 MG adsorption performance on different MOFs
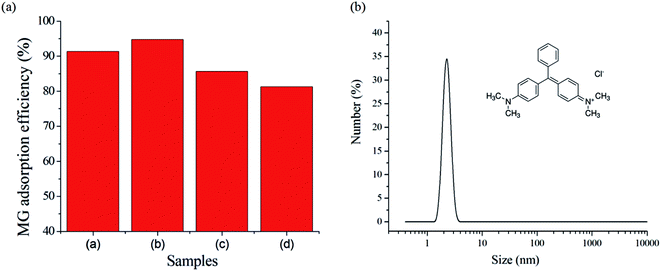
The adsorption behaviors of the different MOFs for MG were compared. The MG removal efficiency is shown in Fig. 3 (left). The mixed-ligand MOFs-2 showed the most adsorption of MG. It is interesting that the surface area of MOFs-2 was not the greatest, which is inconsistent with the rule that materials with large surface areas have excellent adsorption performance.When the molecular size and the pore size are very similar, the capture capability of an adsorbent is very strong. Furthermore, when the pore volume is very large, molecules desorb readily with high desorption speed, which leads to a decrease of the adsorption capacity. The MG particle size in solution was determined by the RLS technique, as shown in Fig. 3 (right). It is clear that the average particle size of MG was about 2 nm. Comparing the pore volumes and pore sizes of the MOFs in Fig. 3, the pore sizes of MOFs-2 and MOFs-3 are close to the particle size of MG. However, the pore volume of MOFs-3 is about twice that of MOFs-2. When the pore volume is larger, the adsorbed MG will desorb easily, which will result in a decrease of the real adsorption capacity. Therefore, the pore volume of MOFs-2 is suitable for MG adsorption. Therefore, MOFs-2 has a strong adsorption capacity for MG. It can be concluded that surface area was not the only factor which decided the adsorption capacity; the size match was more important for adsorption. The adsorption properties of the materials were decided by the structure; therefore, the adsorption can be controlled by adjusting the ratio of mixed ligands to form new materials.
3.3 The effects of concentration on adsorption
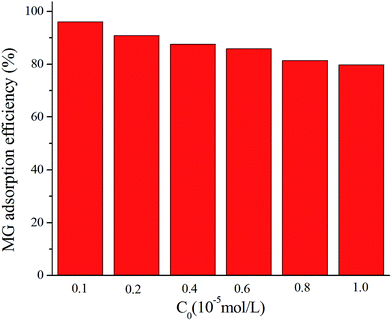
The adsorption behaviors of MOFs-2 with different concentrations of MG were compared. The MG removal efficiency is shown in Fig. 4. It was found that when the MG concentration was low, the MG removal efficiency of MOFs-2 was as high as 97%. When the MG concentration increased, the removal efficiency of MOFs-2 was still greater than 80%. This indicated that MOFs-2 had excellent adsorption not only at low concentrations but also in a high concentration range. Therefore, MOFs-2 can be used as an adsorbent for wastewater treatment.3.4 Adsorption mechanism for MG on MOFs-2
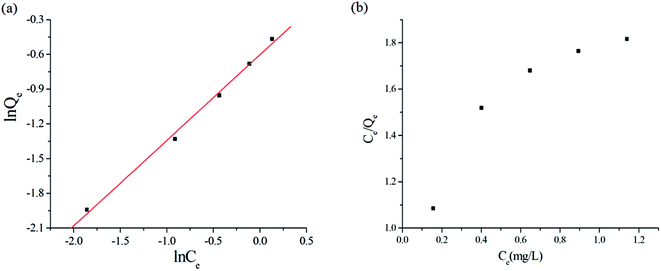
To describe the adsorption isotherm more scientifically, the Freundlich model and the Langmuir model were selected for this study. The Freundlich equation is given as
 | (1) |
 | (2) |
![[thin space (1/6-em)]](https://www.rsc.org/images/entities/char_2009.gif) Qe versus ln
Qe versus ln![[thin space (1/6-em)]](https://www.rsc.org/images/entities/char_2009.gif) Ce represents the Freundlich model, while a linear plot of (Ce/Qe) versus Ce represents the Langmuir model. The plots obtained from the experimental data are shown in Fig. 5(a) and (b), respectively. It is clear that the plot of ln
Ce represents the Freundlich model, while a linear plot of (Ce/Qe) versus Ce represents the Langmuir model. The plots obtained from the experimental data are shown in Fig. 5(a) and (b), respectively. It is clear that the plot of ln![[thin space (1/6-em)]](https://www.rsc.org/images/entities/char_2009.gif) Qe versus ln
Qe versus ln![[thin space (1/6-em)]](https://www.rsc.org/images/entities/char_2009.gif) Ce is linear, indicating that the adsorption was a Freundlich isothermal adsorption.
Ce is linear, indicating that the adsorption was a Freundlich isothermal adsorption.
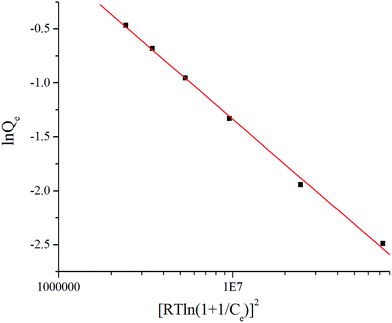
The Dubinin–Radushkevich (D–R) isotherm is used to distinguish chemical and physical adsorption phenomena, as shown in Fig. 6 and the D–R isothermal adsorption model is expressed as:
 | (3) |
 | (4) |
According to the literature,17 the average free energy of adsorption E (kJ mol−1) can be obtained through the plot of ln![[thin space (1/6-em)]](https://www.rsc.org/images/entities/char_2009.gif) Qe versus RT
Qe versus RT![[thin space (1/6-em)]](https://www.rsc.org/images/entities/char_2009.gif) ln(1 + 1/Ce).2 The adsorption is chemical when the value of E is between 8 and 16 kJ mol−1; when the value is less than 8, the adsorption is considered to be physical. E was calculated to be 3.85 kJ mol−1, indicating physical adsorption. In the construction of MOFs-2, the abundant carboxyl groups of the mixed ligands provide negative O atoms, and the N atom of MG is active (as seen in Fig. 3); therefore, electrostatic interaction was the driving force of the physical adsorption.
ln(1 + 1/Ce).2 The adsorption is chemical when the value of E is between 8 and 16 kJ mol−1; when the value is less than 8, the adsorption is considered to be physical. E was calculated to be 3.85 kJ mol−1, indicating physical adsorption. In the construction of MOFs-2, the abundant carboxyl groups of the mixed ligands provide negative O atoms, and the N atom of MG is active (as seen in Fig. 3); therefore, electrostatic interaction was the driving force of the physical adsorption.
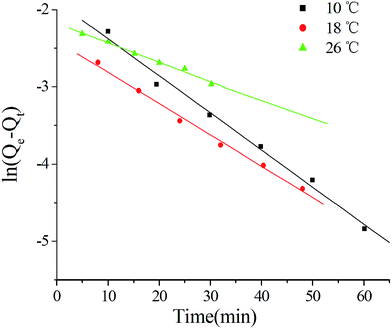
The time-dependent adsorption capacities at different temperatures were obtained to study the kinetics of the adsorption of MG on MOFs-2. According to the literature,18 a linear plot of ln![[thin space (1/6-em)]](https://www.rsc.org/images/entities/char_2009.gif) Qe − Qt versus time (t) represents the pseudo-first-order kinetic model, while a linear plot of (t/Qt) versus t represents the pseudo-second-order kinetic model. Three linear plots of ln
Qe − Qt versus time (t) represents the pseudo-first-order kinetic model, while a linear plot of (t/Qt) versus t represents the pseudo-second-order kinetic model. Three linear plots of ln![[thin space (1/6-em)]](https://www.rsc.org/images/entities/char_2009.gif) Qe − Qt versus t at different temperatures were obtained in this study; these indicated that the adsorptions obeyed the pseudo-first-order kinetic model, as shown in Fig. 7.
Qe − Qt versus t at different temperatures were obtained in this study; these indicated that the adsorptions obeyed the pseudo-first-order kinetic model, as shown in Fig. 7.
Additionally, the thermodynamic equilibrium constant (K) and the free energy change (ΔG) can be calculated on the basis of the adsorption equilibrium for different temperatures, as shown in Table 2. The negative free energy (ΔG) and the positive enthalpy change (ΔH) indicate that the adsorption of MG is spontaneous and is an endothermic process.
| T (K) | K | Equation | R | ΔH (kJ mol−1) | ΔS (J mol−1 K−1) | ΔG (kJ mol−1) |
|---|---|---|---|---|---|---|
| 283 | 35.75 | ln![[thin space (1/6-em)]](https://www.rsc.org/images/entities/char_2009.gif) K = −3178.238(1/T) + 14.587 K = −3178.238(1/T) + 14.587 |
0.9902 | 26.42 | 121.28 | −8.51 |
| 291 | 64.75 | −10.18 | ||||
| 299 | 105.75 | −11.86 |
3.5 The stability of MOFs-2
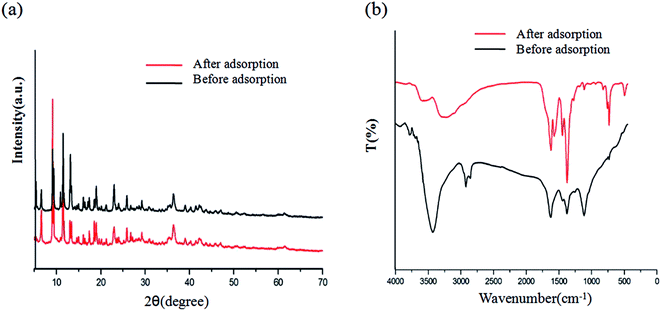
The XRD patterns and FT-IR spectra of MOFs-2 before and after adsorption are shown in Fig. 8. It is clear that the characteristic XRD peaks are the same; thus, it can be concluded that the structure of mixed-ligand MOFs-2 in aqueous solution was stable, indicating that MOFs-2 can be used in dyeing waste water treatment. It can also be seen from Fig. 7 that the bands in the range of 1000 to 1700 cm−1 which are attributed to the carboxyl symmetrical peak clearly changed, indicating that an interaction occurred between MOFs-2 and MG. Furthermore, there was a new peak at about 2800 cm−1, which is a characteristic peak of MG.3.6 Effects of recycled HKUST-1/GO on MB adsorption
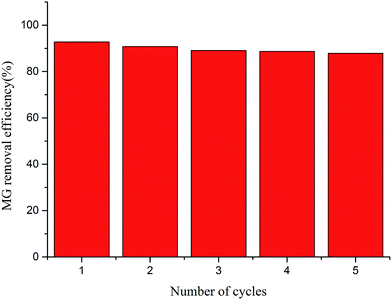
To evaluate the possible regeneration and reusability of MOFs-2 as an adsorbent, desorption experiments were performed. Methanol, ethanol, glycol and acetone were tested for the desorption experiments; acetone was found have the best desorption efficiency. After the adsorbed MG was washed with acetone, the acetone could be removed by drying the MOFs-2 in an oven. Thus, the used MOFs-2 could be regenerated with acetone to be recycled for reuse. The effects of five consecutive adsorption–desorption cycles were tested, and the results are shown in Fig. 9. It is clear that the MG removal efficiency was still greater than 90% after the adsorbent was recycled 5 times. This also proved that the structure of MOF-2 is stable and that the adsorption is mainly physical. After desorption, the MG adsorbed through physical interactions could be removed easily by washing with acetone, and the MOFs-2 could be reused for adsorption due to its stable structure. These results showed that MOFs-2 can be recycled for MG adsorption.4. Conclusions
In this study, different Cu–MOFs were synthesized and their adsorption of MG was compared. It was found that the adsorption of MOFs-2, which contains mixed ligands, was the best. The adsorption isotherms and mechanics of MOFs-2 for MG from water solution were discussed. The results showed that the adsorption obeyed the Freundlich isothermal model and the pseudo-first-order kinetic model. Furthermore, the adsorption was concluded to be a physical process. Most MOFs have been reported to be unstable in aqueous solution. However, MOFs-2 with mixed ligands was proved to be stable in aqueous solution. Therefore, mixed-ligands MOFs can be designed and the ratio of the mixed ligands can be adjusted to form stable adsorbents with large adsorption capacities for waste water treatment. We hope this will be useful in future applications in dyeing waste water treatment.Acknowledgements
This study was supported by The National Natural Science Foundation of China (51302071).References
- S. Chen, J. Zhang, C. Zhang, Q. Yue, Y. Li and C. Li, Desalination, 2010, 252, 149 CrossRef CAS.
- H. H. Hammud, A. Shmait and N. Hourani, RSC Adv., 2015, 5, 7909 RSC.
- L. Sun, S. Hu, H. Sun, H. Guo, H. Zhu, M. Liu and H. Sun, RSC Adv., 2015, 5, 11837 RSC.
- A. Sergi, F. Shemirani, M. Alvand and A. Tajbakhshian, Anal. Methods, 2014, 6, 7744 RSC.
- I. D. Mall, V. C. Srivastava, N. K. Agarwal and I. M. Mishra, Colloids Surf., A, 2005, 264, 17 CrossRef CAS.
- L. Li, X. L. Liu, M. Gao, W. Hong, G. Z. Liu, L. Fan, B. Hu, Q. H. Xia, L. Liu, G. W. Song and Z. S. Xu, J. Mater. Chem. A, 2014, 2, 1795 CAS.
- H. Guo, M. Wang, J. Liu, S. Zhu and C. Liu, Microporous Mesoporous Mater., 2016, 221, 40 CrossRef CAS.
- C. Petit and T. J. Bandosz, Dalton Trans., 2012, 41, 4027 RSC.
- S. Bhattacharya, S. Bala and R. Mondal, RSC Adv., 2016, 6, 25149 RSC.
- L. Li, X. L. Liu, H. Y. Geng, B. Hu, G. W. Song and Z. S. Xu, J. Mater. Chem. A, 2013, 1, 10292 CAS.
- H. Wang, X. Yuan, Z. Wu, L. Wang, X. Peng, L. Leng and G. Zeng, Sep. Sci. Technol., 2014, 49, 2689–2699 CrossRef CAS.
- H. Wang, X. Yuan, G. Zeng, L. Leng, X. Peng, K. Liao, L. Peng and Z. Xiao, Environ. Sci. Pollut. Res. Int., 2014, 21, 11552–11564 CrossRef CAS PubMed.
- Z. Wu, X. Yuan, J. Zhang, H. Wang, L. Jiang and G. Zeng, ChemCatChem, 2017, 9, 41–64 CrossRef CAS.
- J. P. Zhang, Y. B. Zhang, J. B. Lin and X. M. Chen, Chem. Rev., 2012, 112, 1001 CrossRef CAS.
- Z. Yin, Y. L. Zhou, M. H. Zeng and M. Kurmoo, Dalton Trans., 2015, 44, 5258 RSC.
- C. Liu, P. Wu, Y. Zhu and L. Tran, Chemosphere, 2016, 144, 1026 CrossRef CAS.
- S. G. Chen and R. T. Yang, Langmuir, 1994, 10, 4244 CrossRef CAS.
- M. Özacar, İ. Ayhan Şengil and H. Türkmenler, Chem. Eng. J., 2008, 143, 32 CrossRef.
| This journal is © The Royal Society of Chemistry 2017 |


