 Open Access Article
A highly selective fluorescent chemosensor for Fe3+ based on a new diarylethene with a rhodamine 6G unit†
Huitao Xu,
Haichang Ding,
Gang Li,
Congbin Fan ,
Gang Liu
 * and
Shouzhi Pu*
Jiangxi Key Laboratory of Organic Chemistry, Jiangxi Science and Technology Normal University, Nanchang, Jiangxi 330013, PR China. E-mail: liugang0926@163.com; pushouzhi@tsinghua.org.cn; Fax: +86-791-83831996; Tel: +86-791-83831996
First published on 7th June 2017
Abstract
Herein, a new diarylethene derivative bearing rhodamine 6G (1O) was synthesized via Schiff base condensation. It exhibited a sensitive response to Fe3+ with the solution changing from colorless (no fluorescence) to distinct pink (strong fluorescence) due to the transformation of the spirolactam ring to the open ring of rhodamine 6G. The diarylethene derivative bound to Fe3+ in the binding stoichiometry of 1![[thin space (1/6-em)]](https://www.rsc.org/images/entities/char_2009.gif) :
:![[thin space (1/6-em)]](https://www.rsc.org/images/entities/char_2009.gif) 1, and the limit of detection (LOD) of the 1O chemosensor for Fe3+ detection was found to be 65 nM. In addition, 1O exhibited an obvious acidichromism to TFA and could function as a reversible fluorescence photoswitch in response to UV/vis light irradiation. Based on these observations, a logic circuit was constructed with the combinational stimuli of UV/vis light and Fe3+/EDTA as inputs and the fluorescent emission intensity at 585 nm as the output.
1, and the limit of detection (LOD) of the 1O chemosensor for Fe3+ detection was found to be 65 nM. In addition, 1O exhibited an obvious acidichromism to TFA and could function as a reversible fluorescence photoswitch in response to UV/vis light irradiation. Based on these observations, a logic circuit was constructed with the combinational stimuli of UV/vis light and Fe3+/EDTA as inputs and the fluorescent emission intensity at 585 nm as the output.
Introduction
Heavy metal cations, such as Hg2+, Cu2+, and Fe3+, naturally exist and have been widely used in many industrial fields. They are toxic at high concentrations and are responsible for many incidents of industrial and agricultural pollution.1–3 Compared to the time-consuming and expensive instrumental techniques reported for heavy metal-ion detection, a chemosensor is a faster, cheaper, more powerful, and highly sensitive molecular tool for the detection of many biological and environmental heavy metal pollutants.4–6 Among all chemosensors, fluorescent chemosensors have attracted significant attention due to their simple operation, high sensitivity, and real-time detection. Fe3+ plays a key role in many biochemical processes at the cellular level and is indispensable for most of the organisms.7 It provides oxygen-carrying capacity to heme and acts as a cofactor in many enzymatic reactions involved in the mitochondrial respiratory chain. However, high levels of Fe3+ within the body can be associated with increased incidence of certain cancers and dysfunction of organs such as heart, pancreas, and liver.8–11 Therefore, new simple and efficient chemosensors for Fe3+ detection are highly desired.12 Several fluorescent sensors have been developed for Fe3+ detection. However, most of them detect Fe3+ based on fluorescence quenching by the paramagnetic property of Fe3+.13 For example, in an early study, Wolf et al. selectively detected Fe3+ in aqueous solutions with a 1,8-diacridylnaphthalene-derived fluorosensor based on fluorescence quenching. Therefore, the development of highly selective turn-on response chemosensors for Fe3+ is of significance and challenging.14 Photochromic materials can be potentially applied to optical memories, photoswitches, logic circuits, and chemosensors.15,16 Diarylethenes, one of the most promising photoresponsive compounds, have attracted significant research interests due to their excellent thermal stability, notable fatigue resistance, high sensitivity, and rapid response.17,18In particular, they can function as a fluorescence sensor based on their reversible fluorescence response to UV/vis lights irradiation. Recently, many diarylethene-based sensors have been reported. Zheng et al. prepared a dual-control molecular switch based on photochromic hexahydrogen cyclopentene bearing two rhodamine units and demonstrated it as an integrated logic circuit at the molecular level. Pu et al. exploited diarylethene-based fluorescence sensors to detect Fe3+, Hg2+, and Cu2+.19,20 Their study has contributed towards the comprehensive understanding of the sensors based on diarylethene-bearing functional groups.
The rhodamine 6G-based fluorescent chemosensor is an excellent fluorophore for metal ion detection and has attracted extensive interest in recent years by virtue of its excellent photophysical properties such as long excitation and emission wavelength, high fluorescence quantum efficiency, and excellent detection sensitivity.21,22 The off–on fluorescence switching of the chemosensor is based on the transformation between the spirocyclic and open ring forms of rhodamine 6G. The chemosensor is in the spirocyclic form in the absence of metal ions and exhibits no color or fluorescent emission. The addition of suitable metal ions can open the spirocycle via coordination, leading to chromogenic and fluorogenic responses.
In the present study, a diarylethene derivative bearing a rhodamine 6G moiety was synthesized to construct a fluorescent chemosensor for Fe3+ detection. The chemosensor exhibited excellent selectivity and sensitivity for Fe3+ detection via the turn on fluorescence signal in an aqueous acetonitrile solution (v/v = 1![[thin space (1/6-em)]](https://www.rsc.org/images/entities/char_2009.gif) :
:![[thin space (1/6-em)]](https://www.rsc.org/images/entities/char_2009.gif) 1). Scheme 1 is the schematic of the photochromism of the diarylethene derivative.
1). Scheme 1 is the schematic of the photochromism of the diarylethene derivative.
Experimental
General methods
Chemical reagents were obtained from J & K Scientific Ltd and were used as received. All the reagents and solvents were of analytical grade and diluted as required. All cations were added in the form of metal nitrates except for K+, Ba2+, Mn2+, and Hg2+ that were added as metal chlorides. The stock solutions of the metal ions were prepared in distilled water at the concentration of 0.1 mol L−1.NMR spectra were obtained using a Bruker AV400 (400 MHz) spectrometer with CDCl3 and DMSO-d6 as the solvents and tetramethylsilane (TMS) as the internal standard. Fluorescence quantum yield was measured using an Absolute PL Quantum Yield Spectrometer QY C11347-11. UV/vis spectra were obtained using an Agilent 8453 UV/vis spectrophotometer. The fluorescence spectra were obtained via a Hitachi F-4600 fluorescence spectrophotometer. Infrared spectra (IR) were obtained using a Bruker Vertex-70 FT-IR spectrometer.
Synthesis of 1O
Scheme 2 shows the synthesis route of the target compound, [1-(2-methyl-5-phenyl-3-thienyl)-2-{2-methyl-5-[4-N(rhodamine-6G)-hydrazide]phenyl-3-thienyl}perfluorocyclopentene] (1O). 3-Bromo-2-methyl-5-(1,3-dioxolane)thiophene (3), (2-methyl-5-phenyl-3-thieryl)perfluorocyclopentene (4), and 8 were synthesized as described in the literature.23–27 Compound 3 was coupled with 4 to afford compound 5, which was hydrolyzed to produce compound 6. Compound 8 reacted with 6 in anhydrous ethanol via Schiff base condensation to afford the target compound 1O. The detailed procedure is described as follows.A solution of n-BuLi/hexane (2.5 mol L−1, 4.90 mL) was added dropwise to 60 mL of compound 3 (3.24 g, 10.00 mmol) solution in anhydrous THF at 195 K under stirring and an argon atmosphere and stirred for 30 min. Compound 4 (3.67 g, 10.00 mmol) was slowly added to the reaction mixture at 195 K, further stirred for 3 h at the same temperature, and quenched with water. The product was extracted with dichloromethane, dried over Na2SO4, filtered, and evaporated. The crude product was purified by column chromatography using the petroleum ether–ethyl acetate (v/v = 10![[thin space (1/6-em)]](https://www.rsc.org/images/entities/char_2009.gif) :
:![[thin space (1/6-em)]](https://www.rsc.org/images/entities/char_2009.gif) 1) as the eluent to afford the compound 5 (2.60 g, 4.40 mmol), which was refluxed in acetone–water (v/v = 4
1) as the eluent to afford the compound 5 (2.60 g, 4.40 mmol), which was refluxed in acetone–water (v/v = 4![[thin space (1/6-em)]](https://www.rsc.org/images/entities/char_2009.gif) :
:![[thin space (1/6-em)]](https://www.rsc.org/images/entities/char_2009.gif) 1) for 2 h, extracted with dichloromethane, dried over Na2SO4, filtered, evaporated, and purified by column chromatography to afford compound 6 as a blue solid with a yield of 84%. Mp: 363–365 K. 1H NMR (CDCl3, 400 MHz), δ (ppm): 1.90 (t, 3H, J = 8.0 Hz), 1.93 (s, 3H), 7.21 (s, 1H), 7.25 (d, 1H, J = 8.0 Hz), 7.32 (t, 2H, J = 8.0 Hz), 7.37 (s, 1H), 7.47 (d, 2H, J = 8.0 Hz), 7.63 (d, 2H, J = 8.0 Hz), 7.83 (d, 2H, J = 8.0 Hz), 9.94 (s, 1H).
1) for 2 h, extracted with dichloromethane, dried over Na2SO4, filtered, evaporated, and purified by column chromatography to afford compound 6 as a blue solid with a yield of 84%. Mp: 363–365 K. 1H NMR (CDCl3, 400 MHz), δ (ppm): 1.90 (t, 3H, J = 8.0 Hz), 1.93 (s, 3H), 7.21 (s, 1H), 7.25 (d, 1H, J = 8.0 Hz), 7.32 (t, 2H, J = 8.0 Hz), 7.37 (s, 1H), 7.47 (d, 2H, J = 8.0 Hz), 7.63 (d, 2H, J = 8.0 Hz), 7.83 (d, 2H, J = 8.0 Hz), 9.94 (s, 1H).
A solution of compound 8 (0.98 g, 0.20 mmol) in 15 mL anhydrous ethanol was added to a solution of compound 6 (0.11 g, 0.20 mmol) under constant stirring, refluxed for 48 h, cooled down to room temperature, and quenched with water. The solvent was removed under reduced pressure. The residue was extracted with dichloromethane, and the organic phase was dried over Na2SO4, filtered, and evaporated. The crude product was purified by column chromatography on a silica gel column using petroleum ether–ethyl acetate (v/v = 4![[thin space (1/6-em)]](https://www.rsc.org/images/entities/char_2009.gif) :
:![[thin space (1/6-em)]](https://www.rsc.org/images/entities/char_2009.gif) 1) as the eluent to afford 1O (0.10 g, 0.10 mmol) as a light purple solid in 51% yield. Mp: 430–432 K. 1H NMR (DMSO-d6, 400 MHz), δ (ppm) 1.19 (t, 6H, J = 8.0 Hz), 1.82 (s, 6H), 1.96 (s, 6H), 3.10–3.13 (m, 4H), 5.05 (s, 2H), 6.16 (s, 2H), 6.32 (s, 2H), 7.03 (d, 1H, J = 8.0 Hz), 7.33 (d, 1H, J = 8.0 Hz), 7.41 (d, 3H, J = 4.0 Hz), 7.47 (s, 1H), 7.51 (s, 1H), 7.55–7.60 (m, 6H), 7.73 (s, 1H) 7.90 (d, 1H, J = 8.0 Hz), 8.64 (s, 1H) (Fig. S1†). 13C NMR (DMSO-d6, 100 MHz), δ (ppm): 13.97, 14.08, 16.86, 37.40, 62.73, 65.56, 95.67, 104.95, 118.15, 122.48, 122.92, 123.19, 123.72, 125.21, 125.48, 126.78, 127.37, 128.05, 128.10, 128.63, 128.80, 129.13, 132.42, 133.78, 134.08, 140.85, 141.13, 141.65, 141.83, 145.75, 147.74, 150.94, 151.29, 163.69 (Fig. S2†). MS (m/z): 959.28 [M + H]+ (Fig. S3†); IR (KBr, ν, cm−1): 1199, 1216, 1267, 1315, 1515, 1608, 1620, 1636, 1684, 1713.
1) as the eluent to afford 1O (0.10 g, 0.10 mmol) as a light purple solid in 51% yield. Mp: 430–432 K. 1H NMR (DMSO-d6, 400 MHz), δ (ppm) 1.19 (t, 6H, J = 8.0 Hz), 1.82 (s, 6H), 1.96 (s, 6H), 3.10–3.13 (m, 4H), 5.05 (s, 2H), 6.16 (s, 2H), 6.32 (s, 2H), 7.03 (d, 1H, J = 8.0 Hz), 7.33 (d, 1H, J = 8.0 Hz), 7.41 (d, 3H, J = 4.0 Hz), 7.47 (s, 1H), 7.51 (s, 1H), 7.55–7.60 (m, 6H), 7.73 (s, 1H) 7.90 (d, 1H, J = 8.0 Hz), 8.64 (s, 1H) (Fig. S1†). 13C NMR (DMSO-d6, 100 MHz), δ (ppm): 13.97, 14.08, 16.86, 37.40, 62.73, 65.56, 95.67, 104.95, 118.15, 122.48, 122.92, 123.19, 123.72, 125.21, 125.48, 126.78, 127.37, 128.05, 128.10, 128.63, 128.80, 129.13, 132.42, 133.78, 134.08, 140.85, 141.13, 141.65, 141.83, 145.75, 147.74, 150.94, 151.29, 163.69 (Fig. S2†). MS (m/z): 959.28 [M + H]+ (Fig. S3†); IR (KBr, ν, cm−1): 1199, 1216, 1267, 1315, 1515, 1608, 1620, 1636, 1684, 1713.
Results and discussion
Photochromism of 1O
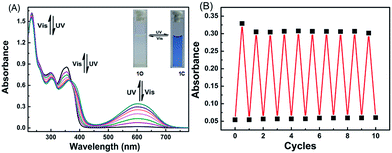
The photochromic properties of 1O were determined in acetonitrile (C = 2 × 10⁻⁵ mol L−1) at room temperature. The open ring isomer 1O exhibited an absorption peak at 353 nm (Fig. 1A) due to the π*–π transition.28 A new absorption band centered at 602 nm appeared, and the solution of 1O turned from colorless to blue under the irradiation at 297 nm, indicating that the closed-ring form 1C was formed. The blue solution of 1C could be bleached to colorless under the visible light irradiation at λ > 500 nm, and its absorption peak shifted back to 353 nm. An isosbestic point appeared at 370 nm, indicating that a two-component photochromic reaction occured.29–31 The cyclization and cycloreversion quantum yields of 1O were determined to be 0.232 and 0.003, respectively, with 1,2-bis(2-methyl-5-phenyl-3-thienyl)perfluorocyclopentene as a ref. 32 The fatigue resistance of 1O revealed that 1O degraded only 8.3% after 10 coloration–discoloration cycles in response to the alternate irradiations of UV/vis lights at room temperature (Fig. 1B).Spectral response of 1O to Fe3+
It has been reported that rhodamine 6G derivatives are subject to significant changes in absorption or fluorescence spectra upon coordination with metal ions and thus can be used as a sensitive probe for metal ion detection.33 In the present study, the fluorescence of 1O (C = 2.0 × 10⁻⁵ mol L−1) induced by metal ions including Fe3+, Cr3+, Al3+, Hg2+, Cu2+, Mg2+, Ba2+, Zn2+, Mn2+, Co2+, Ni2+, Ca2+, Cd2+, Pb2+, Sr2+, and K+ was determined in an aqueous acetonitrile solution (v/v = 1![[thin space (1/6-em)]](https://www.rsc.org/images/entities/char_2009.gif) :
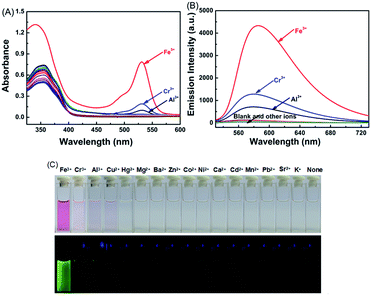
:![[thin space (1/6-em)]](https://www.rsc.org/images/entities/char_2009.gif) 1) at room temperature. As shown in Fig. 2A, for the absorption spectra of 1O in the presence of 10.0 equiv. of metal ions, only Fe3+, Cr3+, and Al3+ were able to induce strong absorptions at 531 nm, and Fe3+ caused a much stronger absorption peak than Cr3+ and Al3+.
1) at room temperature. As shown in Fig. 2A, for the absorption spectra of 1O in the presence of 10.0 equiv. of metal ions, only Fe3+, Cr3+, and Al3+ were able to induce strong absorptions at 531 nm, and Fe3+ caused a much stronger absorption peak than Cr3+ and Al3+.
Compound 1O in acetonitrile exhibited no obvious emission signal under excitation at 515 nm. The addition of 10.0 equiv. of Fe3+ to the 1O solution led to ca. 168-fold increase in the fluorescent emission intensity at 585 nm (Fig. 2B). The 1O solution showed weaker responses to Cr3+ and Al3+ with 45-fold and 28-fold increases in fluorescent emission peaks at 578 nm and 585 nm, respectively (Fig. S4†). These observations indicate that 1O can be potentially used as a selective fluorescence sensor for Fe3+ in an acetonitrile/water binary solvent system (v/v = 1![[thin space (1/6-em)]](https://www.rsc.org/images/entities/char_2009.gif) :
:![[thin space (1/6-em)]](https://www.rsc.org/images/entities/char_2009.gif) 1). In addition, Fe3+ turned the 1O solution from colorless to pink and from dark to a bright green yellow color under excitation at 515 nm due to the formation of the open ring amide form of rhodamine 6G (1O′) (Fig. 2C). Other metal ions caused no detectable increase in the emission intensity or solution color of 1O in the aqueous acetonitrile solution except for Cr3+, Al3+, and Cu2+ that turned the 1O solution to pale pink and caused a weak fluorescent emission (Fig. 2C).
1). In addition, Fe3+ turned the 1O solution from colorless to pink and from dark to a bright green yellow color under excitation at 515 nm due to the formation of the open ring amide form of rhodamine 6G (1O′) (Fig. 2C). Other metal ions caused no detectable increase in the emission intensity or solution color of 1O in the aqueous acetonitrile solution except for Cr3+, Al3+, and Cu2+ that turned the 1O solution to pale pink and caused a weak fluorescent emission (Fig. 2C).
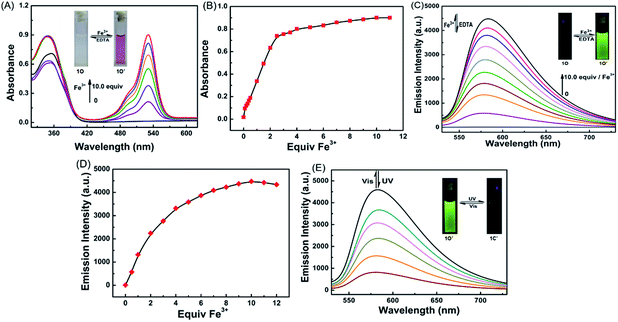
The chemosensing properties of 1O towards Fe3+ were further investigated via absorption and fluorescence titration. As shown in Fig. 3, the solution of 1O changed from colorless to pink (Fig. 3A), and a new absorption band centered at 530 nm appeared with the increase of Fe3+ equiv. from 0 to 10.0 due to the formation of 1O′ (Fig. 3B). Further increase in the Fe3+ amount caused no significant change in the absorption of 1O. Moreover, the fluorescent emission of 1O at 585 under excitation at 515 nm increased with the increase of Fe3+ equiv and peaked at 10.0 equiv. (Fig. 3C). The absolute fluorescence quantum yield was determined to be 0.43. The fluorescence intensity changes with the addition of Fe3+ were also visibly observed with the naked eye, with the solution turning from dark to a bright green-yellow under excitation at 515 nm (Fig. 3D).
The fluorescence was reverted by addition of an excess of EDTA (10.0 equiv.), indicating that the coordination of 1O with Fe3+ could be restored. Note that 1O′ also exhibited excellent fluorescent switching properties under alternate irradiations with UV/vis lights in aqueous acetonitrile (v/v = 1![[thin space (1/6-em)]](https://www.rsc.org/images/entities/char_2009.gif) :
:![[thin space (1/6-em)]](https://www.rsc.org/images/entities/char_2009.gif) 1) (Fig. 3E). In the photostationary state, the fluorescence emission intensity was quenched 82% due to the formation of 1C′ with the fluorescence changing from bright green-yellow to dark yellow. These results indicate that the diarylethene derivative 1O is a promising candidate for fluorescence-switching devices due to fluorescence switching behavior induced by both Fe3+/EDTA and UV/vis light.
1) (Fig. 3E). In the photostationary state, the fluorescence emission intensity was quenched 82% due to the formation of 1C′ with the fluorescence changing from bright green-yellow to dark yellow. These results indicate that the diarylethene derivative 1O is a promising candidate for fluorescence-switching devices due to fluorescence switching behavior induced by both Fe3+/EDTA and UV/vis light.
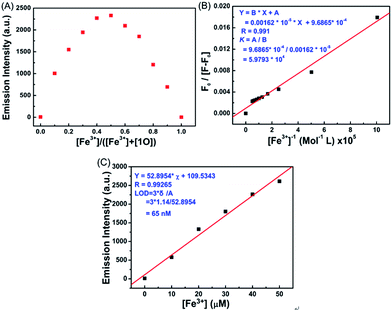
Job's plot analysis was conducted on the fluorescence titration data, as previously reported, to calculate the binding ratio between 1O and Fe3+.34,35 As shown in Fig. 4A, the concentration of 1O′ reached a maximum as the molar fraction of [Fe3+]/([Fe3+] + [1O]) = 0.5, indicating that the complex ratio between Fe3+ and 1O was 1![[thin space (1/6-em)]](https://www.rsc.org/images/entities/char_2009.gif) :
:![[thin space (1/6-em)]](https://www.rsc.org/images/entities/char_2009.gif) 1 in the aqueous acetonitrile solution (v/v = 1
1 in the aqueous acetonitrile solution (v/v = 1![[thin space (1/6-em)]](https://www.rsc.org/images/entities/char_2009.gif) :
:![[thin space (1/6-em)]](https://www.rsc.org/images/entities/char_2009.gif) 1). The association constant (Ka) of 1O with Fe3+ was determined to be 5.9793 × 10⁴ mol L−1 by the Benesi–Hildebrand equation (Fig. 4B),36 and the limit of detection of Fe3+ by 1O was found to be 65 nM (3δ per slope) (Fig. 4C). These results indicate that 1O is highly selective towards Fe3+ and can be used as a fluorescence sensor of Fe3+.
1). The association constant (Ka) of 1O with Fe3+ was determined to be 5.9793 × 10⁴ mol L−1 by the Benesi–Hildebrand equation (Fig. 4B),36 and the limit of detection of Fe3+ by 1O was found to be 65 nM (3δ per slope) (Fig. 4C). These results indicate that 1O is highly selective towards Fe3+ and can be used as a fluorescence sensor of Fe3+.
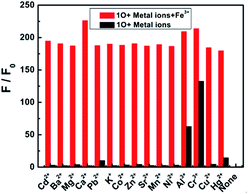
The selectivity of a chemosensor towards the analyte over the other competitive species is a very important parameter to evaluate its sensing performance.37 To further confirm the high selectivity of the 1O sensor towards Fe3+, competitive tests were conducted in the presence of metal ions with similar properties: Cd2+, Ba2+, Mg2+, Ca2+, Pb2+, K+, Co2+, Zn2+, Sr2+, Mn2+, Ni2+, Al3+, Cr3+, Cu2+, and Hg2+. Fig. 5 shows the fluorescence response of 1O to Fe3+ in the aqueous acetonitrile solution as different ions (20.0 equiv.) were added. No obvious interference was observed from other competitive metal ions in aqueous acetonitrile, indicating that 1O was highly selective towards Fe3+. The present sensor was compared with other sensors reported for Fe3+ detection in recent years,38–44 as listed in Table 1. These sensors showed some good physical properties such as lower LOD, association constant, high sensitivity and so on. For the 1O–Fe3+ complex, a moderate performance in all aspects was observed, suggesting that diarylethene 1O could serve as a fluorescence sensor for Fe3+.
Acidichromism
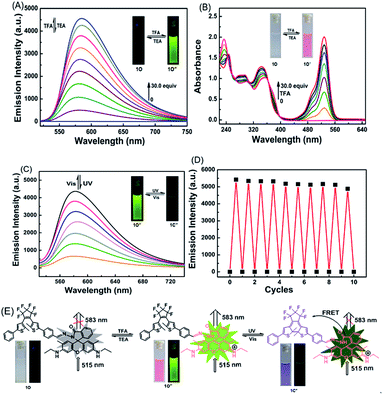
It is particularly well-known that the open ring form of the rhodamine moiety in the presence of a proton emits strong fluorescence in the range of 540–700 nm.45,46 As shown in Fig. 6A and Fig. S5,† the fluorescence intensity of 1O (C = 2.0 × 10⁻⁵ mol L−1) in acetonitrile at 595 nm under excitation at 515 nm was significantly enhanced by TFA due to the formation of an open ring fluorescent rhodamine moiety. The fluorescence intensity reached a maximum in the presence of 30 equiv. TFA and the absolute fluorescent quantum yield of the protonated 1O (1O′′) was determined to be 0.55. The addition of TEA to the 1O′′ solution re-generated the spirolactam form of rhodamine. The fluorescent emission at 583 nm disappeared, and the bright green-yellow fluorescence of the solution diminished (Fig. 6A). Further addition of TFA produced the protonated 1O′′. As shown in Fig. 6B, the spirolactam form of 1O was non-absorbing, whereas the open ring form exhibited a visible absorption band centered at 529 nm and the solution changed from colorless to pink, which could be easily observed with the naked eye. The absorption reached a maximum with 30.0 equiv. TFA and further increasing TFA equiv. caused no significant change in the absorption (Fig. S6†). The reversible modulation of fluorescent emission via alternating additions of TFA and TEA for 10 cycles resulted in no significant decrease in the emission intensity of 1O (Fig. 6D).As discussed above, the color of 1O′′ solution could be changed via alternating irradiating with UV/vis lights. Based on this feature, it can be anticipated that the diarylethene derivatives bearing chemo-responsive function groups offer a promising approach to the design of optical molecular switches.47,48 1O′′ in acetonitrile underwent a photocyclization reaction under irradiation at 297 nm, exhibiting a strong emission peak at 582 nm that significantly decreased with the isomerization from 1O′′ to 1C′′ under visible light irradiation (Fig. 6C). The fluorescence intensity of 1O′′ decreased 85%, accompanied by the fluorescence change from bright green-yellow to dark at the photostationary state, which was a typical behaviour of the FRET mechanism. FRET usually occurs between the open ring rhodamine acylhydrazine (the donor) and the closed-ring diarylethene (the acceptor), resulting in intrinsic photoluminescence properties. The fluorescence color and emission spectrum of 1O′′ can be restored via irradiation with visible light of λ > 500 nm. Fig. 6E shows the switching behavior of 1O induced by the stimulations of proton and UV/vis lights. These results indicate that 1O can be potentially used as a dual-control molecular switch by TFA/TEA and UV/vis light.
Application in a logic circuit
As discussed above, the emission intensity of diarylethene 1O was successfully modulated by either UV/vis light or Fe3+/EDTA stimuli in an aqueous acetonitrile solution (Fig. 7A). Based on this observation, a logic circuit was constructed by four inputs including 297 nm UV light, visible light (λ > 500 nm), Fe3+, and EDTA. The fluorescent emission intensity at 585 nm was set as the output. The output with the emission intensity at 585 nm higher than ca. 2500 was considered as the on state with a Boolean value of 1 and the emission intensity lower than ca. 2500 was regarded as the off state with a Boolean value of 0. As shown in Fig. 7B, the state can be either on (on = 1) or off (off = 0) with different Boolean values. For example, In 1 can be switched to the ‘on’ state with the Boolean value of 1 in response to irradiation at 297 nm and In 2 can be switched on by the irradiation of appropriate visible light (λ > 500 nm). In 3 was 1 with the addition of Fe3+ and In 4 was 1 with the addition of EDTA. The output was on with the Boolean value of 1 under the stimuli of all four inputs. The fluorescent emission intensity at 585 nm below ca. 2500 was set as the initial state where the logic circuit was off. The input strings In 3 = 1, In1 = 0, In 2 = 0, and In 4 = 0 gave an output signal of 1 (on). Table 2 shows all possibilities of the logic strings of the four inputs.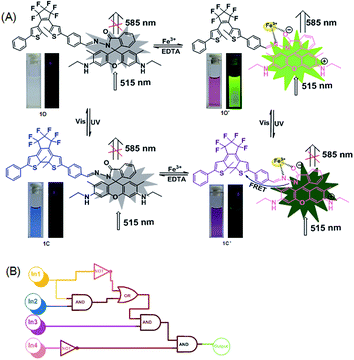 | ||
| Fig. 7 (A) Dual-controlled fluorescent-switching behavior of 1O induced by Fe3+/EDTA and UV/vis light stimuli. (B) The combinational logic circuits equivalent to the truth table given in Table 1: In 1 (297 nm light), In 2 (λ > 500 nm light), In 3 (Fe3+), In 4 (EDTA) and output (fluorescence at 585 nm). | ||
| Input | Output λem = 585 nm | |||
|---|---|---|---|---|
| In 1 (UV light) | In 2 (vis light) | In 3 (Fe3+) | In 4 (EDTA) | |
| 0 | 0 | 0 | 0 | 0 |
| 1 | 0 | 0 | 0 | 0 |
| 0 | 1 | 0 | 0 | 0 |
| 0 | 0 | 1 | 0 | 1 |
| 0 | 0 | 0 | 1 | 0 |
| 1 | 1 | 0 | 0 | 0 |
| 1 | 0 | 1 | 0 | 0 |
| 1 | 0 | 0 | 1 | 0 |
| 0 | 1 | 1 | 0 | 1 |
| 0 | 1 | 0 | 1 | 0 |
| 0 | 0 | 1 | 1 | 0 |
| 1 | 1 | 1 | 0 | 1 |
| 1 | 1 | 0 | 1 | 0 |
| 1 | 0 | 1 | 1 | 0 |
| 0 | 1 | 1 | 1 | 0 |
| 1 | 1 | 1 | 1 | 0 |
Conclusions
In summary, a new diarylethene derivative bearing a rhodamine 6G unit was designed and synthesized. It exhibited highly selective and sensitive turn-on fluorescence and a color change response visible with the naked eye towards Fe3+ in aqueous acetonitrile. The Job's plot of experimental data reveals that a 1![[thin space (1/6-em)]](https://www.rsc.org/images/entities/char_2009.gif) :
:![[thin space (1/6-em)]](https://www.rsc.org/images/entities/char_2009.gif) 1 stoichiometry is the most favorable binding mode between 1O and Fe3+. In addition, the fluorescent emission of the complex can be turned on/off by UV/vis lights irradiation. Based on these results, an integrated digital circuit was constructed with the fluorescent emission intensity at 585 nm as the output.
1 stoichiometry is the most favorable binding mode between 1O and Fe3+. In addition, the fluorescent emission of the complex can be turned on/off by UV/vis lights irradiation. Based on these results, an integrated digital circuit was constructed with the fluorescent emission intensity at 585 nm as the output.
Acknowledgements
The authors are grateful for the financial support received from the National Natural Science Foundation of China (21662015, 21363009, 221362013, 51373072), the Project of Jiangxi Academic and Technological leaders (20142BCB22010), the Project of the Science Funds of the Jiangxi Education Office (KJLD13069), and the innovation fund of graduate students (YC2016-X02).Notes and references
- E. Erdema, N. Karapinarb and R. Donata, J. Colloid Interface Sci., 2004, 280, 309–314 CrossRef PubMed.
- D. Wang, X. Y. Xiang, X. L. Yang, X. D. Wang, Y. L. Guo, W. S. Liu and W. W. Qin, Sens. Actuators, B, 2014, 201, 246–254 CrossRef CAS.
- W. Sun, D. Y. Hu, Z. B. Wu, B. A. Song and S. Yang, Chin. J. Org. Chem., 2011, 31, 997–1010 CAS.
- G. J. Park, I. H. Hwang, E. J. Song, H. Kim and C. Kim, Tetrahedron, 2014, 70, 2822–2828 CrossRef CAS.
- K. Rurack, Spectrochim. Acta, Part A, 2001, 57, 2161–2195 CrossRef CAS.
- J. F. Zhang, Y. Zhou, J. Yoon and J. S. Kim, Chem. Soc. Rev., 2011, 40, 3416–3429 RSC.
- K. P. Carter, A. M. Young and A. E. Palmer, Chem. Rev., 2014, 114, 4564–4601 CrossRef CAS PubMed.
- P. S. Hardikar, S. M. Joshi, D. S. Bhat, D. A. Raut, P. A. Katre, H. G. Lubree and C. S. Yajnik, Diabetes Care, 2012, 35, 797–802 CrossRef CAS PubMed.
- J. Comin-Colet, M. Lainscak, K. Dickstein, G. S. Filippatos, P. Johnson, T. F. Lüscher, C. Mori, R. Willenheimenr, P. Poniknowski and S. D. Anker, Eur. Heart J., 2013, 34, 30–38 CrossRef CAS PubMed.
- A. Malek, T. Thomas and E. Prasad, ACS Sustainable Chem. Eng., 2016, 4, 3497–3503 CrossRef CAS.
- T. Ganz, Blood, 2003, 102, 783–788 CrossRef CAS PubMed.
- A. P. De Silva, H. Q. N. Gunaratne, T. Gunnlaugsson, A. J. Huxley, C. P. McCoy, J. T. Rademacher and T. E. Rice, Chem. Rev., 1997, 97, 1515–1566 CrossRef CAS PubMed.
- X. Y. Qu, Q. Liu, X. N. Ji, H. C. Chen, Z. K. Zhou and Z. Shen, Chem. Commun., 2012, 48, 4600–4602 RSC.
- C. Wolf, X. Mei and H. K. Rokadia, Tetrahedron Lett., 2004, 45, 7867–7871 CrossRef CAS.
- J. Zhang, Q. Zou and H. Tian, Adv. Mater., 2013, 25, 378–399 CrossRef CAS PubMed.
- A. Toriumi, S. Kawata and M. Gu, Opt. Lett., 1998, 23, 1924–1926 CrossRef CAS PubMed.
- M. Irie, Chem. Rev., 2000, 100, 1685–1716 CrossRef CAS PubMed.
- K. Y. Liu, Y. Wen, T. Shi, Y. Li, F. Y. Li, Y. L. Zhao, C. H. Huang and T. Yi, Chem. Commun., 2014, 50, 9141–9144 RSC.
- G. M. Liao, C. H. Zheng, D. D. Xue, C. B. Fan, G. Liu and S. Z. Pu, RSC Adv., 2016, 6, 34748–34753 RSC.
- S. H. Jing, C. H. Zheng, S. Z. Pu, C. B. Fan and G. Liu, Dyes Pigm., 2014, 107, 38–44 CrossRef CAS.
- S. Pal, N. Chatterjee and P. K. Bharadwaj, RSC Adv., 2014, 4, 26585–26620 RSC.
- X. Zeng, L. Dong, C. Wu, L. Mu, S. F. Xue and Z. Tao, Sens. Actuators, B, 2009, 141, 506–510 CrossRef CAS.
- M. Morimoto and M. Irie, Chem. Commun., 2005, 31, 3895–3905 RSC.
- S. Yamamoto, K. Matsuda and M. Irie, Org. Lett., 2003, 5, 1769–1772 CrossRef CAS PubMed.
- R. J. Wang, S. Z. Pu, G. Liu and S. Q. Cui, Beilstein J. Org. Chem., 2012, 8, 1018–1026 CrossRef CAS PubMed.
- Z. Wang, D. Wu, G. Wu, N. Yang and A. Wu, J. Hazard. Mater., 2013, 244, 621–627 CrossRef PubMed.
- D. Wu, W. Huang, C. Duan, Z. Lin and Q. Meng, Inorg. Chem., 2007, 46, 1538–1540 CrossRef CAS PubMed.
- Z. X. Li, L. Y. Liao, W. Sun, C. H. Xu, C. Zhang, C. J. Fang and C. H. Yan, J. Phys. Chem. C, 2008, 112, 5190–5196 CAS.
- S. Kawai, T. Nakashima, K. Atsumi, T. Sakai, M. Harigai, Y. Imamoto and T. Kawai, Chem. Mater., 2007, 19, 3479–3483 CrossRef CAS.
- M. Morimoto and M. Irie, Chem.–Eur. J., 2006, 12, 4275–4282 CrossRef CAS PubMed.
- T. Nakashima, K. Miyamura, T. Sakai and T. Kawai, Chem.–Eur. J., 2009, 15, 1977–1984 CrossRef CAS PubMed.
- M. Irie, T. Lifka, S. Kobatake and N. Kato, J. Am. Chem. Soc., 2000, 122, 4871–4876 CrossRef CAS.
- M. J. Yuan, Y. L. Li, J. B. Li, C. H. Li, X. F. Liu, J. Lv, J. L. Xu, H. B. Liu, S. Wang and D. B. Zhu, Org. Lett., 2007, 9, 2313–2316 CrossRef CAS PubMed.
- X. B. Yang, B. X. Yang, J. F. Ge, Y. J. Xu, Q. F. Xu, J. Liang and J. M. Lu, Org. Lett., 2011, 13, 2710–2713 CrossRef CAS PubMed.
- R. Kato, S. Nishizawa, T. Hayashita and N. Teramae, Tetrahedron Lett., 2001, 42, 5053–5056 CrossRef CAS.
- H. A. Benesi and J. H. Hildebrand, J. Am. Chem. Soc., 1949, 71, 2703–2707 CrossRef CAS.
- M. Saleem and K. H. Lee, RSC Adv., 2015, 5, 72150–72287 RSC.
- S. Li, D. Zhang, X. Y. Xie, S. G. Ma, Y. Liu, Z. H. Xu, Y. F. Gao and Y. Ye, Sens. Actuators, B, 2016, 224, 661–667 CrossRef CAS.
- C. C. Wang, Y. Q. Liu, J. Y. Cheng, J. H. Song, Y. F. Zhao and Y. Ye, J. Lumin., 2015, 157, 143–148 CrossRef CAS.
- X. F. Bao, J. X. Shi, X. M. Nie, B. J. Zhou, X. L. Wang, L. Y. Zhang, H. Liao and T. Pang, Bioorg. Med. Chem., 2014, 22, 4826–4835 CrossRef CAS PubMed.
- C. C. Wang, D. Zhang, X. Y. Huang, P. G. Ding, Z. J. Wang, Y. F. Zhao and Y. Ye, Talanta, 2014, 128, 69–74 CrossRef CAS PubMed.
- M. M. Chai, D. Zhang, M. Wang, H. J. Hong, Y. Ye and Y. F. Zhao, Sens. Actuators, B, 2012, 174, 231–236 CrossRef CAS.
- Y. Y. Du, M. Chen, Y. X. Zhang, F. Luo, C. Y. He, M. J. Li and X. Chen, Talanta, 2013, 106, 261–265 CrossRef CAS PubMed.
- V. Bhalla, N. Sharma, N. Kumar and M. Kumar, Sens. Actuators, B, 2013, 178, 228–232 CrossRef CAS.
- K. Ghosh, T. Sarkar, A. Majumdar, S. K. Mandal and A. R. Khuda-Bukhsh, Anal. Methods, 2014, 6, 2648–2654 RSC.
- S. J. Lim, J. Seo and S. Y. Park, J. Am. Chem. Soc., 2006, 128, 14542–14547 CrossRef CAS PubMed.
- L. N. Lucas, J. J. D. de Jong, J. H. Van Esch, R. M. Kellogg and B. L. Feringa, Eur. J. Org. Chem., 2003, 2003, 155–166 CrossRef.
- W. R. Algar, M. Massey and U. J. Krull, TrAC, Trends Anal. Chem., 2009, 28, 292–306 CrossRef.
Footnote |
| † Electronic supplementary information (ESI) available. See DOI: 10.1039/c7ra04728b |
| This journal is © The Royal Society of Chemistry 2017 |


