 Open Access Article
Synthesis of phosphonic acid ring-substituted polyanilines via direct phosphonation to polymer main chains†
Toru Amaya *a,
Izumi Kurataa,
Yuhi Inada‡
 b,
Tomohiro Hataia and
Toshikazu Hiraob
aDepartment of Applied Chemistry, Graduate School of Engineering, Osaka University, Yamada-oka, Suita, Osaka 565-0871, Japan. E-mail: amaya@chem.eng.osaka-u.ac.jp
bThe Institute of Scientific and Industrial Research, Osaka University, Mihoga-oka, Ibaraki, Osaka 567-0047, Japan
First published on 11th August 2017
Abstract
Phosphonic acid ring-substituted polyanilines (PhosPANIs) were synthesized via reductive phosphonation of pernigraniline (a fully oxidized form of PANI) with P(OEt)3 and subsequent hydrolysis. The carbon–phosphorus bond formation was suggested from 31P NMR. This is the first example of direct phosphonation of PANI. The formal substitution ratio of the phosphonate to total number of phenyl rings in the polymer after the phosphonation reaction was up to 52%. The repetition of the phosphonation reaction procedure gave the diethyl PhosPANI (EtPhosPANI) with 73% substitution ratio. Hydrolysis of EtPhosPANIs afforded the desired PhosPANIs. The self-doping of the obtained PhosPANIs was clearly exhibited by ESR, XPS and UV-vis-NIR absorption spectroscopy. The drop-cast films of PhosPANIs showed electrical conductive properties with a level suitable for charge dissipation materials. The developed synthetic approach is considered to be valuable as a practical method for phosphonic acid self-doped conductive PANIs.
1. Introduction
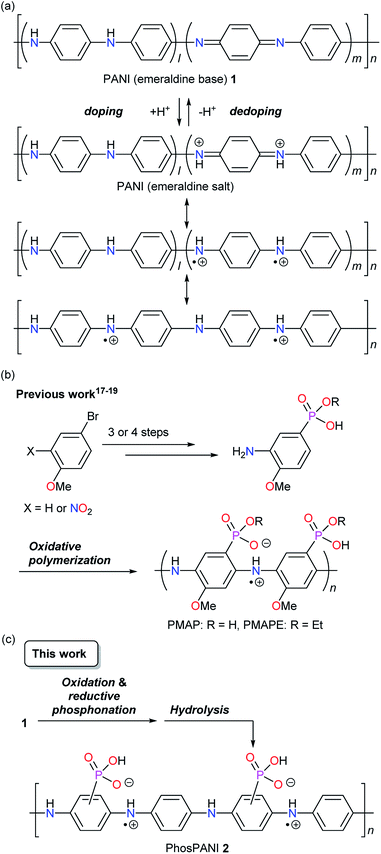
Polyanilines (PANIs) are widely known as some of the useful conductive polymers because of their availability and practical applicability.1–7 Unlike the other representative conductive polymers such as polyacetylenes, polythiophenes and polypyrroles, the electrical conductive properties of PANIs are induced by simple protonation doping of a PANI emeraldine base.1 It is believed that the conductive polysemiquinone radical cationic (polaronic) state is formed via reorganization of the electronic structure (Scheme 1a).1 On the other hand, PANIs cannot exhibit sufficient conductive properties only under basic conditions but also when acid doping is not sufficient. PANIs bearing covalently bonded acid moieties on the backbone can be doped without external dopants.8,9 A sulfonated PANI was demonstrated by Epstein et al. in 1990 as such a self-doped conductive PANI.10 The strong self-doping provides a property of resistance to a base. It has been reported that highly sulfonated PANI retains electrical conductive property under basic conditions (up to pH 12).11 Concerning the synthesis, there are mainly two strategies to introduce an acid moiety. One is polymerization of monomer possessing an acid moiety.12–19 The other is post-synthetic introduction of acid moieties to PANIs.10,11,20–27 The former may make the polymer design more flexible. However, the latter is considered to be advantageous in terms of the number of synthetic steps and the synthetic cost. As post-modifications to synthesize PANIs bearing sulfonic acid, both electrophilic10,11,20–23 and nucleophilic24–27 (accompanying the reduction of the quinoid moiety) substitution reactions have been reported.On the other hand, we have developed self-doped conducting PANIs, poly(2-methoxyaniline-5-phosphonic acid) (PMAP)17,19 and poly(2-methoxyaniline-5-phosphonic acid monoethyl ester) (PMAPE),18 which have phosphonic acid and phosphonic acid monoethyl ester, respectively, directly bonded to the main chain of PANI (Scheme 1b).28 They were synthesized by oxidative polymerization of the corresponding monomers. These are the first examples of PANI where phosphonic acid or phosphonic acid monoester directly attaches to the backbone. Differing from sulfonic acid, two acidic protons are available in phosphonic acid. The second acid moiety not used for doping would provide the features such as acid/base complexation (or salt formation) and resistance to base. The conductive property of various amine complexes of PMAP was investigated and the charge dissipation property of some PMAP/amine complexes in the electron-beam lithography was reported.29 We also found that PMAP exhibits deprotonation-induced efficient delocalization of polaron.30 Recently, salt formation of PMAP with didodecyldimethylammonium bromide was performed to give an organic solvent soluble self-doped PANI.31
The PANIs bearing phosphonic acid have attractive and unique properties as described above. On the other hand, the total synthetic steps of PMAP are four or five, which takes a time and cost. In this context, we focus on the phosphonation of PANI to introduce the phosphonic acid moiety because such methods seem to be one of the most practical ways to solve the above issues. However, direct phosphonation of PANIs has not been reported before. Herein, we describe the synthesis of a phosphonic acid ring-substituted PANI (PhosPANI) based on the reductive phosphonation of pernigraniline (a fully oxidized form of PANI) with P(OEt)3 and the subsequent hydrolysis (Scheme 1c). Its self-doping function and conductive property are also described.
2. Experimental section
2.1 General
All reagents were purchased from commercial sources. PANI was purchased from Aldrich (Mw 10![[thin space (1/6-em)]](https://www.rsc.org/images/entities/char_2009.gif) 000). Anhydrous MeCN was prepared using a Glass Contour Solvent Dispensing System. Unless otherwise noted, they were used without further purification. Preparation of PMAP is reported in our previous papers.17,19 Elementary analyses were performed on a JSCIENCE LAB Co., Ltd MICRO CORDER (JM-10). ICP-AES analysis was carried out on a SHIMADZU ICPS-8100. Thermogravimetric analysis (TGA) were performed on a Rigaku TG8120 under N2 purge (100 mL min−1) at heating rate of 10 °C min−1. ESR spectra were taken on a Bruker ER 070 spectrometer. XPS measurements were performed on a JEOL JPS-9010MC spectrometer. The binding energies were referenced to Ag 3d5/2 line (368.2 eV).32 UV-vis-NIR absorption spectra were recorded on a JASCO V-670 spectrometer. NMR spectra were recorded on a JEOL JNM-ECP 400 or Bruker Avance III spectrometer. Chemical shifts were reported in ppm on the δ scale relative to a residual solvent (DMSO-d6: δ 2.50 for 1H NMR and δ 39.52 for 13C NMR; CD2Cl2: δ 5.32 for 1H NMR and δ 53.80 for 13C NMR) as an internal standard. An 85% aqueous phosphoric acid solution (δ 0.00, sealed capillary) was used as an external standard for 31P NMR. Infrared spectra were obtained with a JASCO FT/IR-6200 spectrometer. Mass spectra were recorded on a JEOL JMS-700 spectrometer using the fast atom bombardment (FAB).
000). Anhydrous MeCN was prepared using a Glass Contour Solvent Dispensing System. Unless otherwise noted, they were used without further purification. Preparation of PMAP is reported in our previous papers.17,19 Elementary analyses were performed on a JSCIENCE LAB Co., Ltd MICRO CORDER (JM-10). ICP-AES analysis was carried out on a SHIMADZU ICPS-8100. Thermogravimetric analysis (TGA) were performed on a Rigaku TG8120 under N2 purge (100 mL min−1) at heating rate of 10 °C min−1. ESR spectra were taken on a Bruker ER 070 spectrometer. XPS measurements were performed on a JEOL JPS-9010MC spectrometer. The binding energies were referenced to Ag 3d5/2 line (368.2 eV).32 UV-vis-NIR absorption spectra were recorded on a JASCO V-670 spectrometer. NMR spectra were recorded on a JEOL JNM-ECP 400 or Bruker Avance III spectrometer. Chemical shifts were reported in ppm on the δ scale relative to a residual solvent (DMSO-d6: δ 2.50 for 1H NMR and δ 39.52 for 13C NMR; CD2Cl2: δ 5.32 for 1H NMR and δ 53.80 for 13C NMR) as an internal standard. An 85% aqueous phosphoric acid solution (δ 0.00, sealed capillary) was used as an external standard for 31P NMR. Infrared spectra were obtained with a JASCO FT/IR-6200 spectrometer. Mass spectra were recorded on a JEOL JMS-700 spectrometer using the fast atom bombardment (FAB).
2.2 Calculation for the formal substitution ratio of phosphonate
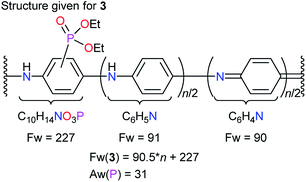
Given the structure of diethylphosphonated PANI (EtPhosPANI) 3 (Scheme 2) as described in Fig. 1, formula weight (Fw) is calculated to be “Fw(3) = 90.5n + 227”. Here, the precise ratios of quinoid and benzenoid moieties are unknown, but the absorption spectra of 3 showed a kind of typical ones for half-oxidized form of PANIs (this is described in Section 3.1). For unsubstituted aniline unit, it is assumed here that there are the same number of quinoid and benzenoid moieties in terms of averaging. The equation on the ratio of phosphorus is| Aw(P)/Fw(3) = P(wt)/3(wt). | (1) |
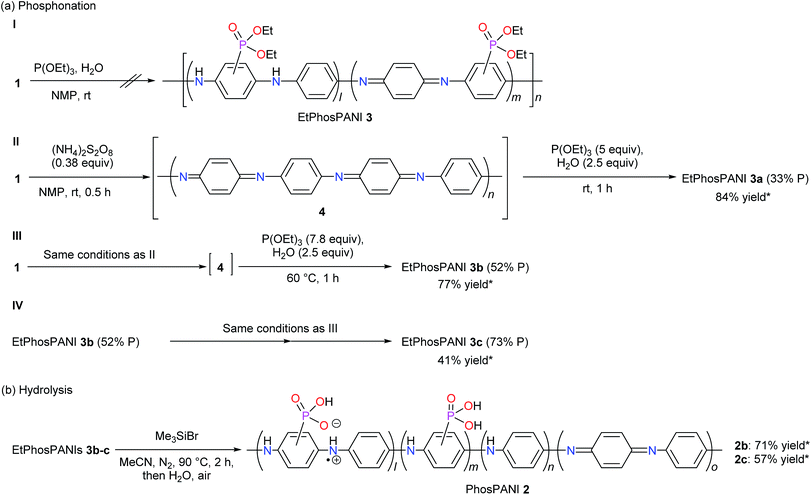 | ||
| Scheme 2 (a) Phosphonation reaction to produce EtPhosPANIs 3. (b) Hydrolysis of EtPhosPANIs 3 to produce PhosPANIs 2. *Yield [%] = (mole of product based on an aniline unit)/(mole of substrate based on an aniline unit) × 100, where mole of 3 is calculated using the molecular weight of 3 estimated from the structure given in Fig. 1. To calculate the yield of 2 formally, the structure of 2 is given as a compound that ethyl group in 3 in Fig. 1 is replaced with proton. | ||
Here, Aw(P), P(wt) and 3(wt) are defined as atomic weight of phosphorus, weight of the phosphorus and the total weight of 3, respectively. Aw(P) = 31. P(wt) is obtained by the ICP-AES analysis. Substituting each value into eqn (1) and solving eqn (1) find the value of “n”. Formal substitution ratio of phosphonate to the total number of phenyl rings in the polymer 3 (X%) can be calculated to be
| X = [1/(n + 1)] × 100. | (2) |
Solving eqn (2) finds the value of “X”. Using thus-calculated X, EtPhosPANI 3 is described as EtPhosPANI 3 (X% P).
| n = [9.83/(14.91 × 50/1000) × 31 − 227]/90.5 = 2.0, X = 33 |
| n = [24.79/(24.78 × 100/1000) × 31 − 227]/90.5 = 0.92, X = 52 |
| n = [17.08/(20.36 × 100/1000) × 31 − 227]/90.5 = 0.37, X = 73 |
2.3 Synthesis
2.4 ICP-AES analysis
The weighed sample was diluted with concentrated nitric acid in a measuring flask. Quantification was carried out using the calibration curve, which was prepared using four points of the diluted phosphorus standard solution (0, 5, 10, 50 ppm of P).2.5 ESR measurements
To ESR tubes was added a solid of PhosPANIs 2b and 2c, and PMAP under air. The spectra were recorded at room temperature. The g-values were calculated based on calibration using 1,3-bisdiphenylene-2-phenylallyl (BDPA, g = 2.002756) as an external standard.2.6 X-ray photoelectron spectroscopy (XPS) measurements
The sample film was prepared from a deionized water/THF = 2/1 (v/v) suspension of PhosPANI 2b. 13 μL of the suspension was dropped onto a piece of clean silver plate before drying it under reduced pressure (40 °C through overnight). After the sample plate was fixed onto a sample holder, it was put into an ultrahigh-vacuum chamber (1–2 × 10⁻⁶ Pa) at room temperature. The AlKα line (1486.6 eV) was chosen as an X-ray source. The tube current was 25.0 mA, the tube voltage was 12.0 kV and the pass energy was 50 eV. The surface of the sample film was cleaned by argon-ion etching for 30 s before recording the spectra. During the etching process, the pressure of argon gas was kept to be ∼4 × 10⁻⁴ Pa. The accelerating voltage of the ion gun was 400 V and the current was 6.4 mA. In addition to N 1 s spectra, Ag 3d spectra were also measured as a reference. The spectra were accumulated nine times (for N 1s) or eight times (for Ag 3d). The obtained spectra were analyzed using an analysis software (Light Stone, OriginPro 2015J Student Version 64Bit). For quantitative analysis, the peak intensity (counts/sec) was corrected using appropriate transmission values supplied by the instrument manufacturer. The accumulated spectra were smoothed by Savitzky–Golay method. The points of window were 50 (for N 1s) or 30 (for Ag 3d), boundary condition was none and polynomial order was 2. After the spectra were compensated by subtracting linear function to remove their gradient, the background of the spectra was subtracted using Shirley method. In deconvoluting the spectra, they were fitted with Voigt functions, where Lorentzian width was fixed to 0.25 eV.2.7 Absorption spectrum measurements
A glass substrate (26 × 13 mm) was ultrasonically washed with solvents in order of neutral detergent, desalted water, acetone, ethanol and desalted water twice. The glass substrate was cleaned by UV-O3 treatment (12 W low pressure mercury lamp, flowing air) for 1 min after drying. The suspension of PhosPANIs 2 (1 mg) in 0.1 mL of methanolic aqueous NH3 solution (MeOH/H2O/0.15 M aqueous NH3 solution = 1/1/1 v/v) was dropped onto the glass substrate, which was dried at 100 °C for 3 min. The obtained films were used for the absorption measurements.2.8 Sheet resistance measurements
An interdigitated array platinum electrode composed of 65 pairs (width between electrodes = 3 μm, length = 2.4 mm) [IDA electrode (Pt) from ALS Co., Ltd, see also http://www.als-japan.com/support-ida.html] was used to measure the sheet resistance by a direct-current method. The suspension of PhosPANIs 2 (10 g L−1) in methanolic aqueous NH3 solution (MeOH/H2O/0.15 M aqueous NH3 solution = 1/1/1 v/v) was dropped onto the electrode, which was dried at 100 °C for 2 min. The measurements of the electrical resistance for a two-probe method were conducted under environmental conditions.3. Results and discussion
3.1 Synthesis
According to several reports on the nucleophilic substitution of PANI,24–27 PANI (emeraldine base) 1 was treated with an excess amount of P(OEt)3 as a nucleophile in the presence of H2O in NMP at room temperature. The reaction was followed with UV-vis-NIR absorption spectroscopy by taking a small amount of the sample from the reaction mixture. However, no reaction was suggested (Scheme 2a-I). To improve the electrophilicity of PANI, PANI (emeraldine base) 1 was oxidized by (NH4)2S2O8 in NMP to give 4. Then, P(OEt)3 (5 equivalents to the aniline unit) and H2O were added to the mixture at room temperature (Scheme 2a-II). The reaction was also followed by UV-vis-NIR absorption spectroscopy (Fig. S1†). After the treatment of PANI (emeraldine base) with (NH4)2S2O8, a typical spectrum for PANI (oxidized form) 4 with a peak around 550 nm appeared (Fig. S1†).33 The addition of P(OEt)3 to the mixture induced the spectral change to give a peak at 619 nm, which is assignable to the charge transfer band for PANI (emeraldine base).33 The reaction mixture was poured into H2O after checking that there were no more changes in the spectrum. The resultant precipitate was collected and washed with an ammonia solution for dedoping. The ICP-AES analysis indicated that the formal substitution ratio of phosphonate to the total number of phenyl rings in the polymer is estimated to be approximately 33%. The thus-obtained diethylphosphonated PANIs 3 are described as EtPhosPANIs 3 (X% P, X = the formal substitution ratio of phosphonate). The yield of the EtPhosPANI 3a (33% P) was 84% (Scheme 2a-II). The chemical shift of phosphorus in 31P NMR for the obtained compound appeared at 17.3–20.3 ppm, which is in a range for arylphosphonates (Fig. S2†). Thus, carbon–phosphorus bond formation was confirmed. 1H NMR also showed the presence of the ethyl group derived from the ethylphosphonate (Fig. S3†). Proposed mechanistic pathway of the reaction is shown in Scheme S1a.†The equivalents of P(OEt)3 and temperature were investigated to improve the substitution ratio of phosphonate (Table S1†). Use of 0.75 equivalents of P(OEt)3 resulted in 9% substitution ratio (Table S1,† entry 1). The more equivalents of P(OEt)3, the more substitution ratio was attained. Raise in the temperature to 60 °C induced the substitution ratio as well. The optimized conditions are use of 7.8 equivalents of P(OEt)3 at 60 °C, where the substitution ratio and yield of EtPhosPANI 3b (52% P) were 52% and 77%, respectively (Scheme 2a-III and entry 6 in Table S1†). Gram scale synthesis was possible. Instead of P(OEt)3, use of HPO(OEt)2 did not afford EtPhosPANI 3.
Further phosphonation of EtPhosPANI 3b (52% P) was carried out by repeating the procedure consisted of the oxidation and reductive phosphonation to give EtPhosPANI 3c (73% P) (Scheme 2a-IV). Thus, the substitution ratio increased up to 73%.
Hydrolysis of EtPhosPANIs 3b (52% P) and 3c (73% P) was performed by treating with Me3SiBr, followed by pouring into H2O to give a precipitate (Scheme 2b).34 Washing the precipitate with Et2O gave the corresponding PhosPANIs 2b and 2c as a black solid. The completing of the hydrolysis was confirmed with the disappearance of the peaks for ethyl groups in the 1H NMR spectra. PhosPANIs 2b and 2c were comparatively soluble in aqueous basic solution, but their solubility was low in organic solvents and neutral to acidic aqueous solutions.
To collect the information for the substitution reaction, the model reaction using N1,N4-diphenylbenzene-1,4-diamine (5) was carried out. In the similar conditions to synthesize 3, mono-diethylphosphonated product 6 and bis-diethylphosphonated product 7 were obtained in 35% and 22% yields, respectively (Scheme 3). The oxidative poly- or oligomerization of 5 was also suggested in this reaction, resulting in the low mass balance. Di-substituted compound 7 is considered to be formed via double 1,4-addition and the subsequent aromatization by aerobic oxidation (Scheme S1b†). The similar reported reaction using 1,4-benzoquinone supports the reaction path.35 Partial di-substitution in the obtained EtPhosPANIs 3 is expected from these results. The chemical shift of phosphorus in 31P NMR of 6 and 7 were 20.1 and 18.8 ppm, respectively. These data support the carbon–phosphorus bond in EtPhosPANIs 3.
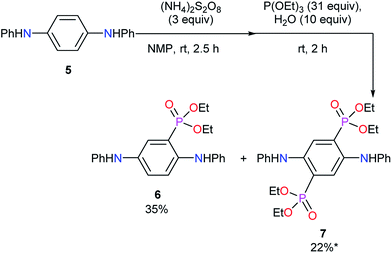 | ||
| Scheme 3 Model reaction for phosphonation reaction using diamine 5. *Including a small amount of impurity. | ||
3.2 ESR properties
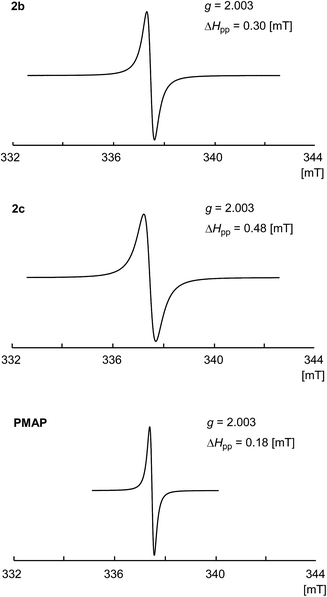
The solid state ESR spectra of the obtained PhosPANIs 2b and 2c, and PMAP are shown in Fig. 2. Single resonance lines centered on around g = 2.003 without hyperfine coupling were observed for 2b and 2c, and PMAP. The obtained spectra are characteristic of related conducting PANIs,36 indicating that their self-doping. The peak-to-peak line width ΔHpp has been used to estimate the level of delocalization of electrical charge carrier in PANI, where the smaller ΔHpp shows more efficient delocalization.37 The ΔHpp for 2b and 2c was 0.30 and 0.48 mT, respectively, which are larger than that of the solid state ESR for PMAP (ΔHpp = 0.18 mT). These results suggest that the polaron of PhosPANIs 2b and 2c is less delocalized than that of PMAP.3.3 Doping efficiency
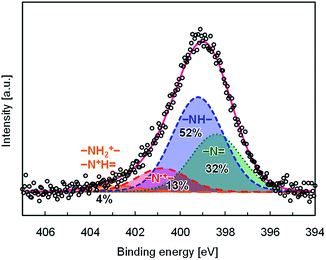
Doping efficiency of PhosPANI 2b was investigated by the XPS experiment (Fig. 3). The N 1s core-level spectrum was fitted with four components, which were attributed to protonated (–NH2+–, –N+H![[double bond, length as m-dash]](https://www.rsc.org/images/entities/char_e001.gif) ), radical cation (–N˙+–), neutral amine (–NH–) and imine (–N
), radical cation (–N˙+–), neutral amine (–NH–) and imine (–N![[double bond, length as m-dash]](https://www.rsc.org/images/entities/char_e001.gif) ) nitrogen sites at 402.4, 400.4, 398.8 and 398.0 eV, respectively. The peak positions were comparable to the previously reported ones.38 The area ratio for the nitrogen atoms is summarized in Fig. 3. The doping level corresponds to the area ratio for the radical cation nitrogen (–N˙+–) sites, which was 13%. This value is lower than that for PMAP.28 This is consistent with the results of the ESR experiments. One of the major reasons is that the substitution ratio of the phosphonic acid moiety is low.
) nitrogen sites at 402.4, 400.4, 398.8 and 398.0 eV, respectively. The peak positions were comparable to the previously reported ones.38 The area ratio for the nitrogen atoms is summarized in Fig. 3. The doping level corresponds to the area ratio for the radical cation nitrogen (–N˙+–) sites, which was 13%. This value is lower than that for PMAP.28 This is consistent with the results of the ESR experiments. One of the major reasons is that the substitution ratio of the phosphonic acid moiety is low.
3.4 Electronic absorption
Electronic absorptions for the films of PhosPANIs 2 were investigated (Fig. 4). The film of 2b was formed on a glass substrate by drop-cast of aqueous NH3/MeOH suspension of 2b followed by annealing at 100 °C for 2 min. The absorption spectrum of the thus-obtained film of 2b showed a broad peak around 450 nm assigned as a polaron band39 and broad one from 600 nm (Fig. 4a). The broad absorption from 600 nm is considered to include CT transition (around 600 nm), further localized polaron band (around 750 nm)39 and free carrier tail (>around 1000 nm).39 Absorptions of polaron and CT transition indicate the doped and de-doped states, respectively. Thus, both self-doped and de-doped moieties seem to be present in PhosPANI 2b. Despite the use of basic aqueous suspension of 2b to form the film (absorption spectra for the suspension clearly showed the complete de-doping, see Fig. S4†), the reason that the complete de-doping was not observed for the film can be explained by removal of NH3 under annealing conditions. Fig. 4b shows the spectra of similarly prepared films for 2c. The spectrum for 2c exhibits the small broad peak for polaron (around 420 nm) and large and broad peak for the CT transition and further localized polaron band (around 700 nm), suggesting the partial doping and less delocalization of polaron. This is consistent with the result of the large ΔHpp in ESR spectrum of 2c.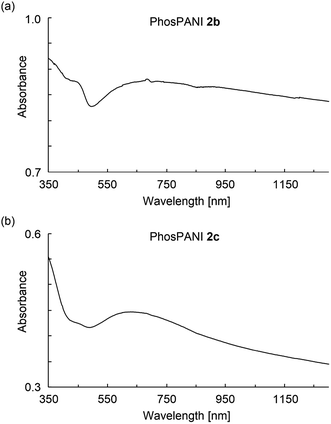 | ||
| Fig. 4 UV-vis-NIR absorption spectra for the drop-cast films of the aqueous NH3/MeOH suspension of (a) PhosPANIs 2b and (b) 2c. | ||
3.5 Electrical conductive property
Electrical conductive properties of PhosPANIs 2b and 2c were investigated in terms of sheet resistance of the drop-cast film. Sheet resistance of PMAP was also measured for comparison. An interdigitated array platinum electrode was used to measure the sheet resistance by a direct-current method. The ca. 10 g L−1 aqueous NH3/MeOH suspensions of PhosPANIs 2b and 2c were drop-casted on the electrode. The sheet resistances of PhosPANIs 2b and 2c, and PMAP were 3.6 × 10⁹, 4.0 × 10¹⁰ and 2.2 × 10⁷ Ω per square at room temperature, respectively. The magnitude of the sheet resistance is a level for charge dissipation materials.40 The lower conductive property of 2c was observed despite the more substituted ratio of phosphonic acid moiety. However, it is consistent with the results of the ESR and absorption spectra. The conductive property of PMAP is two order of magnitude higher than that of 2b, which might be due to the more efficient doping in PMAP. The conductive properties of 2b and 2c seem to be lower than the externally doped PANI with phosphonic acid.41 It might be considered that introduction of the substituent induces twist of the main chain of PANI and the effective conjugation length becomes short.4. Conclusions
Phosphonic acid ring-substituted PANIs, PhosPANIs 2, were synthesized via reductive phosphonation of pernigraniline (fully oxidized form of PANI) with P(OEt)3 and the subsequent hydrolysis. This is the first example of the direct phosphonation of PANI. The formal substitution ratio of the phosphonate to the total number of phenyl rings in the polymer after the phosphonation reaction was up to 52%. The repetition of the phosphonation reaction procedure gave EtPhosPANI 3c (73% P) with 73% substitution ratio. Hydrolysis of EtPhosPANIs 3 afforded the desired PhosPANIs 2. The self-doping of the obtained PhosPANIs 2 was clearly exhibited by ESR, XPS and UV-vis-NIR absorption spectroscopy. The drop-casted films of PhosPANIs 2 showed electrical conductive property with a level for charge dissipation materials. The developed synthetic approach is considered to be valuable as a practical method for phosphonic acid self-doped conductive PANIs.Acknowledgements
We thank Dr Ichiro Hisaki for the experiments of TGA. We thank the members of the Comprehensive Analysis Center, ISIR, Osaka University, for ICP-AES and XPS measurements. This work was partially supported by Matching Planner Program (MP27115658604) from Japan Science and Technology Agency (JST).Notes and references
- A. G. MacDiarmid, Angew. Chem., Int. Ed., 2001, 40, 2581–2590 CrossRef CAS PubMed.
- K. Lee, S. Cho, S. H. Park, A. J. Heeger, C.-W. Lee and S.-H. Lee, Nature, 2006, 441, 65–68 CrossRef CAS PubMed.
- P. Lin and F. Yan, Adv. Mater., 2012, 24, 34–51 CrossRef CAS PubMed.
- G. Ćirić-Marjanović, Synth. Met., 2013, 177, 1–47 CrossRef.
- J. F. Mike and J. L. Lutkenhaus, ACS Macro Lett., 2013, 2, 839–844 CrossRef CAS.
- P. P. Deshpande, N. G. Jadhav, V. J. Gelling and D. Sazou, J. Coat. Technol. Res., 2014, 11, 473–494 CrossRef CAS.
- L. Xu, L. Cheng, C. Wang, R. Peng and Z. Liu, Polym. Chem., 2014, 5, 1573–1580 RSC.
- A. Malinauskas, J. Power Sources, 2004, 126, 214–220 CrossRef CAS.
- M. S. Freund and B. Deore, Self-Doped Conducting Polymers, John Wiley & Sons, Ltd., New York, 2007 Search PubMed.
- J. Yue and A. J. Epstein, J. Am. Chem. Soc., 1990, 112, 2800–2801 CrossRef CAS.
- X.-L. Wei, Y. Z. Wang, S. M. Long, C. Bobeczko and A. J. Epstein, J. Am. Chem. Soc., 1996, 118, 2545–2555 CrossRef CAS.
- H. S. O. Chan, S. C. Ng, A. S. Sim, K. L. Tan and B. T. G. Tan, Macromolecules, 1992, 25, 6029–6034 CrossRef CAS.
- S. C. Ng, H. S. O. Chan, H. H. Huan and P. K. H. Ho, J. Chem. Soc., Chem. Commun., 1995, 1327–1328 RSC.
- S. Shimizu, T. Saitoh, M. Uzawa, M. Yuasa, K. Yano, T. Maruyama and K. Watanabe, Synth. Met., 1997, 85, 1337–1338 CrossRef CAS.
- H. S. O. Chan, A. J. Neuendorf, S.-C. Ng, P. M. L. Wong and D. J. Young, Chem. Commun., 1998, 1327–1328 RSC.
- M. Nicolas, B. Fabre, G. Marchand and J. Simonet, Eur. J. Org. Chem., 2000, 1703–1710 CrossRef CAS.
- T. Amaya, Y. Abe, Y. Inada and T. Hirao, Tetrahedron Lett., 2014, 55, 3976–3978 CrossRef CAS.
- T. Amaya, Y. Abe, Y. Inada and T. Hirao, Synth. Met., 2014, 195, 137–140 CrossRef CAS.
- Y. Abe, T. Amaya and T. Hirao, Bull. Chem. Soc. Jpn., 2014, 87, 1026–1028 CrossRef CAS.
- P. Hany, E. M. Geniès and C. Santier, Synth. Met., 1989, 31, 369–378 CrossRef CAS.
- J.-Y. Bergeron, J.-W. Chevalier and L. H. Dao, J. Chem. Soc., Chem. Commun., 1990, 180–182 RSC.
- C. DeArmitt, S. P. Armes, J. Winter, F. A. Uribe, S. Gottesfeld and C. Mombourquette, Polymer, 1993, 34, 158–162 CrossRef CAS.
- S. A. Chen and G. W. Hwang, J. Am. Chem. Soc., 1994, 116, 7939–7940 CrossRef CAS.
- C.-C. Han and R.-C. Jeng, J. Chem. Soc., Chem. Commun., 1997, 553–554 RSC.
- H. Salavagione, G. M. Morales, M. C. Miras and C. A. Barbero, Acta Polym., 1999, 50, 40–44 CrossRef CAS.
- C.-C. Han, C.-H. Lu, S.-P. Hong and K.-F. Yang, Macromolecules, 2003, 36, 7908–7915 CrossRef CAS.
- For a review: M. C. Miras, D. F. Acevedo, N. Monge, E. Frontera, C. R. Rivarola and C. A. Barbero, Open Macromol. J., 2008, 1, 58–73 CrossRef.
- Y. Abe, T. Amaya, Y. Inada and T. Hirao, Synth. Met., 2014, 197, 240–245 CrossRef CAS.
- T. Amaya, Y. Abe, H. Yamamoto, T. Kozawa and T. Hirao, Synth. Met., 2014, 198, 88–92 CrossRef CAS.
- T. Amaya, Y. Abe and T. Hirao, Macromolecules, 2014, 47, 8115–8188 CrossRef CAS.
- T. Amaya, R. Sugihara, D. Hata and T. Hirao, RSC Adv., 2016, 6, 22447–22452 RSC.
- J. F. Moulder, W. F. Stickle, P. E. Sobol and K. D. Bomben, Handbook of X-ray Photoelectron Spectroscopy, Perkin-Elmer Corporation, Eden Prairie, MN, 1992 Search PubMed.
- E. T. Kang, K. G. Neoh and K. L. Tan, Prog. Polym. Sci., 1998, 23, 277–324 CrossRef CAS.
- Related conditions for hydrolysis: C. Cheng, Y. Liu, M. E. Balasis, N. L. Simmons, J. Li, H. Song, L. Pan, Y. Qin, K. C. Nicolaou, S. M. Sebti and R. Li, Mar. Drugs, 2014, 12, 1335–1348 CrossRef CAS PubMed.
- B. Xiong, R. Shen, M. Goto, S.-F. Yin and L.-B. Han, Chem.–Eur. J., 2012, 18, 16902–16910 CrossRef CAS PubMed.
- L. Dennany, P. C. Innis, F. Masdarolomoor and G. G. Wallace, J. Phys. Chem. B, 2010, 114, 2337–2341 CrossRef CAS PubMed.
- Z. H. Wang, E. M. Scherr, A. G. MacDiarmid and A. J. Epstein, Phys. Rev. B: Condens. Matter Mater. Phys., 1992, 45, 4190–4202 CrossRef CAS.
- The peak positions (402.4, 400.4, 398.8 and 398.0 eV) shifted downward by ∼0.2 eV compared to those in the previous report (402.6, 400.6, 399.0 and 398.2 eV). This could be arisen from charge up on the measured region because the degree of charge was different between the PhosPANI 2b film and the silver plate.
- Y. Xia, J. M. Wiesinger and A. G. MacDiarmid, Chem. Mater., 1995, 7, 443–445 CrossRef CAS.
- J. Markarian, Plast. Addit. Compd., 2008, 10, 22–25 CAS.
- In the following reference, electrical conductive property was shown as a volume conductivity. So, it was judged from comparison with volume conductivity of PMAP (see ref. 17). H. S. O. Chan, S. C. Ng and P. K. H. Ho, Macromolecules, 1994, 27, 2159–2164 CrossRef CAS.
Footnotes |
| † Electronic supplementary information (ESI) available. See DOI: 10.1039/c7ra04678b |
| ‡ Present address: Faculty of Materials Science and Engineering, Kyoto Institute of Technology, Matsugasaki, Sakyo-ku, Kyoto 606-8585, Japan. |
| This journal is © The Royal Society of Chemistry 2017 |

