 Open Access Article
Creative Commons Attribution 3.0 Unported Licence
A novel hexahydroquinazolin-2-amine-based fluorescence sensor for Cu2+ from isolongifolanone and its biological applications†
Zhonglong Wanga,
Jinlai Yangb,
Yiqin Yangc,
Hua Fangd,
Xu Xuae,
Jian Ruia,
Fan Sua,
Haijun Xuae and
Shifa Wang *ae
*ae
aCollege of Chemical Engineering, Nanjing Forestry University, Nanjing, Jiangsu 210037, People’s Republic of China. E-mail: wangshifa65@163.com; Fax: +86 25 85427812; Tel: +86 25 85427812
bKey Laboratory of High Efficient Processing of Bamboo of Zhejiang Province, China National Bamboo Research Center, Hangzhou 310012, Zhejiang, China
cInstitute of Light Industry Science and Engineering, Nanjing Forestry University, Nanjing, Jiangsu 210037, People’s Republic of China
dDepartment of Chemistry and Material Science, College of Science, Nanjing Forestry University, Nanjing, Jiangsu 210037, People’s Republic of China
eJiangsu Key Lab of Biomass-Based Green Fuels and Chemicals, Nanjing 210037, People’s Republic of China
First published on 30th June 2017
Abstract
Pyrimidine-based derivatives 2a–2c were synthesized from renewable isolongifolanone, and compound 2c exhibited high selectivity and sensitivity toward Cu2+ ions with a low detection limit of 4 × 10⁻⁸ M, a wide pH range (5–11), and a short response time (30 s). The sensor still retained good fluorescence selectivity to Cu2+ ions when applied to fluorescence imaging in living black mice. Therefore, compound 2c can be used as an effective fluorescence probe and imaging agent for detecting Cu2+ ions.
Introduction
In recent years, selective chemo-sensors for recognizing specific metal ions have attracted more and more research interests. In particular, there have been advances in the development of sensors for detecting and tracking transition metal ions, such as Cu2+, Fe3+, Cr3+, and Cd2+, which are important in chemical and biological science, and the excellent properties of these sensors make them capable of being used as an efficient way to protect the environment.1–9 Copper is an essential trace element and exists in the form of copper protein in the human body. Furthermore, copper mainly acts as biocatalyst in the human body and plays a pivotal role in hematopoiesis, angiomalacia, metabolism and hormone secretion.10 In spite of these good biological functions, excessive levels of copper can result in many kinds of diseases such as Menkes or Wilson disease,11 Alzheimer’s disease,12–14 and prion disease.15 Copper can be ingested from polluted water and foods. Thus, the detection of copper ions in the environment and in vivo is important for human health.A fluorescence probe is a simple, fast, and sensitive way of detecting copper ions compared with traditional methods such as electrochemistry,16 spectrophotometry,17 voltammetry,18 and atomic absorption spectroscopy.19 Many sensitive fluorescence probes for Cu2+ have been reported, such as ferrocenyl,20 benzimidazole,21 benzothiazole,22,23 pyrene,24,25 BODIPY,26,27 rhodamine,28–31 etc. Pyrimidine is a typical nitrogen heterocyclic compound and has many structure sites that can be modified. Pyrimidine has been widely used in the fields of pesticides32 and medicine in the past few years,33,34 but there are few reports on its use in fluorescence probes. Due to the nitrogen heterocycle, pyrimidine derivatives can bind metal ions to serve as a potential probe.
Isolongifolanone is prepared from natural longifolene by oxidation,35,36 and it can serve as a renewable terpenoid material to synthesize various derivatives such as α,β-unsaturated ketones, pyrazole, and pyrimidine; these derivatives have been used in the fields of anophelifuges and antineoplastics.37 However, there is no reported derivative that has been used for detecting metal ions and other substances as a florescence probe. In addition, longifolene is a main component of natural turpentine with great biological compatibility. Therefore, longifolene derivatives have good cell membrane permeability. This excellent cell membrane permeability enables the derivatives to be used for bio-imaging in organisms. In view of the above-mentioned merits, we believe that we can design some useful compounds as probes based on isolongifolanone.
In this study, we synthesized three pyrimidine-based derivatives 2a–2c from isolongifolanone and investigated whether the fluorescence properties were affected by the locations of pyridine. After that, compound 2c was selected as a moderate florescence probe from the three compounds. Compound 2c showed obvious fluorescence quenching with the addition of Cu2+ ions. The optical properties of compound 2c towards Cu2+ ions have been investigated using various instruments and means, and in addition, compound 2c has been successfully applied to the identification of Cu2+ ions in vivo in black mice.
Results and discussion
Synthesis
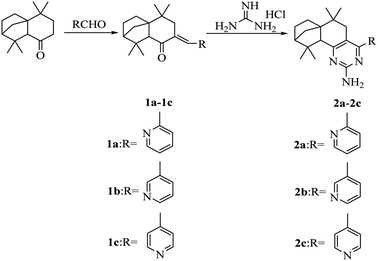
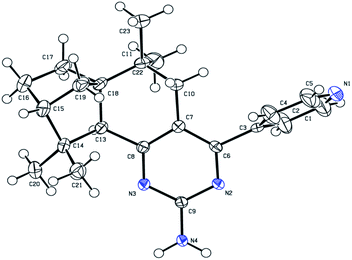
The synthetic route of compounds 2a–2c is shown in Scheme 1. Compounds 1a–1c were first synthesized by the aldol condensation reaction of isolongifolanone and pyridine-carboxaldehyde, and then compounds 2a–2c were synthesized by a reaction of compound 1a (1b or 1c) and guanidine hydrochloride in the presence of potassium tert-butylate in tert-butyl alcohol. The synthesized compounds 2a–2c were characterized by IR, NMR and HRMS techniques. Moreover, compound 2c was characterized by single-crystal X-ray diffraction (Table S1, ESI† and Fig. 1). These analyses confirmed 2c to be 6,6,10,10-tetramethyl-4-(pyridine-4′-yl)-5,7,8,9,10,10a-hexahydro-6H-6a,9-methanobenzo[h]quinazolin-2-amine.UV-vis and fluorescence properties in solution
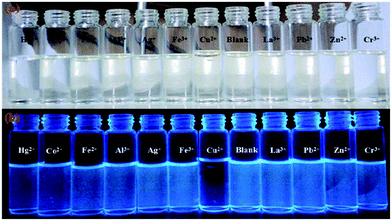
In order to investigate the fluorescence properties of the three compounds (2a–2c) in the solution state, the compounds were separately dissolved in 8/2 (v/v) ethanol–water solution (1 × 10⁻⁴ M). The compounds (2a–2c) appeared as colourless and transparent solutions under sunlight (Fig. S1a†), while the compounds (2a–2c) could emit fluorescence under 365 nm UV light. Compounds 2a and 2c emitted strong blue light, but compound 2b emitted weaker light under UV light (Fig. S1b†), therefore the locations of the pyridine substituents have an influence on the fluorescence properties in solution. Compared to the insignificant colour change of compounds 2b and 2c with the addition of 1.5 mM copper ions, the colour of compound 2a changed from colourless to pale yellow under sunlight (Fig. S1c†); this may indicate that the coordinating ability of compound 2a with Cu2+ ions was superior to that of compounds 2b and 2c. Compounds 2a–2c quench fluorescence in the presence of Cu2+ ions under 365 nm UV light, but only compound 2b showed a faint quenching change due to its own weak fluorescence (Fig. S1d†). We concluded that compounds 2a and 2c could serve as fluorescence probes for detecting Cu2+ ions, so compound 2c was selected as a moderate sample to study its optical properties.Compound 2c in the liquid state (1 × 10⁻⁵ M) emitted bright blue light when it was dissolved in different organic solvents such as ethanol, methanol, acetonitrile, ethyl acetate, and dichloromethane. The sunlight and fluorescence responses of compound 2c were further investigated with the addition of 150 μM of various metal ions such as Zn2+, Hg2+, Fe2+, Fe3+, Cu2+, Cr3+, Co2+, La3+, Ag+, Al3+, and Pb2+ in ethanol–water media (v/v = 8/2, pH = 7.2). The solutions of compound 2c maintained their original colours in the presence of metal ions under sunlight (Fig. 2a). However, the solution changed from bright blue to colourless after the addition of Cu2+ under 365 nm UV light (Fig. 2b). Meanwhile, the addition of the other metal ions did not lead to fluorescence quenching. Thus, the results showed that the new compound could be used as a novel fluorescence sensor for identifying copper ions.
The UV-visible spectrum of compound 2c (1 × 10⁻⁴ M) was measured in 8/2 (v/v) ethanol–water solution (20 mM HEPES, pH = 7.2). It had two main absorption peaks; the narrow band was strong at 225 nm and the broad band at 325 nm was very weak (Fig. S2†). The complexing interaction of compound 2c with metal ions (1 mM) such as Zn2+, Hg2+, Fe2+, Fe3+, Cu2+, Cr3+, Co2+, La3+, Ag+, Al3+, and Pb2+ was observed using UV-vis spectroscopy. The results showed that the absorbance of compound 2c at 225 nm obviously increased with the addition of La3+, Ag+, Co2+, and Pb2+ and the weak band in the range 280–325 nm became more intense in the case of Cu2+ ions.
To investigate the binding properties of compound 2c with Cu2+ ions, we measured the UV-vis absorption spectra of compound 2c (1 × 10⁻⁴ M) with the addition of various amounts of Cu2+ ions (0–1.6 × 10⁻³ M) in 8/2 (v/v) ethanol–water solution (20 mM HEPES, pH = 7.2). As shown in Fig. S3,† with increasing concentrations of Cu2+ ions (0–1.6 × 10⁻³ M), the UV-vis absorption spectra of compound 2c show a gradually enhanced intensity at 325 nm, whereas another absorption peak at 225 nm had no obvious change with the increasing concentrations of Cu2+ ions. It is possible that the complexation of compound 2c with Cu2+ ions led to this tendency of the absorption peak.
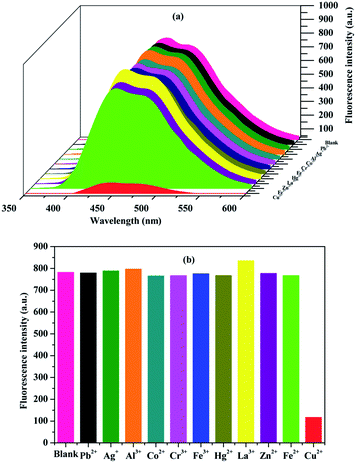
Next, the selectivity of compound 2c (1 × 10⁻⁵ M) was also evaluated after adding 10 equivalents of different metal ions using a fluorescence spectrophotometer (Fig. 3a and b). All the salts of the Pb2+, Ag+, Al3+, Co2+, Cr3+, Fe3+, Hg2+, La3+, Zn2+, Fe2+, and Cu2+ ions and compound 2c were dissolved in 8/2 (v/v) ethanol–water solution (20 mM HEPES, pH = 7.2). A slight fluorescence enhancement occurred with the addition of La3+, Al3+, and Ag+, while the addition of Co2+, Cr3+, Fe3+, Hg2+, Zn2+, and Fe2+ into the solution of compound 2c led to a tiny fluorescence decrease. Compound 2c only displayed sharp fluorescence quenching after the addition of Cu2+ ions. Compared to Cu2+ ions, the other metal ions could not induce such an obvious change of the fluorescence spectrum. Therefore, compound 2c could be used as a highly selective fluorescence quenching probe for Cu2+ ions.
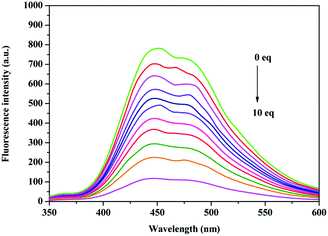
Compound 2c (1 × 10⁻⁵ M) was dissolved in HEPES (20 mM, v/v = 8/2, CH3CH2OH–H2O, pH = 7.2) buffer solution with the addition of Cu2+ ions (Fig. 4). With the addition of increasing concentrations of Cu2+ ions (0–1 × 10⁻⁴ M), the fluorescence intensity of compound 2c gradually weakened until it almost disappeared along with a colour change from blue to colourless.
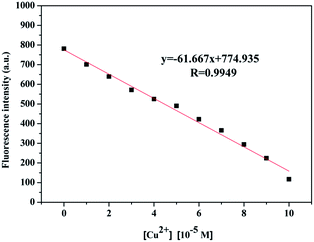
A linear relationship between the fluorescence intensity of compound 2c and Cu2+ concentration was also obtained. According to the fluorescence intensity at 450 nm, we established a linear quenching relation with increasing Cu2+ concentrations from 0 M to 1 × 10⁻⁴ M (y = −61.667x + 774.935) (Fig. 5), and the fitting constant was up to 0.9949. The limit of detection (LOD) was calculated from the formula LOD = 3σbi/m, where σbi is the standard deviation of the blank data, and m is the slope of the intensity reduction before and after quenching versus Cu2+ concentration (Fig. S4†). The LOD of Cu2+ with compound 2c was 4.0 × 10⁻⁸ M. The quenching mechanism could be divided into a static quenching mechanism and a dynamic quenching mechanism; the UV-vis spectra changes at 325 nm indicated that the quenching effect should be attributed to a static quenching mechanism. The Stern–Volmer equation was introduced in the following section as shown in eqn (1) to further explain the static quenching mechanism:
 | (1) |
The binding stoichiometry between compound 2c and Cu2+ was observed using the rate of intensity change on adjusting the concentration proportions of compound 2c and Cu2+ ions. A Job plot was recorded in 8/2 (v/v) ethanol–water solution (20 mM HEPES, pH = 7.2) (Fig. S6†). The binding stoichiometry of compound 2c and Cu2+ ions was 2![[thin space (1/6-em)]](https://www.rsc.org/images/entities/char_2009.gif) :
:![[thin space (1/6-em)]](https://www.rsc.org/images/entities/char_2009.gif) 1. The ESI-mass spectrum of compound 2c binding with Cu2+ ions also shows a peak at 760.8 m/z, which was interpreted as [2 × 2c + Cu2+–H]+ (Fig. S7†). In addition, the binding constant (Ka) of compound 2c and Cu2+ was evaluated from the intensity titration data using the Benesi–Hildebrand method (eqn (2)):38
1. The ESI-mass spectrum of compound 2c binding with Cu2+ ions also shows a peak at 760.8 m/z, which was interpreted as [2 × 2c + Cu2+–H]+ (Fig. S7†). In addition, the binding constant (Ka) of compound 2c and Cu2+ was evaluated from the intensity titration data using the Benesi–Hildebrand method (eqn (2)):38
 | (2) |
In eqn (2), CF is the total concentration of compound 2c in the system, and α is defined as the ratio between the concentration of free 2c and the total concentration of compound 2c. α was obtained using eqn (3):
 | (3) |
The binding constant (Ka) of compound 2c and Cu2+ was obtained according to α2/(1 − α) against 1/[Cu2+]. The binding constant (Ka) of compound 2c and Cu2+ was calculated to be 1 × 10⁸ M−2 (Fig. S8†). In addition, the binding mode of compound 2c with Cu2+ was investigated using IR spectroscopy. As shown in Fig. S9 and S10,† the characteristic stretching band at 3155 cm−1, which corresponds to the amino (νN–H, NH2) absorption of compound 2c, disappeared upon chelation with Cu2+. Moreover, a typical scissor bending peak at 1567 cm−1, which corresponds to the amino (δN–H, NH2) absorption of compound 2c, shifted to a higher frequency (1604 cm−1) in the 2c–Cu2+ complex. The stretching peak corresponding to νC![[double bond, length as m-dash]](https://www.rsc.org/images/entities/char_e001.gif) N (pyrimidine) was measured at 1647 cm−1 in compound 2c, while the band strengthened and shifted to a higher frequency (1666 cm−1) in the complex. With significant evidence of characteristic peaks in free 2c and the complex, the optimized binding mode of 2c and Cu2+ could be concluded on the basis of the above binding study (Fig. S11†).
N (pyrimidine) was measured at 1647 cm−1 in compound 2c, while the band strengthened and shifted to a higher frequency (1666 cm−1) in the complex. With significant evidence of characteristic peaks in free 2c and the complex, the optimized binding mode of 2c and Cu2+ could be concluded on the basis of the above binding study (Fig. S11†).
A performance comparison with some existing Cu2+ fluorescence probes is listed in Table S2.† Almost all of the enhanced fluorescence probes or quenched fluorescence probes show excellent selectivity to Cu2+ and an extremely low detection limit (μM).39–46 Fluorescence imaging towards Cu2+ has been widely applied in live cells in completed studies, while compound 2c maintained a good fluorescence intensity until copper ions were injected in the mice. Compound 2c could be used as a sensitive and specific probe for Cu2+. In addition, the performance of compound 2c was not inferior to that of other Cu2+ fluorescence probes.
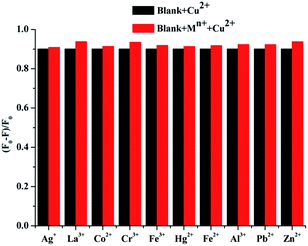
Based on the coexistence of various metal ions in soil, rivers, and animals, the interference from other metal ions has to be taken into account. The competition of compound 2c (1 × 10⁻⁵ M) with Cu2+ ions (1 × 10⁻⁴ M) was examined in the presence of other metal ions (1 × 10⁻⁴ M) by recording successive fluorescence intensity changes in CH3CH2OH–H2O (v/v = 8/2, 20 mM HEPES buffer, pH = 7.2) solution. As shown in Fig. 6, the quenching system of compound 2c towards Cu2+ ions showed a very slight growth with the addition of different metal ions (Pb2+, Ag+, Al3+, Co2+, Cr3+, Fe3+, Hg2+, La3+, Zn2+, and Fe2+) in the presence of Cu2+ ions. The detection of Cu2+ ions using compound 2c was not affected by other metal ions. Thus, compound 2c could serve as a specific probe for Cu2+ ions in buffer solution.
The fluorescence intensity of compound 2c (1 × 10⁻⁵ M) in different solvents could be regarded as an important indicator of its applicability; compound 2c was capable of keeping a relatively higher fluorescence intensity in test solvents (Fig. S12†). The intensity of compound 2c in DMF was much stronger than that in other solvents, but the intensity was obviously weaker in low-polarity solutions such as methylbenzene and n-hexane. When compound 2c was dissolved in acetonitrile, HEPES buffer solution, 1,4-dioxane, trichloromethane, and ethyl acetate separately, compound 2c exhibited a moderate fluorescence intensity. In addition, the maximum emission wavelength of compound 2c showed a tiny red-shift from 435 nm to 450 nm in the test solutions and the fluorescence intensity of compound 2c had no significant quenching in most of the organic solvents.
Because the fluorescence intensity of compound 2c could be affected by solvents according to the above research, the fluorescence quenching efficiency of compound 2c (1 × 10⁻⁵ M) to Cu2+ ions (1 × 10⁻⁴ M) at 450 nm was evaluated in different solvents (Fig. S13†). The fluorescence of compound 2c was quenched in DMF, acetonitrile, HEPES buffer solution, 1,4-dioxane, trichloromethane, ethyl acetate, methylbenzene, and n-hexane in the presence of Cu2+ ions. The fluorescence quenching efficiency (F0 − F)/F0 of compound 2c reached over 80% in the test solvents, and in particular, the quenching efficiency could reach up to 90% with the addition of Cu2+ ions in DMF, acetonitrile, trichloromethane, and ethyl acetate. Compound 2c could act as a sensitive probe for the determination of Cu2+ in different solvents.
We examined the fluorescence properties of compound 2c (1 × 10⁻⁵ M) in the absence and presence of Cu2+ ions (1 × 10⁻⁴ M) with time. The fluorescence intensity of compound 2c and the response of compound 2c towards Cu2+ were recorded in HEPES (20 mM, v/v = 8/2, CH3CH2OH–H2O, pH = 7.2) buffer solution (Fig. S14†). With the increase of time from 0 to 3.0 min, the fluorescence intensity of compound 2c was unchanged in principle. The response time of the probe to the substrate determines whether the substrate could be detected quickly or not; compound 2c had a very fast response time towards Cu2+ in our study. The fluorescence intensity of compound 2c did not decline after 30 s in the presence of Cu2+ ions indicating that the quenching reaction between compound 2c and Cu2+ had been balanced at the moment. The excellent fluorescence stability and the rapid response time towards Cu2+ would extend the utilization of compound 2c in detection.
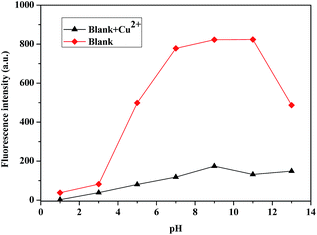
The fluorescence intensity at 450 nm of compound 2c (1 × 10⁻⁵ M) in the absence and presence of Cu2+ ions (1 × 10⁻⁴ M) was measured with different pH values (1–13) in 8/2 (v/v) ethanol–water solution (Fig. 7). The fluorescence intensity of compound 2c was relatively weak in acidic solution and gradually enhanced with increasing pH values until the pH value reached 11. An overly acidic or alkali environment was unfavourable for detecting Cu2+ ions; the optimum pH range for compound 2c to respond to Cu2+ ions was between 5 and 11. In view of the wide pH range for detecting Cu2+ ions, compound 2c could be used as a working Cu2+ probe for practical application.
To evaluate whether the fluorescence intensity of compound 2c towards copper ions was affected by the anions of the copper salts, fluorescence curves of compound 2c with the addition of cupric chloride, cupric bromide, and cupric nitrate were obtained in HEPES (20 mM, v/v = 8/2, CH3CH2OH–H2O, pH = 7.2) buffer solution (Fig. S15†). The quenching intensity showed an obvious difference under the action of the corresponding copper salts, and the optimal fluorescence quenching efficiency of compound 2c towards copper ions was found in the presence of cupric nitrate. With the addition of Cu2+ ions, the fluorescence intensity of compound 2c was quenched effectively.
The reversible and reusable response of compound 2c was investigated by performing four alternate cycles of titration of compound 2c with Cu2+ followed by the addition of EDTA (Fig. S16†). An obvious decrease of the fluorescence intensity resulted from the formation of the 2c–Cu2+ complex. However, the fluorescence intensity of the system returned to a level close to that of the free compound 2c with the addition of EDTA. The repeated OFF/ON behavior verified the remarkable reversibility and reusability of compound 2c in detecting Cu2+ ions.
The photo-stability of compound 2c was evaluated upon continuous illumination in HEPES (20 mM, v/v = 8/2, CH3CH2OH–H2O, pH = 7.2) buffer solution. As shown in Fig. S17,† the fluorescence intensity of compound 2c at 450 nm showed no significant decrease upon continuous illumination for 60 h with a fluorescent lamp. The excellent photo-stability of compound 2c indicated that it could be used as a practical fluorescence probe.
The thermostability of compounds 2a–2c
The thermostability is an important parameter for a fluorescence probe to evaluate its applicability. We tested the thermostability of compounds 2a–2c using TGA (Fig. S18†). All of compounds 2a–2c had excellent thermostabilities, and the thermostabilities of compounds 2b and 2c were much better than that of compound 2a. The weight loss of compounds 2a–2c attained 10% at the temperature points approaching 255.3 °C, 277.0 °C, and 275.9 °C. Compared to compound 2a, compounds 2b and 2c had better thermostabilities.Fluorescence response to various metal ions on filter paper
The detection of a fluorescence probe towards a substrate should ensure accuracy as simply as possible, so we attempted to use compound 2c to distinguish Cu2+ ions from other metal ions on filter paper. The solution of compound 2c (1 × 10⁻⁵ M) was added dropwise and evenly on the filter paper, then water solutions of metal salts (1.5 × 10⁻⁴ M) were respectively dropped in the previous circles and dried on the filter paper. As shown in Fig. 8, compound 2c in the absence or presence of Zn2+, Hg2+, Fe2+, Fe3+, Ag+, Al3+, and Pb2+ exhibits a bright fluorescent circle on the filter paper under 365 nm UV light, while the fluorescent circles of compound 2c were quenched slightly with Co2+ and Cr3+ ions and enhanced mildly with La3+ ions. With the drop of Cu2+ ions, the fluorescent circles of compound 2c changed from bright blue to a dark colour. Compound 2c could quickly and simply recognize Cu2+ ions from other metal ions on filter paper, so it was likely to be a feasible way to detect Cu2+ ions.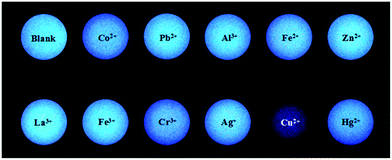 | ||
| Fig. 8 Fluorescence photographs of compound 2c (1 × 10⁻⁵ M) with drops of various metal ions (1.5 × 10⁻⁴ M) on filter paper. | ||
DFT calculations
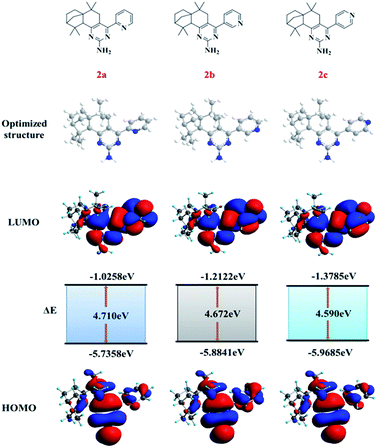
For further understanding optical properties of synthetic compounds with density functional theory (DFT), the geometries of compounds 2a–2c were optimized at the B3LYP level with the 6-31G(d) basis set using the Gaussian 09 program. The optimized structures of compounds 2a–2c were obtained. In addition, the lowest unoccupied molecular orbital (LUMO) and the highest occupied molecular orbital (HOMO) are also shown in Fig. 9. The HOMOs of compounds 2a–2c were distributed over the molecules except for the partial isolongifolanone units, while the LUMOs were mainly situated on the pyridine and pyrimidine groups. The HOMO–LUMO band gaps (ΔE) acted as the theoretical basis of the molecular fluorescence properties. The band gaps (ΔE) of compounds 2a–2c were 4.710 eV, 4.672 eV, and 4.590 eV, and they decreased with the increase of the distance of the nitrogen atoms on the pyridine groups from the pyrimidine units. The lowest ΔE indicated that compound 2c could show fluorescence after electron transition more easily than the other compounds could.Bio-imaging in vivo of compound 2c
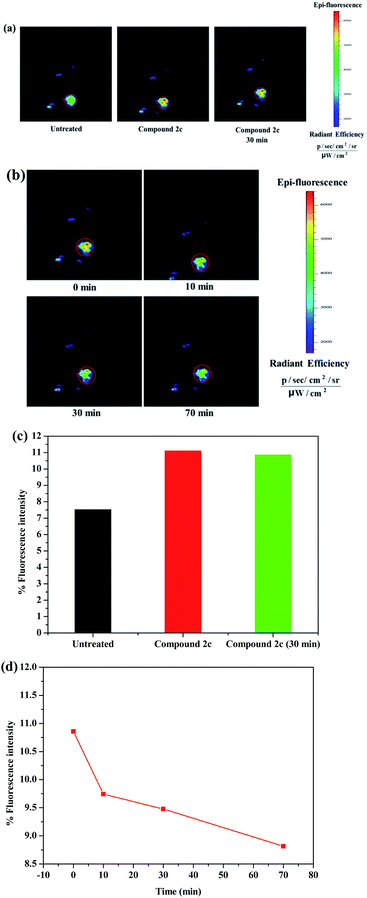
The part around a mouse’s hip with loose muscle tissues and abundant blood vessels enables an imaging agent to be absorbed as quickly as possible. Therefore, the fluorescence imaging efficacy of compound 2c towards copper ions was evaluated in vivo in black mice using a near-infrared (NIR) fluorescence imaging system. A solution of compound 2c (50 μl × 20 μM in saline, containing 1% DMSO) was injected into the subcutaneous tissues on the hip of the black mice. The fluorescence variation at the same region of the black mice was obvious after the injection of compound 2c (Fig. 10a and S43a†); the florescence intensity in the tissue sharply increased from 7.52 to 11.11% (Fig. 10c). Compared with the initial fluorescence imaging (immediately recorded after compound 2c was injected), the fluorescence durability of compound 2c was also investigated within 30 min. As shown in the diagrams, the fluorescence signal after 30 min at the same injecting region had no significant change; the % florescence intensity almost did not weaken during the testing time. The fluorescence imaging of compound 2c was visualized after the black mice were treated with an injection of 1.5 equivalents Cu2+ after 0, 10, 30, and 70 min, and the graphs at the same region show a quenching reaction over time (Fig. 10b and S43b†). The % fluorescence intensity of compound 2c towards Cu2+ ions exhibited a constant decrease in the black mice within the testing time; the quenching velocity of the % fluorescence intensity (Δ% F/Δt) was fastest ten minutes before and then mildly slowed down with time (Fig. 10d). Compound 2c had a good florescence durability and short response time to Cu2+ in vivo, so it could be used as an excellent probe for imaging Cu2+ ions in living black mice.Conclusions
In summary, a novel fluorescence probe has been synthesized from isolongifolanone. The sensor exhibited highly selective and sensitive fluorescence quenching towards Cu2+ ions, and the detection limit for Cu2+ ions was 4.0 × 10⁻⁸ M. In addition, the quenching constant (1.21 × 10⁴ L M−1) and the binding constant (1 × 10⁸ M−2) were also obtained according to the linear relationship between the fluorescence intensity and Cu2+ ion concentration. The sensor could detect Cu2+ ions in a wide pH range of 5–11 and the detection could be achieved in different solvents. The sensor could respond to Cu2+ ions in a short time (0.5 min) and sustain a good quenching efficiency during the testing time. A simple method was provided for detecting Cu2+ ions using the sensor on filter paper. The sensor was applied to the detection Cu2+ ions in living mice, and the fluorescence signals were quantified to visualize the quenching effect in vivo. Moreover, the fluorescence sensor was synthesized from isolongifolanone, which is an important derivative of turpentine. Therefore, the synthesized sensor has exploited the utilization of turpentine and provided a possible route for deep processing of forest resources.Experimental
Instruments
The mass spectra were recorded on an America Agilent 5975c mass spectrometer. The purity was measured on an America Agilent 7890A gas chromatograph. The 13C NMR and 1H NMR spectra were recorded in DMSO-d6 or CDCl3 solutions on a Bruker AV 500 spectrometer. The UV-vis absorption spectra were determined on a Shimadzu UV-2450 spectrophotometer. The fluorescence spectra were obtained on a Perkin Elmer LS 55 fluorescence spectrophotometer with the excitation wavelength at 325 nm. The infrared spectra were measured on a Nicolet 380 FTIR infrared spectrometer. The melting points were recorded on an X-6 microscopic melting point apparatus. Single-crystal X-ray diffraction measurements were done on a Bruker D8 Venture area diffractometer. The pH values were collected on a Model PHS-3C pH meter. The fluorescence images of living mice were taken using a Maestro In Vivo Imaging System.Materials
All the reagents and solvents were purchased from various commercial sources and used without further purification. Deionized water was used throughout the experiment. The most common solutions of the sensor were prepared in HEPES buffer solution (20 mM, pH = 7.2, CH3CH2OH–H2O, v/v = 8/2). The variety of pH solutions from 1 to 13 were prepared using HCl and NaOH solutions at a concentration of 1 M for slight pH adjustments. The stock solutions of metal ions were prepared from various metal salts (ZnCl2, HgSO4, Fe(NO3)3·9H2O, FeCl2, CuCl2·H2O, CrCl3·6H2O, Co(NO3)2·6H2O, La(NO3)3·6H2O, AgNO3, AlCl3, Pb(NO3)2, CuBr2, and Cu(NO3)2·3H2O). The sensor used in the mice was dissolved in saline (containing 1% DMSO) and the CuCl2·H2O used in the mice was dissolved in saline.Methods
All experiments involving living animals and their care were performed in strict accordance with the National Care and Use of Laboratory Animals by the National Animal Research Authority (China) and guidelines of Animal Care and Use issued by the Medical School of Southeast University Institutional Animal Care and Use Committee, and the experiments were approved by the Institutional Animal Care and Use Committee of the Medical School of Southeast University.Acknowledgements
The research was support by the Doctorate Fellowship Foundation of Nanjing Forestry University, the University Science Research Project of Jiangsu Province (No. 14KJ220001), the Natural National Science Foundation of China (No. 31470592), the Open Funding of Jiangsu Key Laboratory of Biomass Energy and Materials (No. JSBEM2014010), the Specialized Research Fund for the Doctoral Program of Higher Education of China (163030106), and the key technology of green processing and efficient utilization on Oleoresin (No. 2016YFD0600804).Notes and references
- L. Huang, F. Hou, J. Cheng, P. Xi, F. Chen, D. Bai and Z. Zeng, Org. Biomol. Chem., 2012, 10, 9634–9638 CAS.
- D. Huang, Z. Gao, H. Yi, Y. Bing, C. G. Niu, Q. Guo and C. Lai, Anal. Methods, 2014, 7, 353–358 RSC.
- S. Y. Jiao, K. Li, W. Zhang, Y. H. Liu, Z. Huang and X. Q. Yu, Dalton Trans., 2014, 44, 1358–1365 RSC.
- T. Anand, G. Sivaraman, A. Mahesh and D. Chellappa, Anal. Chim. Acta, 2014, 853, 596–601 CrossRef PubMed.
- Y. Zhou, H. Zhou, J. Zhang, L. Zhang and J. Niu, Spectrochim. Acta, Part A, 2012, 98, 14–17 CrossRef CAS PubMed.
- Y. G. Gao, Q. Tang, Y. D. Shi, Y. Zhang and Z. L. Lu, Talanta, 2016, 152, 438–446 CrossRef CAS PubMed.
- G. He, Q. Meng, X. Zhao, C. He, P. Zhou and C. Duan, Inorg. Chem. Commun., 2016, 65, 28–31 CrossRef CAS.
- S. Erdemir and O. Kocyigit, Talanta, 2016, 158, 63–69 CrossRef CAS PubMed.
- H. Gao, S. Chen, X. Rao, S. Shang and Z. Song, Bioorg. Med. Chem. Lett., 2013, 23, 2254–2259 CrossRef CAS PubMed.
- J. A. Cotruvo Jr, A. T. Aron, K. M. Ramostorres and C. J. Chang, Chem. Soc. Rev., 2015, 44, 4400–4414 RSC.
- D. J. Waggoner, T. B. Bartnikas and J. D. Gitlin, Neurobiol. Dis., 1999, 6, 221–230 CrossRef CAS PubMed.
- E. Gaggelli, H. Kozlowski, D. Valensin and G. Valensin, ChemInform, 2006, 37, 1995–2044 CrossRef.
- K. J. Barnham, C. L. Masters and A. I. Bush, Nat. Rev. Drug Discovery, 2004, 3, 205–214 CrossRef CAS PubMed.
- G. Multhaup, A. Schlicksupp, L. Hesse, D. Beher, T. Ruppert, C. L. Masters and K. Beyreuther, Science, 1996, 271, 1406–1409 CAS.
- D. R. Brown, Brain Res. Bull., 2001, 55, 165–173 CrossRef CAS PubMed.
- L. D. Rollmann and R. T. Iwamoto, J. Am. Chem. Soc., 1968, 90, 1455–1463 CrossRef CAS.
- M. Bernabé-Pineda, M. T. Ramírez-Silva, M. A. Romero-Romo, E. González-Vergara and A. Rojas-Hernández, Spectrochim. Acta, Part A, 2004, 60, 1105–1113 CrossRef.
- P. Pathirathna, Y. Yang, K. Forzley, S. P. McElmurry and P. Hashemi, Anal. Chem., 2012, 84, 6298–6302 CrossRef CAS PubMed.
- A. Gonzales, M. Firmino, C. Nomura, F. Rocha, P. Oliveira and I. Gaubeur, Anal. Chim. Acta, 2009, 636, 198–204 CrossRef CAS PubMed.
- Y. Liu, J. Hu, Q. Teng and H. Zhang, Sens. Actuators, B, 2017, 238, 166–174 CrossRef CAS.
- B. Gu, L. Huang, W. Su, X. Duan, H. Li and S. Yao, Anal. Chim. Acta, 2016, 954, 97–104 CrossRef PubMed.
- K. Ghosh and D. Kar, J. Inclusion Phenom. Macrocyclic Chem., 2013, 77, 67–74 CrossRef CAS.
- D. Y. Lee, N. Singh and D. O. Jang, Tetrahedron Lett., 2010, 51, 1103–1106 CrossRef CAS.
- Y.-S. Wu, C.-Y. Li, Y.-F. Li, D. Li and Z. Li, Sens. Actuators, B, 2016, 222, 1226–1232 CrossRef CAS.
- S.-P. Wu, T.-H. Wang and S.-R. Liu, Tetrahedron, 2010, 66, 9655–9658 CrossRef CAS.
- X. Xue, H. Fang, H. Chen, C. Zhang, C. Zhu, Y. Bai, W. He and Z. Guo, Dyes Pigm., 2016, 130, 116–121 CrossRef CAS.
- Y. Li, H. Zhou, S. Yin, H. Jiang, N. Niu, H. Huang, S. A. Shahzad and C. Yu, Sens. Actuators, B, 2016, 235, 33–38 CrossRef CAS.
- N. R. Chereddy and S. Thennarasu, Dyes Pigm., 2011, 91, 378–382 CrossRef CAS.
- Y. Jiang, R. Shen, G. Wei, Y. Cheng and B. Wang, Tetrahedron, 2016, 72, 2354–2358 CrossRef CAS.
- Y. Hu, J. Zhang, Y.-Z. Lv, X.-H. Huang and S.-l. Hu, Spectrochim. Acta, Part A, 2016, 157, 164–169 CrossRef CAS PubMed.
- C. Li, K. Xiang, Y. Liu, Y. Zheng, B. Tian and J. Zhang, Res. Chem. Intermed., 2015, 41, 10169–10180 CrossRef CAS.
- E. Bolygo and N. C. Atreya, Fresenius. J. Anal. Chem., 1991, 339, 423–430 CrossRef CAS.
- D. Hocková, A. n. Holý, M. Masojídková and I. Votruba, Tetrahedron, 2004, 60, 4983–4987 CrossRef.
- Y.-X. Li, Y.-P. Luo, Z. Xi, C. Niu, Y.-Z. He and G.-F. Yang, J. Agric. Food Chem., 2006, 54, 9135–9139 CrossRef CAS PubMed.
- U. R. Nayak and S. Dev, Tetrahedron, 1960, 8, 42–48 CrossRef CAS.
- J. Yadav, U. Nayak and S. Dev, Tetrahedron, 1980, 36, 309–315 CrossRef CAS.
- R. Jian, Y. Jianlai, H. Jianfeng, W. Jiayu, X. Xu, X. Haijun and W. Shifa, Chin. J. Inorg. Chem., 2016, 36, 2183–2190 Search PubMed.
- V. S. Jisha, A. J. Thomas and D. Ramaiah, J. Org. Chem., 2009, 74, 6667–6673 CrossRef CAS PubMed.
- J. Wang, H. Li, L. Long, G. Xiao and D. Xie, J. Lumin., 2012, 132, 2456–2461 CrossRef CAS.
- X. Wu, X. Gong, W. Dong, J. Ma, J. Chao, C. Li, L. Wang and C. Dong, RSC Adv., 2016, 6, 59677–59683 RSC.
- X. Yao, Y.-Y. Guo, J.-X. Ru, C. Xu, Y.-M. Liu, W.-W. Qin, G.-L. Zhang, X.-L. Tang and W.-S. Liu, Sens. Actuators, B, 2014, 198, 20–25 CrossRef CAS.
- H.-F. Wang and S.-P. Wu, Sens. Actuators, B, 2013, 181, 743–748 CrossRef CAS.
- H. S. Jung, P. S. Kwon, J. W. Lee, J. I. Kim, C. S. Hong, J. W. Kim, S. Yan, J. Y. Lee, J. H. Lee and T. Joo, J. Am. Chem. Soc., 2009, 131, 2008–2012 CrossRef CAS PubMed.
- Y. Zhang, X. Guo, X. Tian, A. Liu and L. Jia, Sens. Actuators, B, 2015, 218, 37–41 CrossRef CAS.
- C. Gao, X. Liu, X. Jin, J. Wu, Y. Xie, W. Liu, X. Yao and Y. Tang, Sens. Actuators, B, 2013, 185, 125–131 CrossRef CAS.
- L. Qu, C. Yin, F. Huo, J. Chao, Y. Zhang and F. Cheng, Sens. Actuators, B, 2014, 191, 158–164 CrossRef CAS.
Footnote |
| † Electronic supplementary information (ESI) available. CCDC 1535362. For ESI and crystallographic data in CIF or other electronic format see DOI: 10.1039/c7ra04484d |
| This journal is © The Royal Society of Chemistry 2017 |

