 Open Access Article
Creative Commons Attribution 3.0 Unported Licence
Controllable permittivity in 3D Fe3O4/CNTs network for remarkable microwave absorption performances
Lingyu Zhu†
,
Xiaojun Zeng† *,
Meng Chen and
Ronghai Yu*
School of Materials Science and Engineering, Beihang University, Beijing 100191, China. E-mail: Xiaojun-Zeng@buaa.edu.cn; rhyu@buaa.edu.cn
First published on 19th May 2017
Abstract
Carbon-based magnetic composites are promising alternatives to pure magnetic nanoparticles (MOx, M = Fe, Co, Ni) and spinel ferrites (MFe2O4, M = Fe, Co, Ni, Mn, Zn) as electromagnetic (EM) wave absorption materials, which however suffer from complex processes and have poor microwave absorption properties. Herein, we anchored Fe3O4 porous spheres onto carbon nanotubes (CNTs) via a simple solvothermal method. The formed Fe3O4/CNTs nanocomposites show a three-dimension (3D) network. The improved effective bandwidth (3.9 GHz) and, more importantly, remarkable EM microwave absorption performances (−51 dB at 5.52 GHz) are observed in 3D Fe3O4/5 wt% CNTs nanocomposites. The enhanced microwave absorption performances are attributed to the high surface areas and porous structure of magnetic Fe3O4 spheres, which presented a good synergetic role with CNTs. Furthermore, the controllable permittivity in nanocomposites was developed by adjusting the CNT content, which balanced the permeability to obtain a good impedance matching. This work demonstrates a simple approach to enhancing the microwave absorption performances of EM wave absorption materials.
1. Introduction
Many efforts have been devoted to develop high-efficiency electromagnetic (EM) microwave absorption materials because of their great potential applications in military (improvement of radar invisible of aircrafts, tanks and targets) and civil (diminution of unprecedented EM radiation and betterment of EM compatibility) fields.1–5 One type of microwave absorption materials, magnetic loss materials, e.g. magnetic nanoparticles (MOx, M = Fe, Co, Ni)6–8 and spinel ferrites (MFe2O4, M = Fe, Co, Ni, Mn, Zn),9–12 are mostly used as efficient wave absorption materials. Among these magnetic loss materials, Fe3O4 has received much attention as a result of their proper microwave absorption abilities, good environmental benignity and low cost. For example, the minimum reflection loss (RL) value of triangular Fe3O4 nanoplates has been reported to be −32.1 dB at 11.7 GHz.13 The epoxy/Fe3O4-PPy nanocomposites exhibit a minimum RL of −35.7 dB with a sample thickness of 1.7 mm.14 However, the high density and poor wave absorption properties block their large-scale applications. The other type of microwave absorption materials, dielectric loss materials, e.g. MnO2,15 CuS,16 SiC,17 BaTiO3,18 single negative materials19 and carbon-based materials,20,21 are also promising in EM microwave absorption fields. Nevertheless, it is hard to reach a good impedance matching in these unilateral magnetic loss or dielectric loss materials by adjusting the complex effective permittivity (εr) and permeability (μr).22,23 The carbon-based magnetic composites have attracted much research attention as EM microwave absorption materials by virtue of their good magnetic and dielectric properties along with lightweight and chemical stability.24Lightweight, wide-absorption bandwidth and high absorption intensity, are indispensable for a real application of carbon-based magnetic composites. Among all the carbon materials, the multiwalled carbon nanotubes (MWCNTs) have attracted considerable attention for their low density, high chemical stability and interesting electrical properties, especially tuning their relatively high permittivity is an important approach for achieving a good impedance matching.25–27 Recently, several MWCNTs-based magnetic nanocomposites have been reported to exhibit good EM microwave absorption properties. For example, MWCNTs/Fe composite possessed a minimum RL of −39 dB at 2.68 GHz with a sample thickness of 4.27 mm.28 MWCNTs/Fe3O4 hybrid reached a RL of −35.8 dB at 8.56 GHz and with a bandwidth of 2.32 GHz.29 Moreover, the γ-Fe2O3–MWNTs/PBO composites, fabricated by loading CNTs with magnetic γ-Fe2O3 particles and premixing γ-Fe2O3–MWNTs and PHA in solution followed by in situ cyclodehydration, also obtained optimal minimum RL of −32.7 dB.30 However, few mitigation strategies have been able to control the complex effective εr to improve the microwave absorption properties of carbon-based magnetic composites. More efforts are in urgent need to clarify responsible mechanisms for their poor absorption performances, and create effective solutions.
Here, we report a precise adjustment of εr for carbon-based magnetic composites by anchoring uniform Fe3O4 porous spheres onto carbon nanotubes (CNTs), marked as Fe3O4/CNTs, through a facile one-pot solvothermal method, which is time and energy-saving. A top-level microwave absorption performance of −51 dB at 5.52 GHz was achieved on Fe3O4/5 wt% CNTs nanocomposites with a three-dimension (3D) network structure. The modified εr presented improved impedance matching in these nanocomposites, possibly attributed to the good synergetic effects between magnetic Fe3O4 porous spheres and lightweight CNTs. Moreover, the high surface areas and porous structure of magnetic Fe3O4 spheres also contribute to the enhanced microwave absorption performances with a relatively high bandwidth of 3.9 GHz (RL < −10 dB).
2. Methods
2.1. Preparation of Fe3O4/CNTs
Firstly, ferric chloride hexahydrate (FeCl3·6H2O, 1.08 g) was added into 32 mL polyacrylamides (PAM, 12.5 g L−1) aqueous solution. Then, sodium citrate (2 g), urea (0.36 g) and CNTs (5 wt%, pre-treated by nitric acid) were successively added into the above solution under magnetic stirring and ultrasonic treatment for 20 min. Afterwards, the obtained mixture was transferred into a 50 mL Teflon-lined stainless steel and then heated at 180 °C for 8 h in an electric oven. After cooling the cave to room temperature, the products were collected by centrifugation, washed subsequently with deionized water and absolute ethanol for ten times and then dried at 60 °C under vacuum for one day. To understand the effects of CNTs content on microwave absorption performances, four samples containing 0, 3, 5, 7 wt% CNTs (marked as Fe3O4, Fe3O4/3 wt% CNTs, Fe3O4/5 wt% CNTs and Fe3O4/7 wt% CNTs), were synthesized through the same process as described above.2.2. Characterization
The phase structure of samples was performed on X-ray diffraction (XRD) using a Rigaku D/max 2500PC X-ray diffractometer with Cu Kα radiation. The microstructures and morphologies of samples were observed by scanning electron microscopy (SEM, JSM-7500F, JEOL) and transmission electron microscopy (TEM, JEM-2100, JEOL). Nitrogen absorption and desorption isotherms were obtained at 77 K on a Quanta chrome surface and pore size analyzer to characterize the Brunauer–Emmett–Teller (BET) surface area of the samples. An X-ray photoelectron spectroscope (XPS, ESCALAB 250 Xi) with an Al Kα excitation source was applied to probe the surface compositions and valence states of samples. The hysteresis loops of samples were conducted on a vibrating sample magnetometer (VSM, Lakeshore 7307).2.3. Wave absorption measurements
All microwave absorption measurements were conducted on an Agilent N5230C network analyzer at the frequency range of 2–18 GHz, as described in our previous work.31 To prepare the measured samples, products (50 wt%) and paraffin wax (50 wt%) were mixed to form a uniform composites. The obtained homogeneous mixture was compressed into toroidal shaped with internal diameter of 3 mm, outside diameter of 7 mm, and thickness of 3 mm. The measured effective permittivity (εr) and permeability (μr) were converted to reflection loss (RL) according to the transmission line theory as following equation:32
Zin = Z0(μr/εr)1/2![[thin space (1/6-em)]](https://www.rsc.org/images/entities/char_2009.gif) tanh[j(2πfd/c)(μrεr)1/2] tanh[j(2πfd/c)(μrεr)1/2]
| (1) |
RL = 20![[thin space (1/6-em)]](https://www.rsc.org/images/entities/char_2009.gif) log(Zin − Z0)/(Zin + Z0) log(Zin − Z0)/(Zin + Z0)
| (2) |
3. Results and discussion
3.1. Characterization of the Fe3O4/CNTs composites
To determine the optimum conditions for the microwave absorption performances of Fe3O4/CNTs nanocomposites, different ratios of Fe3O4 and CNTs were examined. As can be seen in the XRD patterns (Fig. 1a), the diffraction peak at 26.2° in Fe3O4/CNTs composites suggests the addition of CNTs. The rest of diffraction peaks in all samples match well with the crystal planes of the face-centered cubic Fe3O4 phase (JCPDS, no. 99-0073), revealing that the as-prepared Fe3O4 are well-crystallized and high purity. This is also proved by the XPS spectra (Fig. 1b and c), in which signals of Fe and C element in Fe3O4/5 wt% CNTs composites are observed. The Fe 2p spectrum (Fig. 1b) contains only two characteristic peaks of Fe 2p1/2 (723.5) and 2p3/2 (709.9 eV), and without satellite peak, indicating the formation of pure Fe3O4 phase.33 The C 1s spectrum (Fig. 1c) consists of four deconvoluted peaks that correspond to C–C/C![[double bond, length as m-dash]](https://www.rsc.org/images/entities/char_e001.gif) C (284.6 eV), C–O/C–O–C (285.6 eV), C
C (284.6 eV), C–O/C–O–C (285.6 eV), C![[double bond, length as m-dash]](https://www.rsc.org/images/entities/char_e001.gif) O (287.7 eV) and O–C
O (287.7 eV) and O–C![[double bond, length as m-dash]](https://www.rsc.org/images/entities/char_e001.gif) O (290.1 eV), respectively.34,35 These heteroatoms are formed during the pretreatment of CNTs. The N2 adsorption–desorption isotherm of Fe3O4/5 wt% CNTs (Fig. 1d) shows a typical type-IV isotherm with obvious hysteresis loop at a relative pressure range of 0.45–0.95, which implying the mesoporous structure of the Fe3O4 spheres in composites. Furthermore, the BET surface area of the composites is 92 cm2 g−1 and the pore size is about 4.3 nm. It has been confirmed that the high surface areas and porous structure are effective for EM microwave absorption.36,37
O (290.1 eV), respectively.34,35 These heteroatoms are formed during the pretreatment of CNTs. The N2 adsorption–desorption isotherm of Fe3O4/5 wt% CNTs (Fig. 1d) shows a typical type-IV isotherm with obvious hysteresis loop at a relative pressure range of 0.45–0.95, which implying the mesoporous structure of the Fe3O4 spheres in composites. Furthermore, the BET surface area of the composites is 92 cm2 g−1 and the pore size is about 4.3 nm. It has been confirmed that the high surface areas and porous structure are effective for EM microwave absorption.36,37
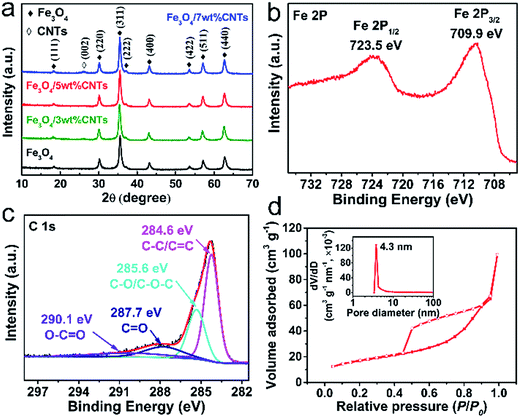 | ||
| Fig. 1 The XRD patterns of samples (a). The XPS spectra of Fe 2p (b) and C 1s (c), and N2 absorption–desorption isotherms (d) of Fe3O4/5 wt% CNTs composites. | ||
Fig. 2 shows the representative SEM (Fig. 2a–d) and TEM (Fig. 2e–h) images of the Fe3O4 sample and Fe3O4/CNTs composites. It is clear that all of the Fe3O4 particles in Fe3O4 sample are spherical and monodispersed with an obvious porous structure (Fig. 2a and e). Furthermore, the Fe3O4 porous spheres have a uniform distribution of particle size, which can be ascribed to the modulating effect of surfactant PAM. As presented in Fig. 2b–d and f–h, Fe3O4 porous spheres are anchored onto CNTs, and the high-conductivity CNTs across the whole composites and tightly bind the Fe3O4 spheres, resulting in a three-dimension (3D) network, which can bring an enhanced permittivity, as reported in the previous works.38,39 It is noteworthy that the Fe3O4 spheres in Fe3O4/CNTs composites have rougher surface, smaller size and more interfaces than porous spheres in Fe3O4 sample, which also improve the bonding strength and interaction between Fe3O4 and CNTs. The abundant oxygen-containing groups (–COOH, –OH) existing on the surface of CNTs are beneficial for binding the Fe3+ via the electrostatic interaction. As the reaction proceeds, the initially formed Fe3O4 crystals are anchored on the surface of CNTs and grow to be porous spheres, as shown in the inset of Fig. 2g. The incident EM microwaves could be dissipated and absorbed as a result of being repeatedly scattered and reflected between the interfaces. Thus, the plentiful interfaces exhibiting in composites can make contributions to microwave absorption properties through the interface loss.37,40 However, the excessive CNTs in Fe3O4/7 wt% CNTs composites show agglomeration phenomenon which may do harm to their microwave absorption performances, as will be confirmed below.
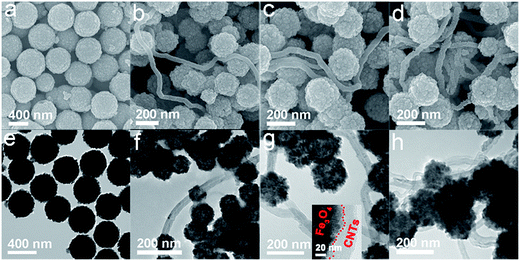 | ||
| Fig. 2 The SEM and TEM images of Fe3O4 sample (a and e), Fe3O4/3 wt% CNTs (b and f), Fe3O4/5 wt% CNTs (c and g) and Fe3O4/7 wt% CNTs (d and h) composites. | ||
3.2. Magnetic properties of the Fe3O4/CNTs composites
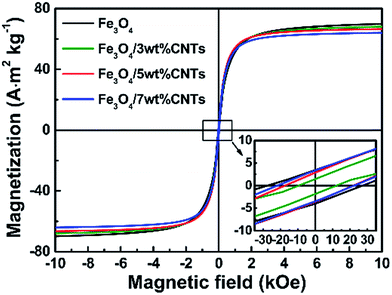
It is generally accepted that the magnetization property highly affects the microwave absorption ability of an absorber due to the obvious magnetic loss behavior. As shown in the hysteresis loops (Fig. 3), all samples exhibit typical magnetization hysteresis behaviors of superparamagnetic materials, identifying the good intrinsic magnetic properties with high saturation magnetization (Ms) and low coercivity (Hc), which bring a good permeability and magnetic loss and further make contribution to the microwave absorption, as discussed in our previous work.31 The Ms values are decreased with the increase of CNTs content in composites, which resulting from the decrease of magnetic Fe3O4 phases. In addition, Fe3O4 sample and Fe3O4/CNTs composites show very low Hc values, which can be ascribed to the high particle symmetry of uniform Fe3O4 porous spheres.3.3. Microwave absorption performances of the Fe3O4/CNTs composites
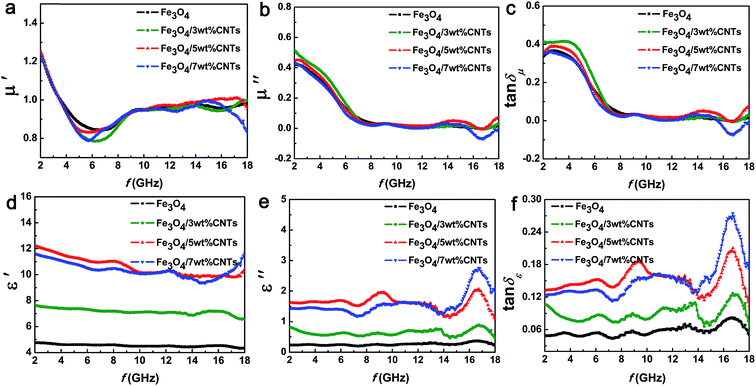
The EM absorption performance of an absorber is evaluated by their EM parameters including complex effective permittivity (εr = ε′ − jε′′) and permeability (μr = μ′ − jμ′′), where the real parts (ε′ and μ′) represent the storage capability and the imaginary parts (ε′′ and μ′′) signify the dissipation ability of EM microwave energies.41 Fig. 4 shows the measured μr and εr, calculated magnetic loss (tan![[thin space (1/6-em)]](https://www.rsc.org/images/entities/char_2009.gif) δμ) and dielectric loss (tan
δμ) and dielectric loss (tan![[thin space (1/6-em)]](https://www.rsc.org/images/entities/char_2009.gif) δε) for the Fe3O4 sample and Fe3O4/CNTs composites. The similar μ′ and μ′′ values (Fig. 4a and b) for all samples over the whole frequency range illustrating their alike ability to store and dissipate magnetic energies, which owing to the high mass percentage of magnetic Fe3O4 in the composites. It is worth noting that the ε′ and ε′′ values (Fig. 4d and e) of samples improve greatly with the increasing of CNTs content, demonstrating that the dielectric loss and storage capability have been obviously enhanced due to the increased electric polarization and conductivity resulting from the proper CNTs addition.42 Meanwhile, the εr can be controlled by regulating the CNTs content. It should, however, be taken into account that the Fe3O4/7 wt% CNTs show a slightly lower ε′ and ε′′ values than Fe3O4/5 wt% CNTs, which may be attributed to the agglomeration of excess CNTs.
δε) for the Fe3O4 sample and Fe3O4/CNTs composites. The similar μ′ and μ′′ values (Fig. 4a and b) for all samples over the whole frequency range illustrating their alike ability to store and dissipate magnetic energies, which owing to the high mass percentage of magnetic Fe3O4 in the composites. It is worth noting that the ε′ and ε′′ values (Fig. 4d and e) of samples improve greatly with the increasing of CNTs content, demonstrating that the dielectric loss and storage capability have been obviously enhanced due to the increased electric polarization and conductivity resulting from the proper CNTs addition.42 Meanwhile, the εr can be controlled by regulating the CNTs content. It should, however, be taken into account that the Fe3O4/7 wt% CNTs show a slightly lower ε′ and ε′′ values than Fe3O4/5 wt% CNTs, which may be attributed to the agglomeration of excess CNTs.
To help analyze the principle reasons of microwave absorption of the samples, the tan![[thin space (1/6-em)]](https://www.rsc.org/images/entities/char_2009.gif) δμ(μ′′/μ′) and tan
δμ(μ′′/μ′) and tan![[thin space (1/6-em)]](https://www.rsc.org/images/entities/char_2009.gif) δε(ε′′/ε′) are calculated based on the measured εr and μr. The slight difference in values and tendency of magnetic loss tan
δε(ε′′/ε′) are calculated based on the measured εr and μr. The slight difference in values and tendency of magnetic loss tan![[thin space (1/6-em)]](https://www.rsc.org/images/entities/i_char_2009.gif) δμ (Fig. 4c) among four samples agrees well with the above analysis of μ′ and μ′′. Notably, the Fe3O4/CNTs composites maintain a stronger and more efficient dielectric loss tan
δμ (Fig. 4c) among four samples agrees well with the above analysis of μ′ and μ′′. Notably, the Fe3O4/CNTs composites maintain a stronger and more efficient dielectric loss tan![[thin space (1/6-em)]](https://www.rsc.org/images/entities/i_char_2009.gif) δε (Fig. 4f) than Fe3O4 samples. Especially, the Fe3O4/5 wt% CNTs composites show the strongest dielectric loss, which may bring an excellent microwave absorption performance, as will be discussed below.
δε (Fig. 4f) than Fe3O4 samples. Especially, the Fe3O4/5 wt% CNTs composites show the strongest dielectric loss, which may bring an excellent microwave absorption performance, as will be discussed below.
The high dielectric loss of Fe3O4/CNTs composites encouraged us to deeply explore their mechanisms through the theory of Debye dipolar relaxation. According to the Debye theory, ε′ and ε′′ follow the equation:43
| (ε′ − ε∞)2 + (ε′′)2 = (εs − ε∞)2 | (3) |
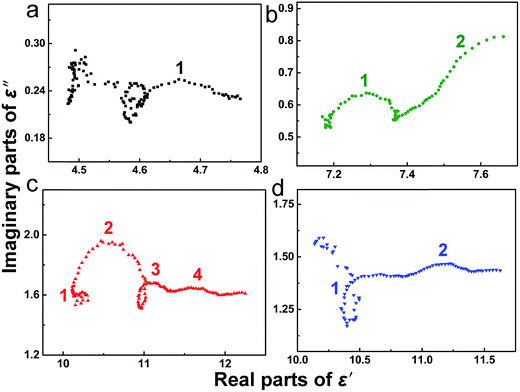 | ||
| Fig. 5 Plots of ε′–ε′′ for Fe3O4 sample (a), Fe3O4/3 wt% CNTs (b), Fe3O4/5 wt% CNTs (c) and Fe3O4/7 wt% CNTs (d) composites. | ||
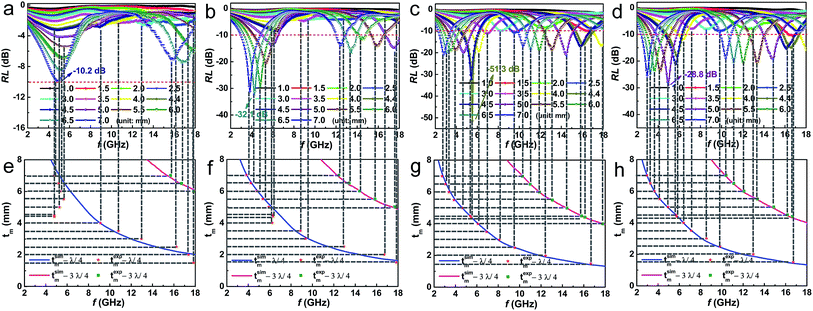
Reflection loss (RL), effective bandwidth (RL < −10 dB), and thickness of sample are important criterions for evaluating the application prospects of microwave absorption materials. Fig. 6 shows a comparison of RL values (calculated from eqn (1) and (2)) in frequency range of 2–18 GHz for Fe3O4 sample and Fe3O4/CNTs composites with coating thickness of 1–7 mm. It can be seen from Fig. 6a that the Fe3O4 product shows weak wave absorption ability with the minimum RL value of −10.2 dB and a large sample thickness of 7 mm. In contrast, the Fe3O4/CNTs composites exhibit good wave absorption ability (Fig. 6b–d). Markedly, Fe3O4/5 wt% CNTs composites present an unexpected high microwave absorption performance with a minimum RL value of −51.32 dB at 5.52 GHz and a thinner sample thickness of 4.4 mm, which outperforms the benchmark Fe3O4 sample and also surpass most contemporaries reported, as summarized in Table 1. In addition, the effective bandwidth of Fe3O4/5 wt% CNTs composites reach a relatively high value of 3.9 GHz. The top-level microwave absorption performances of Fe3O4/5 wt% CNTs composites further underline the good polarization relaxation and strong dielectric loss of the material.
| RLmin (dB) | Frequency range (GHz) | Effective bandwidth (GHz) (RL < −10 dB) | Thickness (mm) | Weight fraction (wt%) | Ref. | |
|---|---|---|---|---|---|---|
| a Note: the exact RLmin and effective bandwidths were not presented in some references, thus, those values were dug out according to the RL–f curves. | ||||||
| CNTs/Co | −60.4 | 12.8–18.0 | 5.2 | 1.81 | 20 | 46 |
| NiO@GO | −59.6 | 12.48–16.72 | 4.24 | 1.7 | 25 | 47 |
| Fe3O4/5 wt% CNTs | −51.3 | 4.4–6.3, 15.3–17.3 | 3.9 | 4.4 | 50 | This work |
| NiFe@C nanocubes@GO | −51.0 | 8.5–12.6 | 4.1 | 2.8 | 30 | 48 |
| Carbon@Fe@Fe3O4 | −40.0 | 8.6–13.8 | 5.2 | 1.5 | 50 | 49 |
| NWCNTs/Fe | −39.0 | 2.5–7.5 | 5.0 | 4.3 | 60 | 28 |
| Fe-filled CNT/epoxy | −31.7 | 14.7–11.8 | 2.9 | 1.0 | 10 | 50 |
| Fe3O4@Carbon | −29.0 | 13.0–18.0 | 5.0 | 5.0 | 50 | 43 |
| Fe3O4/polypyrrole/CNTs | −25.9 | 8.0–12.5 | 4.5 | 3.0 | 20 | 51 |
| CNT@Fe@SiO2 | −22.3 | 7.5–11.0 | 3.5 | 3.0 | 50 | 52 |
| PANI/Fe3O4/MWCNT | −16.0 | 8.0–15.0 | 7.0 | 4.0 | 20 | 53 |
Noticeably, with the increasing of sample thickness, the absorption peaks for Fe3O4/CNTs composites become sharper and matching frequency (fm) shift to lower frequency. These results are consistent with the quarter-wavelength cancelation law, tm = nλ/4 = nc/(4fm(|μr||εr|)1/2) (n = 1, 3, 5,…), where tm is matching thickness, λ is the wavelength of EM wave and c is the velocity of light in a vacuum.45 It is well established that the RL will reach the maximum value if tm and fm satisfy this equation.51,53 The experimental matching thickness (texpm) vs. the peak frequency are extracted from RL curves (Fig. 6a–d) and marked as red asterisks and green squares, respectively. From the above equation, the simulation of tm (tsimm) vs. fm for Fe3O4 sample and Fe3O4/CNTs composites are depicted in Fig. 6e–h. As expected, the scatter symbols in tsimm vs. fm curves of Fe3O4/5 wt% CNTs composites (Fig. 6g) are exactly situated around the λ/4 and 3λ/4 curves, meaning that the correlation between tm and fm for EM wave absorption of samples agrees well with the quarter-wavelength matching conditions.
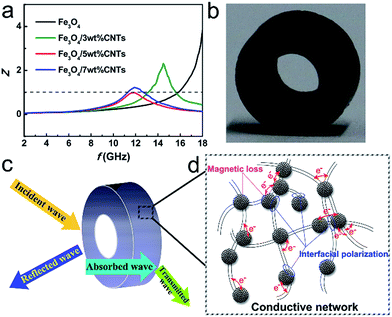
To further clarify the responsible mechanisms and Fe3O4/CNTs composites' contribution for EM microwave absorption, the impedance matching of samples are analyzed. Good impedance matching means the value of Z (|Zin/Z0|) equal or close to 1 for achieving zero reflection at the air-absorber interface.22,31 The Z value of Fe3O4/5 wt% CNTs composite (Fig. 7a) is almost equal to 1, suggesting the good impedance matching in those materials, which results in their excellent microwave absorption performances. The Fe3O4/CNTs composites absorber (Fig. 7b) can attenuate almost all the EM microwave (Fig. 7c) due to the strong dielectric loss including interfacial polarization and hopping of electrons (Fig. 7d), and the magnetic loss from natural resonance and exchange resonance of Fe3O4 porous spheres. Finally, the synergistic effects of the good intrinsic magnetic properties arising from the Fe3O4 porous spheres and the good polarization relaxation and strong dielectric loss arising from the CNTs also greatly contribute to the excellent microwave absorption performances.
4. Conclusions
In summary, we demonstrated a facile method for one-pot synthesis of Fe3O4/CNTs composites with excellent microwave absorption performances. The uniform magnetic Fe3O4 porous spheres were anchored onto CNTs to form a 3D network. The permittivity in composites could be well tuned by adjusting the CNTs content. The good impedance matching, arising from the synergistic effects between the magnetic Fe3O4 spheres and high-conductivity CNTs, resulting in the top-level microwave absorption performances with a minimum RL value of −51 dB at 5.52 GHz and a thinner sample thickness of 4.4 mm as well as an effective bandwidth of 3.9 GHz (RL < −10 dB) for Fe3O4/CNTs composites. This work presented a simple approach to enhancing the microwave absorption performances of Fe3O4/CNTs composites and promoted their potential application in the field of high-performance EM wave materials.Acknowledgements
This work was supported by the National Natural Science Foundation of China under Grant no. 51671010 and 51101007.References
- J. W. Liu, R. C. Che, H. J. Chen, F. Zhang, F. Xia, Q. S. Wu and M. Wang, Small, 2012, 8, 1214–1221 CrossRef CAS PubMed.
- T. Xia, C. Zhang, N. A. Oyler and X. B. Chen, Adv. Mater., 2013, 25, 6905–6910 CrossRef CAS PubMed.
- G. B. Sun, B. X. Dong, M. H. Cao, B. Q. Wei and C. W. Hu, Chem. Mater., 2011, 23, 1587–1593 CrossRef CAS.
- C. Alippi, CAAI Transactions on Intelligence Technology, 2016, 1, 1–3 CrossRef.
- H. Y. Jin, Q. Chen, Z. X. Chen, Y. Hu and J. W. Zhang, CAAI Transactions on Intelligence Technology, 2016, 1, 104–113 CrossRef.
- H. C. Yu, L. C. Hsu, T. H. Chang and Y. Y. Li, Dalton Trans., 2012, 41, 723–726 RSC.
- C. Z. He, S. Qiu, X. Z. Wang, J. R. Liu, L. Q. Luan, W. Liu, M. Itosh and K. I. Machida, J. Mater. Chem., 2012, 22, 22160–22166 RSC.
- G. X. Tong, Q. Hu, W. H. Wu, W. Li, H. S. Qian and Y. Liang, J. Mater. Chem., 2012, 22, 17494–17504 RSC.
- S. L. Zhang, Q. Z. Jiao, Y. Zhao, H. S. Li and Q. Wu, J. Mater. Chem. A, 2014, 2, 18033–18039 CAS.
- W. M. Zhu, L. Wang, R. Zhao, J. W. Ren, G. Z. Lu and Y. Q. Wang, Nanoscale, 2011, 3, 2862–2864 RSC.
- H. M. Xiao, X. M. Liu and S. Y. Fu, Compos. Sci. Technol., 2006, 66, 2003–2008 CrossRef CAS.
- C. H. Peng, H. W. Wang, S. W. Kan, M. Z. Shen, Y. M. Wei and S. Y. Chen, J. Magn. Magn. Mater., 2004, 284, 113–119 CrossRef CAS.
- X. Liu, K. Y. Cao, Y. Z. Chen, Y. T. Ma, Q. F. Zhang, D. Q. Zeng, X. L. Liu, L. S. Wang and D. L. Peng, Mater. Chem. Phys., 2017, 192, 339–348 CrossRef CAS.
- J. Guo, H. X. Song, H. Liu, C. J. Luo, Y. R. Ren and T. Ding, J. Mater. Chem. C 10.1039/c7tc01502j.
- M. Zhou, X. Zhang, J. M. Wei, S. L. Zhao, L. Wang and B. X. Feng, J. Phys. Chem. C, 2010, 115, 1398–1402 Search PubMed.
- S. He, G. S. Wang, C. Lu, J. Liu, B. Wen, H. Liu, L. Guo and M. S. Cao, J. Mater. Chem. A, 2013, 1, 4685–4692 CAS.
- R. B. Wu, K. Zhou, Z. H. Yang, X. K. Qian, J. Wei, L. Liu, Y. Z. Huang, L. B. Kong and L. Y. Wang, CrystEngComm, 2013, 15, 570–576 RSC.
- F. Xia, J. W. Liu, D. Gu, P. F. Zhao, J. Zhang and R. C. Che, Nanoscale, 2011, 3, 3860–3867 RSC.
- P. T. Xie, K. Sun, Z. Y. Wang, Y. Liu, R. H. Fan, Z. D. Zhang and G. Schumacher, J. Alloys Compd. DOI:10.1016/j.jallcom.2017.04.248.
- Y. B. Zhang, P. Wang, Y. Wang, L. Qiao, T. Wang and F. Li, J. Mater. Chem. C, 2015, 3, 10813–10818 RSC.
- W. W. Liu, H. Li, Q. P. Zeng, H. N. Duan, Y. P. Guo, X. F. Liu, C. Y. Sun and H. Z. Liu, J. Mater. Chem. A, 2015, 3, 3739–3747 CAS.
- X. H. Li, J. Feng, Y. P. Du, J. T. Bai, H. M. Fan, H. L. Zhang, Y. Peng and F. S. Li, J. Mater. Chem. A, 2015, 3, 5535–5546 CAS.
- K. Sun, R. H. Fan, Y. S. Yin, J. Guo, X. F. Li, Y. H. Lei, L. Q. An, C. B. Cheng and Z. H. Guo, J. Phys. Chem. C, 2017, 121, 7564–7571 CAS.
- X. J. Zeng, B. Yang, L. Y. Zhu, H. Z. Yang and R. H. Yu, RSC Adv., 2016, 6, 105644 RSC.
- J. P. Salvetat, A. J. Kulik, J. A. Bonard, J. M. Bonard, G. A. D. Briggs, T. Stockli, K. Metenier, S. Bonnamy and F. Beguin, Adv. Mater., 1999, 11, 161–165 CrossRef CAS.
- C. B. Cheng, R. H. Fan, Y. R. Ren, T. Ding, L. Qian, J. Guo, X. F. Li, L. Q. An, Y. H. Lei, Y. S. Yin and Z. H. Guo, Nanoscale 10.1039/c7nr01516j.
- Z. D. Zhang, Z. C. Shi, R. H. Fan, M. Gao, J. Y. Guo, X. G. Qi and K. N. Sun, Mater. Chem. Phys., 2011, 130, 615–618 CrossRef CAS.
- F. S. Wen, F. Zhang and Z. Y. Liu, J. Phys. Chem. C, 2011, 115, 14025–14030 CAS.
- C. Y. Zhao, A. B. Zhang, Y. P. Zheng and J. F. Luan, Mater. Res. Bull., 2012, 47, 217–221 CrossRef CAS.
- Y. Chen, X. Y. Liu, X. Y. Mao, Q. X. Zhang, Z. Xie and Z. W. Han, Nanoscale, 2014, 6, 6440–6447 RSC.
- L. Y. Zhu, X. J. Zeng, B. Yang, X. P. Li and R. H. Yu, J. Magn. Magn. Mater., 2016, 426, 114–120 CrossRef.
- X. L. Zheng, J. Feng, Y. Zong, H. Miao, X. Y. Hu, J. T. Bai and X. H. Li, J. Mater. Chem. C, 2015, 3, 4452–4463 RSC.
- X. J. Zeng, B. Yang, X. P. Li, R. F. Li and R. H. Yu, Mater. Des., 2016, 101, 35–43 CrossRef CAS.
- G. H. Pan, J. Zhu, S. l. Ma, G. B. Sun and X. J. Yang, ACS Appl. Mater. Interfaces, 2013, 5, 12716–12724 CAS.
- T. T. Chen, F. Deng, J. Zhu, C. F. Chen, G. B. Sun, S. L. Ma and X. J. Yang, J. Mater. Chem. C, 2012, 22, 15190–15197 RSC.
- G. Li, T. S. Xie, S. L. Yang, J. H. Jin and J. M. Jiang, J. Phys. Chem. C, 2012, 116, 9196–9201 CAS.
- H. B. Zhao, Z. B. Fu, H. B. Chen, M. L. Zhong and C. Y. Wang, ACS Appl. Mater. Interfaces, 2016, 8, 1468–1477 CAS.
- K. Sun, R. H. Fan, Z. D. Zhang, K. L. Yan, X. H. Zhang, P. T. Xie, M. X. Yu and S. B. Pan, Appl. Phys. Lett., 2015, 106, 1729021 Search PubMed.
- Q. Hou, K. Sun, P. T. Xie, K. Yan, R. H. Fan and Y. Liu, Mater. Lett., 2016, 169, 86–89 CrossRef CAS.
- N. Li, G. W. Huang, Y. Q. Li, H. M. Xiao, Q. P. Feng, N. Hu and S. Y. Fu, ACS Appl. Mater. Interfaces, 2016, 10, 2973–2983 Search PubMed.
- X. M. Zhang, G. B. Ji, W. Liu, X. X. Zhang, Q. G. Gao, Y. C. Li and Y. W. Du, J. Mater. Chem. C, 2016, 4, 1860–1870 RSC.
- L. N. Wang, X. L. Jia, Y. F. Li, F. Yang, L. Q. Zhang, L. P. Liu, X. Ren and H. T. Yang, J. Mater. Chem. A, 2014, 2, 14940–14946 CAS.
- Y. C. Du, W. W. Liu, R. Qiang, Y. Wang, X. J. Han, J. Ma and P. Xu, ACS Appl. Mater. Interfaces, 2014, 6, 12997–13006 CAS.
- X. L. Dong, X. F. Zhang, H. Huang and F. Zuo, Appl. Phys. Lett., 2008, 92, 013127 CrossRef.
- T. Wu, Y. Liu, X. Zeng, T. T. Cui, Y. T. Zhao, Y. N. Li and G. X. Tong, ACS Appl. Mater. Interfaces, 2016, 8, 7370–7380 CAS.
- Y. C. Yin, X. F. Liu, X. J. Wei, R. H. Yu and J. L. Shui, ACS Appl. Mater. Interfaces, 2016, 8, 34686–34698 CAS.
- L. Wang, H. L. Xing, S. T. Gao, X. L. Ji and Z. Y. Shen, J. Mater. Chem. C, 2017, 5, 2005–2014 RSC.
- Z. H. Yang, H. L. Lv and R. B. Wu, Nano Res., 2016, 9, 3671–3682 CrossRef CAS.
- H. L. Lv, G. B. Ji, W. Liu, H. Q. Zhang and Y. W. Du, J. Mater. Chem. C, 2015, 3, 10232–10241 RSC.
- D. L. Zhao, X. Li and Z. M. Shen, J. Alloys Compd., 2009, 471, 457–460 CrossRef CAS.
- R. B. Yang, P. M. Reddy, C. J. Chang, P. A. Chen and C. C. Chang, Chem. Eng. J., 2016, 285, 497–507 CrossRef CAS.
- H. L. Lv, G. B. Ji, H. Q. Zhang and Y. W. Du, RSC Adv., 2015, 5, 76836–76843 RSC.
- M. S. Cao, J. Yang, W. L. Song, D. Q. Zhang, B. Wen, H. B. Jin, Z. L. Hou and J. Yuan, ACS Appl. Mater. Interfaces, 2012, 4, 6949–6956 CAS.
Footnote |
| † These authors contributed equally to this work. |
| This journal is © The Royal Society of Chemistry 2017 |

