 Open Access Article
Creative Commons Attribution 3.0 Unported Licence
Simple synthesis of SiGe@C porous microparticles as high-rate anode materials for lithium-ion batteries
Yaguang Zhang ,
Ning Du*,
Chengmao Xiao,
Shali Wu,
Yifan Chen
 ,
Yangfan Lin,
Jinwei Jiang,
Yuanhong He and
Deren Yang*
State Key Lab of Silicon Materials, School of Materials Science and Engineering, Cyrus Tang Center for Sensor Materials and Applications, Zhejiang University, Hangzhou 310027, People's Republic of China. E-mail: dna1122@zju.edu.cn; mseyang@zju.edu.cn; Fax: +86-571-87952322; Tel: +86-571-87953190
First published on 5th July 2017
Abstract
We report the synthesis of SiGe@C porous microparticles (PoSiGe@C) via the decomposition of Mg2Si/Mg2Ge composites, acid pickling and subsequent carbon coating processes, respectively. The content of Ge can be tuned by the initial ratio of Mg2Si and Mg2Ge in the composite. The as-synthesized PoSiGe@C has been used as the anode material of lithium-ion batteries, which shows an enhanced cyclic and rate performance compared to bare Si, PoSiGe as well as PoSi@C porous microparticles. Briefly, the PoSiGe@C delivers a good cycling stability with 70% capacity retention after 400 cycles and only 0.075% capacity loss per cycle at the current density of 0.8 A g−1. Furthermore, super rate capability is also expressed by the PoSiGe@C. The unique porous structure, and synergistic effect of Si and Ge, may lead to the inherent high lithium-ion diffusivity and electrical conductivity of Ge, and good volume alleviation, which results in the good electrochemical performance.
1. Introduction
Alternative anode materials of lithium-ion batteries (LIBs) with high energy density have been pursued to take the place of the traditional carbonaceous anodes, because of the fast-growing improvement in the fields of consumer electronics and electrical vehicles.1–4The group IV elements such as silicon (Si) and germanium (Ge) show high theoretical capacity, and are both promising candidates for the next-generation LIB anodes.5–7 For example, Si is very attractive for its abundant reserves, low price, low working potential (<0.5 V) and especially the highest theoretical capacity (3579 mA h g−1, corresponding to Li15Si4).8–11 However, the huge volume variation during the lithiation and delithiation process leads to a poor cycle life, which hinders its commercial application.12–15 Compared with Si, Ge also exhibits high theoretical capacity (1384 mA h g−1, corresponding to Li15Ge4). Moreover, it shows a higher lithium ion diffusivity (400 times higher than Si) and better electrical conductivity (104 times higher than Si).16–20 Similarly, Ge suffers a volume expansion as large as 270% during the lithium-ion insertion.21,22 Moreover, the high cost and low abundance of Ge hinder its commercialization.23,24 Therefore, it is significant to take the advantage of both Si and Ge anodes, such as large capacity, relatively high lithium ion diffusivity and electrical conductivity.25–30 Moreover, the volume alleviation should be improved to enhance the performance of Si and Ge anodes.
Recently, tremendous efforts have been contributed to study the Si/Ge heterogeneous structures, such as nanostructured Si(1−x)Gex for tunable thin film lithium-ion battery anodes,24 SixGe1−x nanoparticles,31 Si–Ge core–shell nanowires and Ge–Si core–shell nanowires.32 Although the above examples have expressed the good rate performance benefiting from the contribution of Ge, their cycling stability is still unsatisfied due to the dramatic volume changes. To address this problem, the hollow structures like Si/Ge double-layered nanotube arrays and crystalline Si/Ge hollow particles have been introduced.33–35 Although their cycling stability has been developed, the involved synthetic processes such as chemical vapor deposition and electro-reduction are too expensive for large-scale application. Therefore, it is of great significance to realize a simple method to synthesize Si/Ge composites with unique morphology, good volume alleviation as well as good electrochemical performance.
Herein, we report a simple method to synthesize the uniform SiGe@C porous microparticles with the modification of our previous paper.36 Such a design of the porous and core–shell structure can buffer the volume change and enhance the conductivity. Furthermore, the addition of Ge has obtained multiple highlights: (1) the addition of Ge can act as the buffer layer which helps to hold up the huge volume change of Si. (2) The combination of Ge to Si can obtain relatively high lithium ion diffusivity and electrical conductivity, which is beneficial for its good rate performance. (3) During the process of lithiation, Ge first reacts with lithium at ∼0.42 V while Si reacts with lithium at ∼0.15 V, indicating that the volume expansion of Si and Ge will not happen at the same time, which helps to release the swelling stress and improve the structural integrity profiting from this synergistic effect. Therefore, the good cycling and rate performance of PoSiGe@C can be expected.
2. Experimental
2.1 Synthesis of SiGe@C porous microparticles
Mg2Si (purity, >99%) and Mg2Ge (purity, >99%) powder were purchased from Alfa Aesar. Bare SiGe porous microparticles (PoSiGe) were synthesized via the following procedures. Typically, Mg2Si, Mg2Ge and grinding balls with a mass ratio of 1![[thin space (1/6-em)]](https://www.rsc.org/images/entities/char_2009.gif) :
:![[thin space (1/6-em)]](https://www.rsc.org/images/entities/char_2009.gif) 0.4
0.4![[thin space (1/6-em)]](https://www.rsc.org/images/entities/char_2009.gif) :
:![[thin space (1/6-em)]](https://www.rsc.org/images/entities/char_2009.gif) 2.6 were ground in a planetary ball mill (QM-3SP2, Nanjing University Company) at 400 rpm for 3 h. After the ball-milling process, the mixture was then heated to 650 °C at a heating rate of 5 °C min−1 under air atmosphere, keeping for 12 h in the furnace. After cooling down to room temperature, the powder was washed with hydrochloric acid (HCl) solution to remove MgO. Final product was obtained after a centrifuging process using the deionized water and alcohol for three times, respectively. Thermal decomposition of acetylene gas was carried out at 600 °C for 3 h in a quartz furnace to deposit the carbon layer. In addition, the bare Si and Si@C porous structures were synthesized via the same procedure in absence of Mg2Ge.
2.6 were ground in a planetary ball mill (QM-3SP2, Nanjing University Company) at 400 rpm for 3 h. After the ball-milling process, the mixture was then heated to 650 °C at a heating rate of 5 °C min−1 under air atmosphere, keeping for 12 h in the furnace. After cooling down to room temperature, the powder was washed with hydrochloric acid (HCl) solution to remove MgO. Final product was obtained after a centrifuging process using the deionized water and alcohol for three times, respectively. Thermal decomposition of acetylene gas was carried out at 600 °C for 3 h in a quartz furnace to deposit the carbon layer. In addition, the bare Si and Si@C porous structures were synthesized via the same procedure in absence of Mg2Ge.
2.2 Characterization of the products
The crystal structures of the materials were measured by a high power X-ray diffraction (XRD) on a Rigaku D/max-ga X-ray diffractometer, where the Cu K radiation was 1.54 Å. The morphology and structure of the materials were characterized by scanning electron microscopy (SEM, HITACH S4800) and transmission electron microscopy (TEM, PHILIPS F200). Energy dispersive spectroscopy (EDS) patterns were recorded by a Tecnai G2 F20 Chemi STEM attached with an Oxford X-Max 80T EDX detector system. Raman spectra were recorded on a HR800 Raman spectrometer using the 514 nm line of an Ar ion laser operated at 10 mW. Thermogravimetric analysis (TGA) was conducted using a SDT Q600 V8.2 Build 100. Brunauer–Emmett–Teller (BET) surface area and pore volume were recorded using a Beckman Coulter Omnisorp100cx.2.3 The electrochemical performance of the products
To determine the electrochemical properties of the products, coin-type half cells composed of the active materials (SiGe, PoSiGe@C or PoSi@C) as the working electrode and the lithium metal as the counter-electrode were prepared in an Ar-filled glove box (Mbraun, labstar, Germany). The work electrode was made of the active materials, super P carbon black, and sodium carboxymethyl cellulose (Aldrich) binder in a weight ratio of 70![[thin space (1/6-em)]](https://www.rsc.org/images/entities/char_2009.gif) :
:![[thin space (1/6-em)]](https://www.rsc.org/images/entities/char_2009.gif) 15
15![[thin space (1/6-em)]](https://www.rsc.org/images/entities/char_2009.gif) :
:![[thin space (1/6-em)]](https://www.rsc.org/images/entities/char_2009.gif) 15. The electrolyte solution was composed of 1 M LiPF6 in ethylene carbonate/dimethyl carbonate (EC/DMC, 1
15. The electrolyte solution was composed of 1 M LiPF6 in ethylene carbonate/dimethyl carbonate (EC/DMC, 1![[thin space (1/6-em)]](https://www.rsc.org/images/entities/char_2009.gif) :
:![[thin space (1/6-em)]](https://www.rsc.org/images/entities/char_2009.gif) 1 in volume). 5 vol% fluoroethylene carbonate (FEC) was added in the electrolyte solution. Before the test, the cells were aged for 24 h. Charge and discharge were cycled on a Land CT2001A system at the potentials between 0.01 and 1.5 V. Cyclic voltammetry was also carried out on an Arbin BT 2000 system at a scan rate of 0.1 mV s−1. The electrochemistry impedance spectroscopy (EIS) was measured on a CHI660D electrochemistry workstation, the amplitude used to the cells was 5 mV and the frequency range was from 0.01 Hz to 100 kHz.
1 in volume). 5 vol% fluoroethylene carbonate (FEC) was added in the electrolyte solution. Before the test, the cells were aged for 24 h. Charge and discharge were cycled on a Land CT2001A system at the potentials between 0.01 and 1.5 V. Cyclic voltammetry was also carried out on an Arbin BT 2000 system at a scan rate of 0.1 mV s−1. The electrochemistry impedance spectroscopy (EIS) was measured on a CHI660D electrochemistry workstation, the amplitude used to the cells was 5 mV and the frequency range was from 0.01 Hz to 100 kHz.
3. Results and discussion
SiGe porous microparticles are achieved via the annealing of Mg2Si/Mg2Ge composites, and subsequent acid treatment. Firstly, Mg2Si and Mg2Ge are not stable at high temperatures and can decompose to Mg and M (M = Si, Ge). Specially, Mg is very active and can be oxidized easily even under an atmosphere of low oxygen content. Meanwhile, the consumption of Mg can boost the further decomposition of Mg2Si and Mg2Ge, until they completely convert to M (M = Si, Ge) and MgO. Then, the PoSiGe can be obtained via the acid pickling to totally remove the by-product (MgO). The X-ray diffraction (XRD) analysis has been employed to illustrate the above-mentioned process (Fig. 1a). As can be seen, the peaks of the initial Mg2Si/Mg2Ge composites are consistent with cubic Mg2Si (JCPDS No. 01-075-0445) and cubic Mg2Ge (JCPDS No. 02-1135).36 After the annealing process, the peaks of Mg2Si and Mg2Ge disappear, while the peaks of MgO, Si and Ge emerge, indicating the complete transformation from Mg2M to MgO and M (M = Ge, Si). After the acid treatment, MgO is removed by HCl solution, at the same time, only Si and Ge peaks can be detected. It can be seen that the apparent diffraction peaks at 28°, 47°, 56° are typical Si peaks which are assigned to its {111}, {220}, and {311} planes respectively. The rest diffraction peaks located at 27°, 45°, 53° are corresponding to the {111}, {220}, and {311} planes of crystalline cubic Ge. It should be mentioned that the peaks of crystalline cubic Ge are wider than standard peaks because of its the composed nano-sized particles, according to the Scherrer formula. According to the result of EDS in Fig. 1b, the weight ratio of Si to Ge is measured to 3![[thin space (1/6-em)]](https://www.rsc.org/images/entities/char_2009.gif) :
:![[thin space (1/6-em)]](https://www.rsc.org/images/entities/char_2009.gif) 2, which is roughly agreed with the initial ratio of Mg2Si and Mg2Ge.
2, which is roughly agreed with the initial ratio of Mg2Si and Mg2Ge.
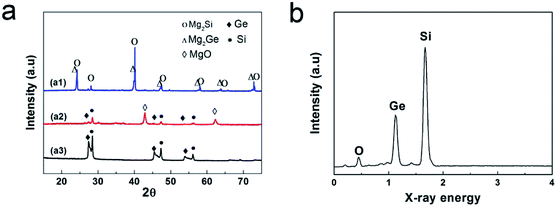 | ||
| Fig. 1 (a) Evolution of the XRD pattern from the raw Mg2M (M = Si, Ge) materials to the PoSiGe. (b) EDS pattern of the as-synthesized PoSiGe. | ||
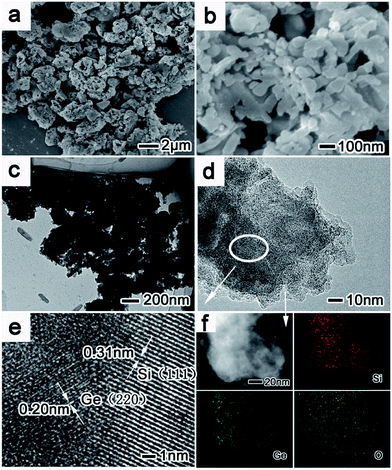
The morphology of PoSiGe is further investigated through the scanning electron microscopy (SEM) and transmission electron microscopy (TEM) analysis. From the low magnification SEM image of Fig. 2a, all particles of the sample show porous structure with the size of 0.5–3 μm. And clear porous features are demonstrated by the magnified SEM image (Fig. 2b), in which the pores with a diameter of tens of nanometers distribute uniformly in the whole particle. The characteristic of porosity is also exhibited by the TEM image (Fig. 2c). Furthermore, the high-resolution TEM (HRTEM) image provides more details that go deep into the crystal lattice. As shown in Fig. 2e, the wide lattice fringes of 0.31 nm are well-matched to the {111} crystal planes of Si, while the narrow lattices are measured to be 0.2 nm which are corresponding with the {220} crystal planes of Ge. The element distribution is further studied by the energy-dispersive X-ray (EDX) underscanning TEM (STEM) mode. Elements mapping is measured in Fig. 2f, which shows a uniform distribution of Si and Ge.
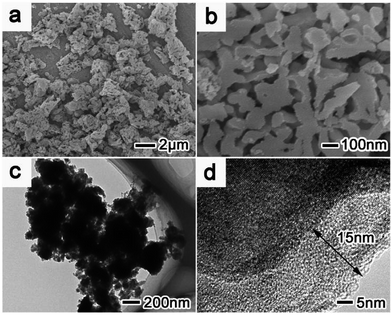
The carbon layer has been further coated onto the surface of PoSiGe via the pyrolysis of acetylene. Fig. 3 shows the morphological and structural characterization of PoSiGe@C. It can be seen from Fig. 3a–b that the porous structures have been retained after the deposition of the carbon layer. However, the pores seem shrinking and the surface of the particles turns to smooth due to the deposition of carbon layer. Fig. 3c–d show the TEM and HRTEM images of an individual PoSiGe@C particle, which further confirms the porous structures. Moreover, the carbon layer with a thickness of ∼15 nm is identified by the HRTEM image.
Fig. 4a shows the Raman spectrum of the as-synthesized PoSiGe@C. As observed, two characterization peaks located at 1340 cm−1 (D band) and 1580 cm−1 (G band) represent the amorphous and graphitizing features of the carbon layer, respectively.22 Another two peaks located at 293 cm−1 and 516 cm−1 correspond to the vibration of Ge–Ge and Si–Si,25 indicating the co-existing of Ge and Si components. It should be mentioned that no Si–Ge peaks can be observed. The carbon content in the products is identified by thermal gravity analysis (TGA) in Fig. 4b. From the TGA curve, a fast mass fading is observed between 400 °C and 550 °C, following with a stable zone at higher temperatures. The above mass loss is due to the oxidation of carbon into gaseous pieces.37 Accordingly, it is roughly estimated that the content of the carbon is 20.6 wt%. Besides, it should be mentioned that the content of carbon can be adjusted by the reacting conditions such as the reacting temperature and time. Furthermore, XPS spectra have been employed in the Fig. 4c–d to analyze the state of Si and Ge. It shows that Ge mainly exist in 0+ vacancy and a small part of Ge exist in 4+ vacancy. Therefore, it can be proved that the final product contains a large amount of germanium rather than germanium dioxide. Similarly, Si mainly exists in 0+ vacancy and a small part of Si exist in 4+ vacancy.
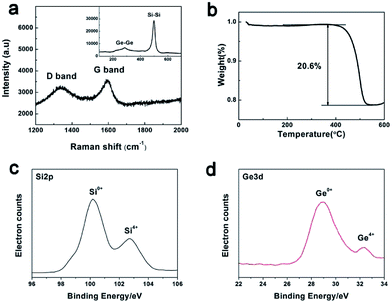 | ||
| Fig. 4 Characterization of the PoSiGe@C: (a) Raman spectrum; (b) TGA analysis showing the content of carbon component; (c) Si2p spectra of XPS; (d) Ge3d spectra of XPS. | ||
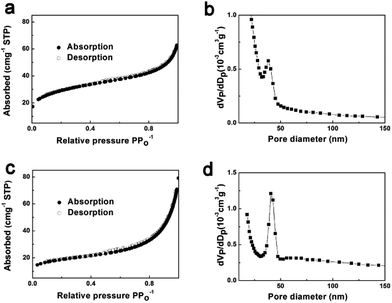
To further study the porosity of the composite, Fig. 5a–d show the isotherm curve from Brunauer–Emmett–Teller (BET) analysis and the pore size distribution of the PoSiGe and PoSiGe@C, respectively. It can be measured that the PoSiGe have a BET surface area of 70.35 m2 g−1 with an average BJH pore diameter of ∼40 nm. After the carbon coating process, the PoSiGe@C shows a smaller BET surface area of 62.08 m2 g−1 and similar pore size distribution. It is the porous microstructures that can facilitate fast lithium-ion diffusion and accommodate the volume change during the lithiation and delithiation, resulting in excellent electrochemical performance.
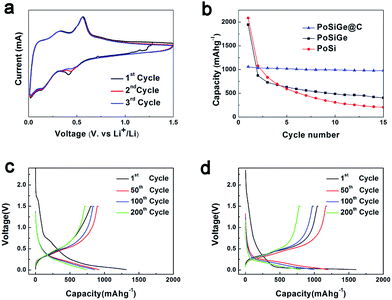
As anodes of the lithium-ion batteries, the lithiation/delithiation process of the PoSiGe@C electrodes are investigated by cyclic voltammetry (CV) curves which cycled between 0.01 and 1.5 V at a scanning rate of 0.1 mV s−1. As shown in the first discharge process (Fig. 6a), the cathodic peak located at 0.42 V is contributed to the Li-alloying reaction with Ge, and another cathodic peak at 0.14 V is attributed to the lithiation of Si.24 In terms of the first charge process, there are two anodic peaks occurring at 0.34 and 0.55 V during the delithiation process for Ge electrode.7 And similarly two peaks at 0.33 and 0.49 V can be attributed to Si electrode.38 Therefore, the two peaks are supposed to the dealloying reactions of Li–Ge as well as Li–Si. In addition, the cathodic peak at ∼0.42 V shifts to higher voltage during the next two cycles, which is related with change of Ge or Si from crystalline to amorphous after the first delithiation process.25 It should be pointed out that no other change appears in the second and third cyclic voltammetry curves, suggesting the good cycling stability. The cycling performance of the bare Si, PoSiGe and PoSiGe@C are evaluated at 0.4 A g−1 between 0.01 and 1.5 V (Fig. 6b). It can be seen that the bare Si shows the rapid capacity fade, resulting in a capacity of 205 mA h g−1 after 15 cycles with only 10% capacity retention. For comparison, the PoSiGe exhibit better cycling performance than bare Si, which expresses a capacity of 403 mA h g−1 after 15 cycles and achieve relatively high capacity retention of 20%. The addition of Ge can improve the electric conductivity, which may be responsible for the improved cycling stability. However, the performance of PoSiGe is still unsatisfied because the porous structure can buffer the volume change to some extent,18,37 which can't prevent the further pulverization and capacity fading. Furthermore, the remarkable improved cycling stability is demonstrated by the PoSiGe@C electrode, which delivers a high reversible capacity of 978 mA h g−1 after 15 cycles with 92.3% capacity retention. It is indicated that the carbon layer can protect the SiGe from side reaction with the electrolyte and stabilize the structure during the alloying/de-alloying process, which facilitate the cycling performance.
To further compare the electrochemical characteristics of the PoSiGe@C and PoSi@C electrodes, voltage profiles at a current density of 0.8 A g−1 between 0.01 and 1.5 V are recorded in Fig. 6c–d. At the first discharge process, voltage plateau appears at ∼0.6 V, which is owing to the reaction between Li and GeO2. The voltage plateau at 0.6 V is consistent with the charge–discharge profiles of Ge/GeO2 anode in previous paper.39 At the following cycles, the discharge voltage plateau of PoSiGe@C turns into the sloping curves starting from 0.5 V, and the sloping curves of PoSi@C starting from the lower voltage of 0.25 V, because Ge reacts with Li at higher voltage than Si. Moreover, the capacity retention of PoSiGe@C electrode is better than PoSi@C, indicating the better cycling stability of PoSiGe@C.
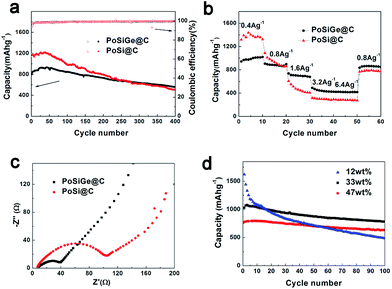
Fig. 7a shows the long-term cycling performance for both PoSiGe@C and PoSi@C electrodes. As described, the PoSiGe@C shows the initial charge capacity of 800 mA h g−1 and decreases to 560 mA h g−1 after 400 cycles with 70% capacity retention. In comparison, the PoSi@C display an initial charge capacity of 1153 mA h g−1 and decrease to 500 mA h g−1 after 400 cycles with only 43% capacity retention. Although the PoSiGe@C exhibit lower initial capacity due to the relatively lower theoretical capacity of Ge, the capacity of the PoSiGe@C surpass the PoSi@C after 280 cycles, indicating the better cycling stability. Besides, the corresponding coulombic efficiency of PoSiGe@C quickly increase from 63% for the first cycle to 98% after 6 cycles, and further reach a stable value of 99.5% after several cycles. The high coulombic efficiency is very meaningful especially for the full-cells that contain limited lithium. What is more, the rate capability of both PoSiGe@C and PoSi@C electrodes is recorded in Fig. 7b. At the current density of 0.4, 0.8, 1.6, 3.2, and 6.4 A g−1, the PoSiGe@C achieve capacities of 1000, 870, 690, 440, and 420 mA h g−1, respectively. For comparison, the PoSi@C display capacities of 1380, 920, 450, 290, and 280 mA h g−1, respectively. It is obvious that the PoSiGe@C delivers better rate capability than PoSi@C. Especially, the capacity of PoSiGe@C is recovered to 860 mA h g−1 when the current is returned to 0.8 A g−1, while the PoSi@C can only restore to 780 mA h g−1. The better cycling and high-rate performance of PoSiGe@C can be attributed to the integration of Ge that can give higher lithium-ion diffusivity and electrical conductivity.
In order to intuitively illustrate the advantage of Ge, electrochemical impedance spectroscopy (EIS) was measured on the above-mentioned two electrodes. As displayed in Fig. 7c, all the spectra consist of a depressed semicircle in the high-to-medium frequency range and a straight line in the low frequency range. It is clearly that the diameter of the semicircle in the PoSiGe@C electrode is smaller than that of the PoSi@C electrode, indicating lower charge-transfer impedances. This is due to the addition of Ge that improves the electrical conductivity of the electrode. The effects of Ge on the electrochemical performance of PoSiGe@C electrode have been also investigated. Fig. 7d presents the discharge capacity vs. cycle number with the different Ge contents at a current density of 0.4 A g−1. It can be seen that, sample A with 47 wt% Ge shows an initial reversible capacity of 777 mA h g−1 and decreases to 632 mA h g−1 after 100 cycles, with the capacity retention of 81.3%. In contrast, the initial reversible capacities of sample B (Ge, 33 wt%) and sample C (Ge, 12 wt%) are 1030 and 1621 mA h g−1, which decreases to 783 and 487 mA h g−1 after 100 cycles, indicating the capacity retention of 76.0% and 30.0%, respectively. It can be concluded that the sample with higher Ge contents can exhibit better cycling performance. This result can further confirm the role of Ge that can improve the lithium ion diffusivity and electrical conductivity.
4. Conclusions
In summary, PoSiGe@C was synthesized via the transformation of Mg2Si/Mg2Ge composites, and the pyrolysis of acetylene. When used as anode materials of lithium-ion batteries, the as-synthesized PoSiGe@C deliver a capacity of 560 mA h g−1 with 70% capacity retention after 400 cycles and only 0.075% capacity loss per cycle at the current density of 0.8 A g−1. Moreover, PoSiGe@C shows better cycling and rate performance compared to PoSi@C. The higher content of Ge can lead to better cycling performance. It is indicated that the addition of Ge can improve the lithium ion diffusivity and electrical conductivity, which result in the better cycling and rate performance.Conflict of interest
There are no conflicts of interest to declare.Acknowledgements
The authors would like to appreciate the financial supports from the Fundamental Research Funds for the Central Universities (2016FZA4007) and the Program for Innovative Research Team in University of Ministry of Education of China (IRT13R54).References
- J. M. Tarascon and M. Armand, Nature, 2001, 414, 359–367 CrossRef CAS PubMed.
- Y. Sun, N. Liu and Y. Cui, Nat. Energy, 2016, 1, 16071 CrossRef CAS.
- H. Gao, I. Plümel, L. Xiao, G. Xu, Y. Ren, X. Zuo, Y. Liu, C. Schulz, H. Wiggers, K. Amine and Z. Chen, Nano Lett., 2017, 17, 1512–1519 CrossRef CAS PubMed.
- V. Aravindan, Y. Lee and S. Madhavi, Adv. Energy Mater., 2015, 5, 140225 Search PubMed.
- T. Kennedy, M. Brandon and K. M. Ryan, Adv. Mater., 2016, 28, 5696–5704 CrossRef CAS PubMed.
- Z. Hu, S. Zhang, C. Zhang and G. Cui, Coord. Chem. Rev., 2016, 326, 34–85 CrossRef CAS.
- H. Jia, R. Kloepsch, X. He, J. P. Badillo, P. Gao, O. Fromm, T. Placke and M. Winter, Chem. Mater., 2014, 26, 5683–5688 CrossRef CAS.
- T. Kasukabe, H. Nishihara, K. Kimura, T. Matsumoto, H. Kobayashi, M. Okai and T. Kyotani, Sci. Rep., 2016, 7, 42734 CrossRef PubMed.
- M. Ko, P. Oh, S. Chae, W. Cho and J. Cho, Small, 2015, 11, 4058–4073 CrossRef CAS PubMed.
- M. Gu, Y. He, J. Zheng and C. Wang, Nano Energy, 2015, 17, 366–383 CrossRef CAS.
- X. Zuo, Y. Xia, Q. Ji, X. Gao, S. Yin, M. Wang, X. Wang, B. Qiu, A. Wei, Z. Sun, Z. Liu, J. Zhu and Y. Cheng, ACS Nano, 2017, 11, 889–899 CrossRef CAS PubMed.
- C. Li, T. Shi, H. Yoshitake and H. Wang, Electrochim. Acta, 2017, 225, 11–18 CrossRef CAS.
- S. J. Lee, H. J. Kim, T. M. Hwang, S. Choi, S. H. Park, E. Deniz, D. S. Jung and J. W. Choi, Nano Lett., 2017, 17, 1870–1876 CrossRef CAS PubMed.
- A. Magasinski, P. Dixon, B. Hertzberg, A. Kvit, J. Ayala and G. Yushin, Nat. Mater., 2010, 9, 353–358 CrossRef CAS PubMed.
- M. L. Terranova, S. Orlanducci, E. Tamburri, V. Guglielmotti and M. Rossi, J. Power Sources, 2014, 246, 167–177 CrossRef CAS.
- C. Y. Chou and G. S. Hwang, J. Power Sources, 2014, 263, 252–258 CrossRef CAS.
- T. D. Bogart, A. M. Chockla and B. A. Korgel, Curr. Opin. Chem. Eng., 2013, 2, 286–293 CrossRef.
- G. H. Yue, X. Q. Zhang, Y. C. Zhao, Q. S. Xie, X. X. Zhang and D. L. Peng, RSC Adv., 2014, 4, 21450–21455 RSC.
- Y. Domi, H. Usui, Y. Takemoto, K. Yamaguchi and H. Sakaguchi, Chem. Lett., 2016, 45, 1198–1200 CrossRef CAS.
- Z. Wang, Q. Su, H. Deng, W. He, J. Lin and Y. Q. Fu, J. Mater. Chem. A, 2014, 2, 13976–13982 CAS.
- S. Li, C. Chen, K. Fu, L. Xue, C. Zhao, S. Zhang, Y. Hua, L. Zhou and X. Zhang, Solid State Ionics, 2014, 254, 17–26 CrossRef CAS.
- K. H. Seng, M. H. Park, Z. P. Guo, H. K. Liu and J. Cho, Angew. Chem., Int. Ed. Engl., 2012, 51, 5657–5661 CrossRef CAS PubMed.
- W. Luo, D. Shen, R. Zhang, B. Zhang, Y. Wang, S. X. Dou, H. K. Liu and J. Yang, Adv. Funct. Mater., 2016, 26, 7800–7806 CrossRef CAS.
- P. R. Abel, A. M. Chockla, Y. M. Lin, V. C. Holmberg, J. T. Harris, B. A. Korgel, A. Heller and C. B. Mullins, ACS Nano, 2013, 7, 2249–2257 CrossRef CAS PubMed.
- N. Lin, L. Wang, J. Zhou, J. Zhou, Y. Han, Y. Zhu, Y. Qian and C. Caob, J. Mater. Chem. A, 2015, 3, 11199–11202 CAS.
- M. H. Park, Y. H. Cho, K. Kim, J. Kim, M. Liu and J. Cho, Angew. Chem., Int. Ed., 2011, 50, 9647–9650 CrossRef CAS PubMed.
- H. Kim, Y. Son, C. Park, M. J. Lee, M. Hong, J. Kim, M. Lee, J. Cho and H. C. Choi, Nano Lett., 2015, 15, 4135–4142 CrossRef CAS PubMed.
- J. Wang, N. Du, H. Zhang, J. Yu and D. Yang, J. Mater. Chem., 2011, 22, 1511–1515 RSC.
- T. Kennedy, M. Bezuidenhout, K. Palaniappan, K. Stokes, M. Brandon and K. M. Ryan, ACS Nano, 2015, 9, 7456–7465 CrossRef CAS PubMed.
- D. Duveau, B. Fraisse, F. Cunin and L. Monconduit, Chem. Mater., 2015, 27, 3226–3233 CrossRef CAS.
- M. Ge, S. Kim, A. Nie, R. Shahbazian-Yassar, M. Mecklenburg, Y. Lu, X. Fang, C. Shen, J. Rong, S. Y. Park, D. S. Kim, J. Y. Kim and C. Zhou, Nanotechnology, 2015, 26, 1–9 CrossRef CAS PubMed.
- T. Song, H. Cheng, T. Kaitlin, P. Hyunjung, R. W. Black, L. Sangkyu, W. Park II, Y. Huang, J. A. Rogers, L. F. Nazar and U. Paik, Adv. Funct. Mater., 2014, 24, 1458–1464 CrossRef CAS.
- T. Song, H. Cheng, H. Choi, J. H. Lee, H. Han, D. H. Lee, D. S. Yoo, M. Kwon, J. Choi, S. G. Doo, H. Chang, J. Xiao, Y. Huang, W. Park II, Y. Chung, H. Kim, J. A. Rogers and U. Paik, ACS Nano, 2013, 6, 303–309 CrossRef PubMed.
- M. Haro, T. Song, A. Guerrero, L. Bertoluzzi, J. Bisquert, U. Paik and G. Garcia-Belmonteal, Phys. Chem. Chem. Phys., 2014, 16, 17930–17935 RSC.
- W. Xiao, J. Zhou, L. Yu, D. Wang and X. W. Lou, Angew. Chem., 2016, 55, 7427–7431 CrossRef CAS PubMed.
- C. Xiao, N. Du, X. Shi, H. Zhang and D. Yang, J. Mater. Chem. A, 2014, 2, 20494–20499 CAS.
- Y. Li, K. Yan, H. W. Lee, Z. Lu, N. Liu and Y. Cui, Nat. Energy, 2016, 1, 15029 CrossRef CAS.
- Y. Liu, B. Chen, F. Cao, H. L. W. Chan, X. Zhao and J. Yuan, J. Mater. Chem., 2011, 21, 17083–17086 RSC.
- R. Xu, S. Wu, Y. Du and Z. Zhang, Chem. Eng. J., 2016, 296, 349–355 CrossRef CAS.
| This journal is © The Royal Society of Chemistry 2017 |

