 Open Access Article
Creative Commons Attribution 3.0 Unported Licence
Facile synthesis of uniformly dispersed ZnO nanoparticles on a polystyrene/rGO matrix and its superior electrical conductivity and photocurrent generation
M. Jeyavelana,
A. Ramesha,
R. Rathes Kannanb,
T. Soniaa,
K. Rugunandhiria and
M. Sterlin Leo Hudson *a
*a
aDepartment of Physics, Central University of Tamil Nadu, Thiruvarur-610005, India. E-mail: msterlinleo@cutn.ac.in; Tel: +91-9486860214
bDepartment of Physics, Karunya University, Coimbatore-641114, India
First published on 19th June 2017
Abstract
Herein, a ZnO/PS/rGO composite was prepared via a simple reflex method and its microstructural and physical properties were characterized using XRD, SEM, HRTEM, TGA and FTIR, UV-visible, and PL spectroscopies. DC and AC electrical conductivities of the composite were measured using a four-point collinear probe method. The charge transfer resistance and photocurrent transient response were characterized via electrochemical impedance spectroscopy. It has been observed that in the ZnO/PS/rGO composite, even a small amount of rGO (5 wt%) effectively increases its electrical conductivity. PCTR and OCVD measurements revealed that the photocurrent response of ZnO was markedly improved when it was used in the composite ZnO/PS/rGO form; this suggested the viability of the ZnO/PS/rGO composite for practical applications.
1. Introduction
Semiconducting nanostructures have recently gained extensive interest owing to their potential applications in solar cells, nanoscale electronic devices, light-emitting diodes, laser technology, waveguide, chemical- and bio-sensors, photocatalysis, photoelectrodes etc.1–3 Among different semiconducting nanostructures, ZnO is a very promising candidate due to its wide direct band gap of 3.3 eV at room temperature. Moreover, the absorption spectra of ZnO lies in the near-UV region, and it has a large room-temperature free-exciton binding energy of 60 meV.4 A recent study revealed that by altering the electronic configuration of ZnO nanoparticles through capping with organic molecules, it is possible to induce room-temperature ferromagnetic-like behavior without doping any magnetic impurities.5 Because of its unique properties, ZnO has attracted significant attention as an important semiconducting material for technological applications.4–6 Furthermore, the nano form of ZnO exhibits very high electron mobility of ∼1000 cm2 V−1 s−1,7,8 which is more favorable for photoinduced electron collection in photovoltaic devices.9,10 However, due to the intrinsic structural defects, ZnO has a low electrical conductivity of 7.261 × 10⁻⁷ S cm−1 at room-temperature.11 Even in its nano form, ZnO exhibits electrical conductivity in the range from 10−6 to 10−4 S cm−1.12 The low electrical conductivity of ZnO hinders its practical applications in photovoltaic devices, where improved electrical conductivity and low charge recombination loss are required for better photocurrent conversion efficiency.13 More recently, graphene, a single, atomic thick 2D allotrope of carbon, has attracted significant attention due to its exceptional electrical, thermal, and mechanical properties associated with its unique structure consisting of sp2-hybridized carbon atoms packed in a two-dimensional honeycomb crystal lattice.14–18 Graphene has an excellent electrical conductivity of 3.49 × 10⁻² S cm−1.19 Furthermore, graphene exhibits very high carrier mobility of ∼10![[thin space (1/6-em)]](https://www.rsc.org/images/entities/char_2009.gif) 000 cm2 V−1 s−1 at room temperature,20 high specific surface area of over 2000 m2 g−1,21 good optical transparency of ∼97.7%,22 high Young's modulus of nearly 1 TPa,23 and high thermal conductivity in the range of 3000–5000 W m−1 K−1.24 As a result of the abovementioned unique properties of graphene, graphene-based polymer composites have been reported to have superior electrical, mechanical, and thermal properties.25–28 Polystyrene (PS) is one of the most widely used polymers for many commercial and industrial applications such as in home appliances, medical devices, automobiles etc. It has been reported that PS/reduced graphene oxide (rGO) composite shows superior electrical conductivity in the presence of a very small amount of rGO in the composite (for example: 0.2268 S cm−1 for PS/4 wt% rGO composite).23,30–32 Herein, we report the facile synthesis of a ZnO/PS/rGO composite, having 40 wt% ZnO, 55 wt% PS, & 5 wt% rGO, and its superior electrical conductivity (AC and DC) and high photo-current response. The ZnO/PS/rGO composite may possess multiple applications in electronic devices such as highly efficient photoanodes in photovoltaic devices and flexible electronic applications.
000 cm2 V−1 s−1 at room temperature,20 high specific surface area of over 2000 m2 g−1,21 good optical transparency of ∼97.7%,22 high Young's modulus of nearly 1 TPa,23 and high thermal conductivity in the range of 3000–5000 W m−1 K−1.24 As a result of the abovementioned unique properties of graphene, graphene-based polymer composites have been reported to have superior electrical, mechanical, and thermal properties.25–28 Polystyrene (PS) is one of the most widely used polymers for many commercial and industrial applications such as in home appliances, medical devices, automobiles etc. It has been reported that PS/reduced graphene oxide (rGO) composite shows superior electrical conductivity in the presence of a very small amount of rGO in the composite (for example: 0.2268 S cm−1 for PS/4 wt% rGO composite).23,30–32 Herein, we report the facile synthesis of a ZnO/PS/rGO composite, having 40 wt% ZnO, 55 wt% PS, & 5 wt% rGO, and its superior electrical conductivity (AC and DC) and high photo-current response. The ZnO/PS/rGO composite may possess multiple applications in electronic devices such as highly efficient photoanodes in photovoltaic devices and flexible electronic applications.
2. Experimental
2.1 Synthesis of graphite oxide (GO)
Graphite oxide (GO) was prepared from graphite powder by a modified Hummers method.33 In each experiment, 2 g of graphite powder (Sigma Aldrich, 98%) was mixed with 2 g of NaNO3 in 100 ml H2SO4 (98%), followed by the slow addition of 12 g KMnO4 under constant stirring in an ice-cooled bath. After about an hour of stirring at 0 °C, the bath temperature was increased to 35 °C and stirring was continued for 2 hours. Afterwards, the bath temperature was further increased to 90 °C, and 80 ml of H2O was gradually added dropwise into the mixture. The mixture was then diluted with 200 ml of H2O, followed by the addition of 20 ml of 30 wt% H2O2 solution. The as-obtained brown dispersion was then subjected to centrifugation at 6500 rpm for 20 min. The mixture was rinsed and washed with 5% HCl in deionized water. The resultant dark brown GO was dried at 80 °C in a hot air oven.2.2 Preparation of the PS/rGO composite
About 40 mg of GO was dispersed in 20 ml of N,N-dimethylformamide (DMF), and the solution (2 mg ml−1) was subjected to ultrasonic treatment for 2 hours at room temperature. Then, 800 mg of polystyrene (PS), dissolved in 3 ml of DMF, was added to the GO-dispersed DMF solution under constant stirring at 50 °C. The temperature of the mixture was then increased to 80 °C and stirring was continued for 2 hours at 1000 rpm. Afterwards, 200 μl of hydrazine hydrate was added dropwise to the mixture to reduce GO and stirring was continued at 90 °C for 14 hours until the mixture turned from brownish yellow to black. The hydrazine hydrate-treated GO has been denoted as reduced GO (rGO) throughout the manuscript. The mixture was then transferred to a large beaker and vigorously stirred with methanol to coagulate the composite, which was then filtered and dried overnight in a hot air oven at 80 °C. The resultant PS/rGO composite was obtained and subjected to further characterization.2.3 Synthesis of the ZnO/PS/rGO composite
First, zinc precursor was prepared by dissolving 2 g of zinc acetate (Zn(CH2COO)2·2H2O) in 30 ml DMF. The solution was stirred for 30 min at 40 °C, followed by the addition of tetramethylammonium hydroxide (0.1 M in 20 ml of DMF). Then, the temperature of the mixture was increased to 120 °C and maintained for 3 hours until a milky white precipitate was formed. The as-prepared PS/rGO solution was added to the abovementioned mixture under constant stirring and kept at 120 °C for 6 hours. The composite was centrifuged (7000 rpm) for 15 min at 25 °C. The as-obtained composite was repeatedly washed with methanol and dried at 80 °C in a hot air oven for 12 hours.2.4 Structural, microstructural, optical, and thermal analysis
Structural analysis of the sample was carried out via X-ray diffraction (XRD) techniques using a Shimadzu X-ray diffractometer equipped with Cu Kα radiation of wavelength λ = 1.5401 Å. The microstructural morphologies of the samples were characterized using a JEOL scanning electron microscope (SEM) and a Tecnai G2 20 (200 kV) high resolution transmission electron microscope (HR-TEM). Fourier transform infrared (FTIR) spectra and Raman spectra were obtained using Perkin Elmer UATR Two and EZRaman-N-785 spectrometers, respectively. The optical absorption spectra were obtained between 200 and 800 nm using a Shimadzu UV-1800 spectrophotometer. Thermogravimetric analysis (TGA) of the samples was conducted between 35 °C and 600 °C at the dynamical heating rate of 10 °C min−1 using a Perkin Elmer STA 8000 TGA analyser. The PS and ZnO/PS/rGO films, having the dimensions 80 mm × 25 mm × 0.8 mm and 80 mm × 25 mm × 1 mm, respectively, were prepared via hot-press at 120 °C. The tensile properties of the as-prepared PS and ZnO/PS/rGO films were investigated using a universal testing machine (UTM) by employing ASTM D2256.2.5 Electrical and photoelectrochemical characterization
DC electrical conductivity measurements were carried out using a Keithley 4200-SCS semiconductor characterization system along with an Everbeing INTL Corp four-point collinear probe-station. The AC impedance spectra were obtained in the frequency range from 500 mHz to 1 MHz using a BioLogic VSP-300 electrochemical workstation. The AC impedance, photocurrent transient response (PCTR), and open circuit voltage decay (OCVD) measurements were carried out using a BioLogic VSP-300 three-electrode cell electrochemical workstation, along with a standard three-compartment cell under UV light irradiation (300 W mercury lamp). Typically, for PCTR measurements, 2 g of ZnO or ZnO/PS/rGO composite was added to 2 ml of ethanol to make a viscus paste, and it was coated on an ITO glass substrate, having sheet resistance of 8–12 Ω sq−1 (Sigma Aldrich), using a doctor-blading technique. The as-prepared ZnO/ITO and ZnO/PS/rGO/ITO films were dried at 200 °C on a hot plate for 30 min. The ZnO/ITO and ZnO/PS/rGO/ITO film with an active area of 0.64 cm2 was used as working electrodes. Additionally, Pt wire and Ag/AgCl electrodes were used as the counter electrode and the reference electrode, respectively. Moreover, 0.2 M Na2SO4 was used as an electrolyte for the electrochemical studies. The potential of the working electrode was set at 0 V against the Pt wire counter electrode. The DC conductivity of the samples was measured by the four-point collinear probe method using Keithley 4200-SCS.3. Results and discussion
3.1 Structural and microstructural analysis
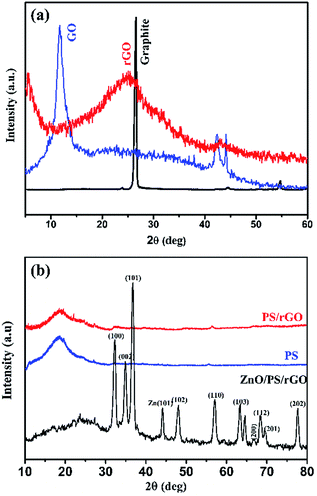
Fig. 1(a and b) represents the X-ray diffractograms of graphite, GO, rGO, PS, PS/rGO, and ZnO/PS/rGO composites. The characteristic strong intensity peak corresponding to the interlayer spacing of graphite (0.335 nm observed at 26.5°) shifted to 11.6° after its oxidation (GO), indicating a significant increase in the interlayer spacing of 0.761 nm due to the attachment of oxygen functional groups between graphitic layers. The peaks corresponding to GO, observed at 42° and 45°, originated from the unreacted graphitic phases present in GO.34 The XRD pattern of rGO displays a weak and broad diffraction peak at 25.08°, showing a reduced interlayer spacing of 0.354 nm due to the removal of oxygen functional groups from GO.35 The XRD pattern of PS shows a broad peak at 19.7°, attributed to the weak intermolecular van der Waals forces induced by the polymer chains.36,37 The peaks corresponding to the hexagonal wurtzite lattice of ZnO38 is discernible in the XRD pattern of the ZnO/PS/rGO composite. Additionally, the background hump between 11.6° and 30° in the XRD pattern of the ZnO/PS/rGO composite is due to the presence of the PS matrix.Fig. 2(a–d) shows the SEM images of GO, rGO, PS/rGO, and ZnO/PS/rGO composites, and Fig. 2(e and f) displays the TEM images of the ZnO/PS/rGO composite. As inferred from the SEM images of GO and rGO (Fig. 2(a and b)), the characteristic wave-like morphology was observed. In Fig. 2(b), it can be observed that the wave-like morphology is not as smooth as that shown in Fig. 2(a). This indicates the re-stacking of the individual sheets via van der Waals interactions after the removal of the oxygen functional groups from the basal planes and from the edges of GO. Furthermore, it is also evident from the XRD pattern of rGO that the d-spacing decreases after the reduction of GO.
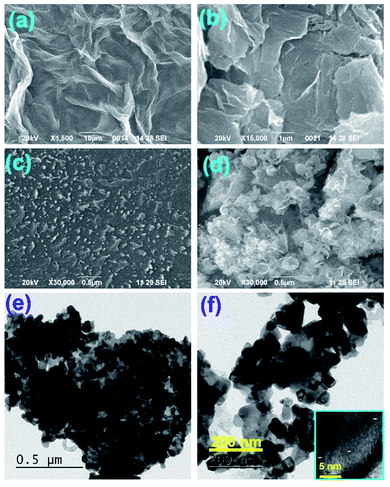 | ||
| Fig. 2 SEM images of (a) GO, (b) rGO, (c) PS/rGO, and (d) ZnO/PS/rGO. TEM images of the ZnO/PS/rGO composite are shown in (e) & (f) and the inset shows the HR-TEM image. | ||
The SEM image of PS/rGO displays the uniform dispersion of rGO on the PS matrix, suggesting the formation of the PS-rGO networks. On the other hand, the SEM image of the ZnO/PS/rGO composite shows the decoration of ZnO in the composite. The HR TEM images of the ZnO/PS/rGO composite show well-defined ZnO lattice fringe separations of 0.23 nm and 0.21 nm corresponding to the (101) and (101) planes (as shown in the inset of Fig. 2(f)), which reveals the strong crystalline nature of the ZnO nanostructures in the composite. Furthermore, the ZnO nanoparticles were found to be uniformly dispersed in the composite.
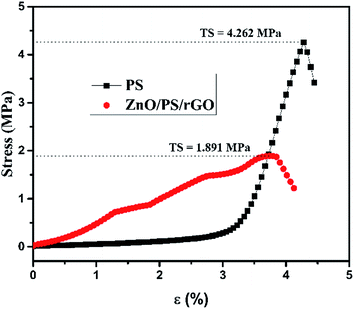
Fig. 3 represents the tensile strength of the PS and ZnO/PS/rGO films determined using ASTM D2256.
The tensile strength TS of PS and ZnO/PS/rGO are 4.262 MPa and 1.891 MPa, respectively. It was observed that the tensile strength of PS reduced to 45% while the composite ZnO/PS/rGO was formed. The reduction in the tensile strength of the composite is due to the presence of 5 wt% of rGO and 40 wt% of ZnO in addition to 55 wt% of PS. Our results show that the ZnO/PS/rGO composite exhibits polymer characteristics such as tensile strength and percentage elongation. However, higher content of ZnO in the composite may lower the tensile properties of the composite.
3.2 Spectral analysis
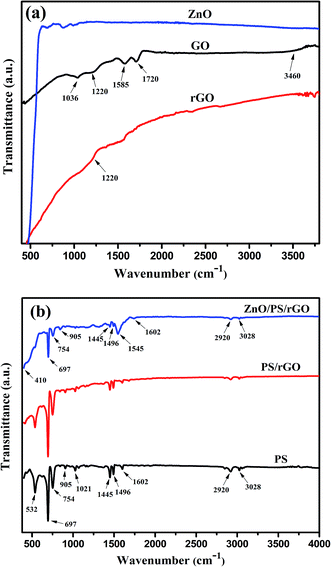
The series of strong peaks at the wavenumbers 3028, 2920, 1602, 1496, 1445, 1021, 905, 754, 697, and 532 cm−1 correspond to the characteristic peaks of benzene in PS,32 thus confirming the presence of PS in the composite. Furthermore, the two additional peaks observed in the ZnO/PS/rGO composite at 1545 cm−1 and 410 cm−1 correspond to the skeleton in-plane vibration of C![[double bond, length as m-dash]](https://www.rsc.org/images/entities/char_e001.gif) C39 and the Zn–O stretching vibration,40 respectively.
C39 and the Zn–O stretching vibration,40 respectively.
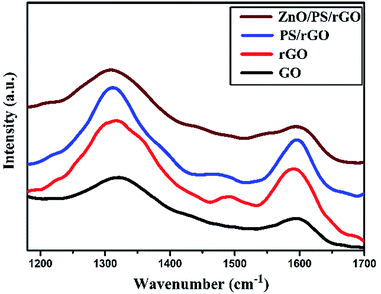
Fig. 5 displays the Raman spectra of GO, rGO, PS/rGO, and ZnO/PS/rGO composites obtained in the spectral range from 1000 to 2500 cm−1. The D-band and G-band peaks of GO were observed at 1322 cm−1 and 1595 cm−1, respectively. However, for rGO, there was a slight shift in the D-band and the G-band, which were observed at 1317 cm−1 and 1591 cm−1, respectively. The D/G band intensity (ID/IG) ratio decreases from 1.41 to 1.27 after the reduction of GO. This signifies decrease in the defect densities of GO after its reduction. For the PS/rGO composite, the D-band and G-band peaks were observed at 1310 cm−1 and 1595 cm−1, respectively, with the ID/IG ratio of 1.3, slightly higher than that of rGO. This could be ascribed to the non-covalent π–π interactions between the PS scaffold and basal planes of rGO.41 However, for the ZnO/PS/rGO composite, the ID/IG ratio is 1.4, higher than that observed for PS/rGO due to the difference in the concentration of PS in the composite. In ZnO/PS/rGO, the concentration of PS is 55 wt%, whereas in the PS/rGO composite, it is 95 wt%.
![[double bond, length as m-dash]](https://www.rsc.org/images/entities/char_e001.gif) C bond and the n–π* transition of the C
C bond and the n–π* transition of the C![[double bond, length as m-dash]](https://www.rsc.org/images/entities/char_e001.gif) O bond in rGO, respectively. The peak observed at 262 nm for rGO is the red shift peak of GO at 230 nm, confirming the effective reduction of GO in the composite and the restoration of π-conjugation of rGO. Moreover, the disappearance of the 295 nm plasmon peak,42 corresponding to rGO in the PS/rGO composite, confirms the effective removal of the oxygen-containing groups after its reduction via hydrazine hydrate. As noticed in Fig. 5(a), a UV-absorption peak of ZnO is observed at 372 nm (optical bandgap of 3.33 eV) in the ZnO/PS/rGO composite, suggesting that there is no change in the optical band gap of ZnO in the composite. The room temperature PL spectra of PS, PS/rGO, and ZnO/PS/rGO composites, obtained in the range of 290–550 nm, show a PL emission peak at 332 nm with an excitation wavelength of 265 nm. Additionally, emission peaks of ZnO were observed in the ZnO/PS/rGO composite. For comparison, the PL emission spectra of pristine ZnO corresponding to an excitation wavelength of 370 nm is shown in the Fig. 6(b). The emission peaks due to the intrinsic defects in the ZnO crystal were observed at 422 nm, 485, and 510 nm.43,44 The intrinsic defects in ZnO are advantageous for the enhancement of the photocurrent density of the ZnO/PS/rGO composite.45
O bond in rGO, respectively. The peak observed at 262 nm for rGO is the red shift peak of GO at 230 nm, confirming the effective reduction of GO in the composite and the restoration of π-conjugation of rGO. Moreover, the disappearance of the 295 nm plasmon peak,42 corresponding to rGO in the PS/rGO composite, confirms the effective removal of the oxygen-containing groups after its reduction via hydrazine hydrate. As noticed in Fig. 5(a), a UV-absorption peak of ZnO is observed at 372 nm (optical bandgap of 3.33 eV) in the ZnO/PS/rGO composite, suggesting that there is no change in the optical band gap of ZnO in the composite. The room temperature PL spectra of PS, PS/rGO, and ZnO/PS/rGO composites, obtained in the range of 290–550 nm, show a PL emission peak at 332 nm with an excitation wavelength of 265 nm. Additionally, emission peaks of ZnO were observed in the ZnO/PS/rGO composite. For comparison, the PL emission spectra of pristine ZnO corresponding to an excitation wavelength of 370 nm is shown in the Fig. 6(b). The emission peaks due to the intrinsic defects in the ZnO crystal were observed at 422 nm, 485, and 510 nm.43,44 The intrinsic defects in ZnO are advantageous for the enhancement of the photocurrent density of the ZnO/PS/rGO composite.45
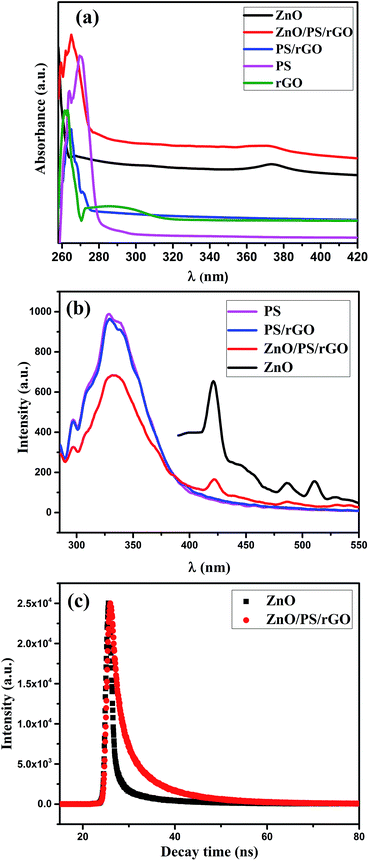 | ||
| Fig. 6 Spectral analysis of the composites: (a) UV-vis spectra, (b) PL emission spectra, and (c) time-resolved PL spectra corresponding to an excitation wavelength of 340 nm. | ||
The exponential decay curves corresponding to the lifetime of the photoexcited charge carriers, demonstrated by time-resolved photoluminescence decay studies of pristine ZnO and ZnO/PS/rGO, are shown in Fig. 6(c). The fitted parameters determined from the time-resolved PL spectra of ZnO and the ZnO/PS/rGO composite are presented in Table 1.
| Sample | B1 | τ1 (ns) | B2 | τ2 (ns) | B3 | τ3 (ns) | <τ> (ns) |
|---|---|---|---|---|---|---|---|
| ZnO | 0.007 | 1.74 | 1.03 | 0.07 | 0.001 | 11.13 | 0.10 |
| ZnO/PS/rGO | 0.013 | 6.88 | 0.05 | 1.14 | 0.001 | 19.04 | 2.59 |
Furthermore, the average lifetime of the composites can be calculated using the following expression;46
| <τ> = ΣiBiτi (second) | (1) |
The calculated average lifetime of the excited charge carriers in pristine ZnO and ZnO/PS/rGO is 0.1029 ns and 2.599 ns, respectively. The significant improvement in the lifetime of the excited charge carriers in the ZnO/PS/rGO composite reflects its better electron transport properties.47 It becomes evident that the presence of polymer and graphene in the ZnO/PS/rGO composite increases the excited charge carrier's lifetime and hence favors the rapid charge carrier transport properties of the composite.
3.3 Thermogravimetric analysis
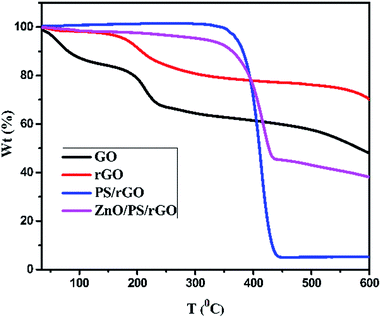
The thermal stability of GO, rGO, PS/rGO, and ZnO/PS/rGO composites was analyzed using TGA at the dynamic heating rate of 10 °C min−1. Fig. 7 presents the representative TGA curves of GO, rGO, PS/rGO, and ZnO/PS/rGO composites. A 15% weight loss was observed for GO below 100 °C, which might be due to the removal of surface adsorbed moisture and impurity gases. Nearly, 20% weight loss was observed at ∼200 °C, which is presumably due to pyrolysis of the labile oxygen-containing functional groups.41 The gradual weight loss observed between 200 °C and 600 °C might have resulted from the decomposition of carboxyl, hydroxyl, and epoxy groups at the edge and basal planes of GO.48As can be seen from Fig. 7, below 200 °C, rGO is much more thermally stable than GO due to the removal of the residual water molecules trapped in the interlayered space that leave behind few oxygen-containing functionalities between layers of rGO after a two-step chemical and thermal reduction process. For the PS/rGO composite, the initial decomposition of PS starts at ∼400 °C, and it saturates at 440 °C with ∼95% weight loss, which might have resulted from the dissociation of the main chains in PS.41 There is a slight increase in the thermal decomposition temperature of the ZnO/PS/rGO composite due to the strong interaction between PS/rGO and ZnO. The slight weight loss noticed in the temperature range from 200 to 350 °C occurred due to the elimination of oxygen-containing groups in the ZnO/PS/rGO composite. Moreover, 55% weight loss occurred at around 440 °C, which is attributed to PS, 40 wt% of ZnO, and 5 wt% of rGO present in the composite.
3.4 DC conductivity and impedance analysis
The DC conductivity of ZnO, PS/rGO, and ZnO/PS/rGO was measured at 28 °C using the four-point collinear probe method with the probe spacing of 1.59 mm. The resistivity of the sample was calculated using the following equation:
 | (2) |
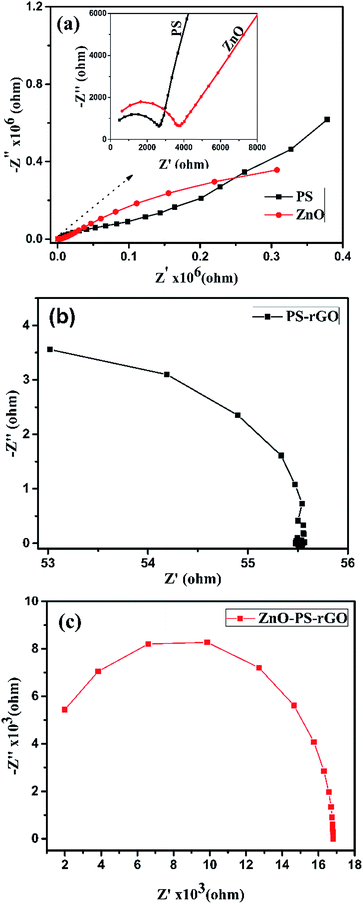
As given in Table 2, the electrical conductivity of pristine ZnO was determined to be 4.307 × 10⁻⁷ S cm−1. This value is close to that reported for the room temperature conductivity of pure ZnO (7.261 × 10⁻⁷ S cm−1).11 However, the electrical conductivity of the PS/rGO composite having 5 wt% rGO is 0.03087 S cm−1. Note that the conductivity of pure PS is about 2.45 × 10⁻¹² S cm−1,49 significantly lower than that of the PS/rGO composite used in this study. The present study reveals that the conductivity of PS can be markedly improved with the addition of small amount of rGO (5 wt% rGO was used in the present investigation). Furthermore, significantly improved conductivity was observed for the ZnO/PS/rGO composite (0.00195 S cm−1), in which the amount of ZnO and rGO is 40 wt% and 5 wt%, respectively (shown in Fig. 7). The electrical conductivity of the ZnO/PS/rGO composite is nearly 4500 times higher than that of pure ZnO because of a strong ambipolar field effect occurring in the polymer/graphene composite.29 The superior electrical conductivity of the ZnO/PS/rGO composite is more favorable for the collection of photoinduced electrons.
| Samples | ZnO | PS/rGO | ZnO/PS/rGO |
| DC electrical conductivity (S cm−1) | 4.307 × 10⁻⁷ | 0.03087 | 0.00195 |
3.5 AC impedance analysis
To understand the electronic and optoelectronic properties of ZnO, PS, PS/rGO, and ZnO/PS/rGO composites in detail, we carried out the AC-impedance spectral analysis. A pelletized sample of thickness 0.7 mm and an AC input frequency of 1 MHz to 500 mHz were used for the AC-impedance analysis. The Nyquist plots, comprising the imaginary part (Z′) vs. the real part (−Z′′), of the impedance of the composites are shown in Fig. 8(a–c).As presented in Fig. 8(b and c), the AC-impedance of the PS/rGO composite and ZnO/PS/rGO exhibits much lower resistance than that of pristine PS and ZnO (Fig. 8(a)). The presence of 5 wt% rGO in the ZnO/PS/rGO composite markedly lowers the resistance value of the composite. The smaller radius of the semicircle observed in the AC-impedance spectra of the PS/rGO and ZnO/PS/rGO composite indicates better charge transfer efficiency. To find the enhancement in the conductivity of the composite as compared to that of its individual components, we determined the AC and DC conductivity of ZnO, PS, PS/rGO, and ZnO/PS/rGO, and the corresponding details of the Nyquist plot are summarized in Table 3.
| Sample | R1 (Ω) | R2 (Ω) | C1 (F) | C2 (F) |
|---|---|---|---|---|
| ZnO | 0.32 × 10⁶ | 5619 | 0.377 × 10⁻⁶ | 0.104 × 10⁻⁹ |
| PS | 0.14 × 10⁶ | 2626 | 0.308 × 10⁻⁶ | 0.186 × 10⁻⁹ |
| PS/rGO | 50 | — | 0.22 × 10⁻⁹ | — |
| ZnO/PS/rGO | 16.8 × 10³ | — | 25.79 × 10⁻¹² | — |
3.6 Photocurrent analysis
To investigate the improvement in the electron transportation kinetics of the ZnO/PS/rGO composite as compared to that of pristine ZnO, the photocurrent transient response (PCTR) of the sample-coated electrodes were obtained. For the PCTR measurements, a sample (film) of thickness ∼12 μm was prepared using the doctor-blading technique, and the photoconductivity of the samples was measured as a function of time. An input of 0 V with light on/off cycles with an interval of 15 seconds was employed. The measured dark current, photocurrent, and on–off difference of ZnO/PS/rGO and pristine ZnO are given in Table 4.| Sample | Dark current (μA cm−2) | Photocurrent (μA cm−2) | On–off difference (μA cm−2) |
|---|---|---|---|
| ZnO/PS/rGO | 0.1 | 24.2 | 24.1 |
| ZnO | 1.1 | 2.8 | 1.7 |
Thus, the photoconductivity of the ZnO/PS/rGO composite is improved by nearly 9 times that of pristine ZnO. This significant enhancement in the photoconductivity of ZnO is due to the presence of the rGO/PS composite (5 wt% rGO). Moreover, photocurrent obtained from the illuminated semiconductor film (ZnO) was determined by the speed of the excited electrons withdrawn from the semiconductor to the conducting electrode (ITO) and the recombination at the electrolyte/film interface.50 The significant enhancement of the photoresponse current of the ZnO/PS/rGO composite obtained in this study can be attributed to two factors: the higher separation efficiency of the photoinduced electron–hole pairs and the lower recombination rate, resulting from the interaction between ZnO and PS/rGO. The higher separation efficiency is supported by the open-circuit voltage decay (OCVD) measurements and the lower recombination rate is evidenced from the charge transfer resistance on the surface, as demonstrated by the AC impedance measurements.
The photoinduced electron recombination property can be characterized using OCVD measurements.51 The electron recombination kinetics were investigated by monitoring the VOC as a function of time after illuminating the light for 4 seconds with steady voltage. Photocurrent curves, OCVD curves, and electron lifetime curves of ZnO and the ZnO/PS/rGO composite are presented in Fig. 9(a–c). Fig. 9(b) displays the calculated lifetime of the photogenerated electrons (τn) as a function of VOC for the ZnO and ZnO/PS/rGO composites.
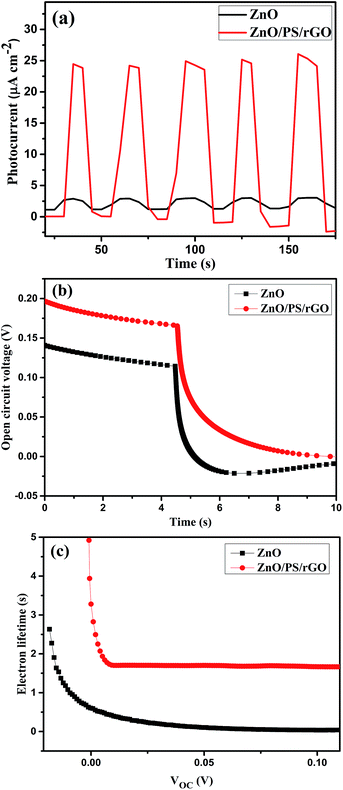 | ||
| Fig. 9 (a) Photocurrent curves, (b) OCVD curves, and (c) electron lifetime curves of ZnO and ZnO/PS/rGO. | ||
As inferred from Fig. 9(b), after 4 seconds, when the illumination was switched off, there was a sharp decay in VOC due to the recombination of charge carriers, which was related to the electron lifetime.52,53 The average lifetime of the photogenerated electrons can be calculated using the following equation (eqn. (3)).54,55
 | (3) |
It becomes evident that the electron lifetime (τn) of ZnO/PS/rGO is significantly larger than that of pristine ZnO. The larger electron lifetime signifies slower electron recombination rate of photogenerated electrons; hence, more electrons might be surviving from the back-reaction, resulting in an improvement in the photocurrent. However, the VOC decay rate determined for the ZnO/PS/rGO composite is significantly lower than that of ZnO, suggesting much slower electron recombination kinetics in the composite, which might be beneficial for optoelectronic applications.
4. Conclusions
Herein, the ZnO/PS/rGO (having 40 wt% ZnO, 55 wt% PS, and 5 wt% rGO) composite was successfully synthesized by a reflex method. It has been observed that as compared to pure ZnO, the ZnO/PS/rGO composite exhibits excellent electrical conductivity. Furthermore, the composite exhibits a superior photocurrent of 24.2 μA cm−2, whereas pristine ZnO exhibits a photocurrent of only 2.8 μA cm−2. Thus, there is an enhancement in the photocurrent of ZnO by nearly 9 times when the ZnO/PS/rGO composite is made. These improved electrical and photovoltaic behaviors of the ZnO/PS/rGO composite can be attributed to the enhanced electrical conductivity and charge transportation kinetics due to the presence of rGO. Additionally, as confirmed from the time-resolved PL measurements, the composite has a larger electron lifetime of 2.5 ns as compared to 0.1 ns for pristine ZnO. Furthermore, tensile property measurement of the composite reveals that the composite exhibits polymer characteristics, such as tensile strength and elongation, which is advantageous for making flexible electrodes.Acknowledgements
The authors thankfully acknowledge the Department of Science and Technology, New Delhi, for financial support (IFA12-PH-18). We would also like to thank the Central University of Tamil Nadu (CUTN), Thiruvarur, and Banaras Hindu University (BHU), Varanasi, for providing experimental facilities. The authors also acknowledge Prof. P. Ravindran (CUTN), Prof. A. P. Dash (CUTN), and Prof. O. N. Srivastava (BHU) for their support and encouragement.References
- X. Liao, X. Yan, P. Lin, S. Lu, Y. Tian and Y. Zhang, ACS Appl. Mater. Interfaces, 2015, 7, 1602–1607 CAS
.
- B. Wu, Z. Wu, Q. Yang, F. Zhu, T. W. Ng, C. S. Lee, S. H. Cheung and S. K. So, ACS Appl. Mater. Interfaces, 2016, 8, 14717–14724 CAS
.
- M. Grätzel, Platinum Met. Rev., 1994, 38, 151–159 Search PubMed
.
- M. Azarang, A. Shuhaimi, R. Yousefi and M. Sookhakian, J. Appl. Phys., 2014, 116, 084307 CrossRef
.
- Y.-L. Chen, Z.-A. Hu, Y.-Q. Chang, H.-W. Wang, Z.-Y. Zhang, Y.-Y. Yang and H.-Y. Wu, J. Phys. Chem. C, 2011, 115, 2563–2571 CAS
.
- H. Abdullah, N. A. Atiqah, A. Omar, I. Asshaari, S. Mahalingam, Z. Razali, S. Shaari, J. Mandeep and H. Misran, J. Mater. Sci.: Mater. Electron., 2015, 26, 2263–2270 CrossRef CAS
.
- Q. Zhang, C. S. Dandeneau, X. Zhou and G. Cao, Adv. Mater., 2009, 21, 4087–4108 CrossRef CAS
.
- Ü. Özgür, Y. I. Alivov, C. Liu, A. Teke, M. Reshchikov, S. Doğan, V. Avrutin, S.-J. Cho and H. Morkoc, J. Appl. Phys., 2005, 98, 11 CrossRef
.
- H. Bae, M. Yoon, J. Kim and S. Im, Appl. Phys. Lett., 2003, 83, 5313–5315 CrossRef CAS
.
- Z. Seow, A. Wong, V. Thavasi, R. Jose, S. Ramakrishna and G. Ho, Nanotechnology, 2008, 20, 045604 CrossRef PubMed
.
- M. Caglar, S. Ilican, Y. Caglar and F. Yakuphanoglu, Appl. Surf. Sci., 2009, 255, 4491–4496 CrossRef CAS
.
- J. Lee, J. H. Hwang, J. Mashek, T. Mason, A. Miller and R. Siegel, J. Mater. Res., 1995, 10, 2295–2300 CrossRef CAS
.
- Q. P. Luo, X. Y. Yu, B. X. Lei, H. Y. Chen, D. B. Kuang and C. Y. Su, J. Phys. Chem. C, 2012, 116, 8111–8117 CAS
.
- A. A. Balandin, S. Ghosh, W. Bao, I. Calizo, D. Teweldebrhan, F. Miao and C. N. Lau, Nano Lett., 2008, 8, 902–907 CrossRef CAS PubMed
.
- D. A. Dikin, S. Stankovich, E. J. Zimney, R. D. Piner, G. H. Dommett, G. Evmenenko, S. T. Nguyen and R. S. Ruoff, Nature, 2007, 448, 457–460 CrossRef CAS PubMed
.
- I. Ovid'ko, Rev. Adv. Mater. Sci., 2013, 34, 1–11 Search PubMed
.
- S. Stankovich, D. A. Dikin, G. H. Dommett, K. M. Kohlhaas, E. J. Zimney, E. A. Stach, R. D. Piner, S. T. Nguyen and R. S. Ruoff, Nature, 2006, 442, 282–286 CrossRef CAS PubMed
.
- D. Fan, Y. Liu, J. He, Y. Zhou and Y. Yang, J. Mater. Chem., 2012, 22, 1396–1402 RSC
.
- E. Tkalya, M. Ghislandi, A. Alekseev, C. Koning and J. Loos, J. Mater. Chem., 2010, 20, 3035–3039 RSC
.
- K. S. Novoselov, A. K. Geim, S. V. Morozov, D. Jiang, Y. Zhang, S. V. Dubonos, I. V. Grigorieva and A. A. Firsov, Science, 2004, 306, 666–669 CrossRef CAS PubMed
.
- M. D. Stoller, S. Park, Y. Zhu, J. An and R. S. Ruoff, Nano Lett., 2008, 8, 3498–3502 CrossRef CAS PubMed
.
- R. R. Nair, P. Blake, A. N. Grigorenko, K. S. Novoselov, T. J. Booth, T. Stauber, N. M. Peres and A. K. Geim, Science, 2008, 320, 1308 CrossRef CAS PubMed
.
- C. Lee, X. Wei, J. W. Kysar and J. Hone, Science, 2008, 321, 385–388 CrossRef CAS PubMed
.
- K. M. Shahil and A. A. Balandin, Solid State Commun., 2012, 152, 1331–1340 CrossRef CAS
.
- H. Chen, M. B. Müller, K. J. Gilmore, G. G. Wallace and D. Li, Adv. Mater., 2008, 20, 3557–3561 CrossRef CAS
.
- H. Quan, B.-q. Zhang, Q. Zhao, R. K. Yuen and R. K. Li, Composites, Part A, 2009, 40, 1506–1513 CrossRef
.
- S. H. Domingues, R. V. Salvatierra, M. M. Oliveira and A. J. Zarbin, Chem. Commun., 2011, 47, 2592–2594 RSC
.
- C. L. Scott, G. Zhao and M. Pumera, Electrochem. Commun., 2010, 12, 1788–1791 CrossRef CAS
.
- G. Eda and M. Chhowalla, Nano Lett., 2009, 9, 814–818 CrossRef CAS PubMed
.
- A. S. Patole, S. P. Patole, H. Kang, J.-B. Yoo, T. H. Kim and J. H. Ahn, J. Colloid Interface Sci., 2010, 350, 530–537 CrossRef CAS PubMed
.
- H. Hu, X. Wang, J. Wang, L. Wan, F. Liu, H. Zheng, R. Chen and C. Xu, Chem. Phys. Lett., 2010, 484, 247–253 CrossRef CAS
.
- N. Wu, X. She, D. Yang, X. Wu, F. Su and Y. Chen, J. Mater. Chem., 2012, 22, 17254–17261 RSC
.
- J. Zhao, S. Pei, W. Ren, L. Gao and H. M. Cheng, ACS Nano, 2010, 4, 5245–5252 CrossRef CAS PubMed
.
- N. R. Yogamalar, K. Sadhanandam, A. C. Bose and R. Jayavel, RSC Adv., 2015, 5, 16856–16869 RSC
.
- S. Pei, J. Zhao, J. Du, W. Ren and H. M. Cheng, Carbon, 2010, 48, 4466–4474 CrossRef CAS
.
- C. Ayyagari, D. Bedrov and G. D. Smith, Macromolecules, 2000, 33, 6194–6199 CrossRef CAS
.
- J. Yang, M. Wu, F. Chen, Z. Fei and M. Zhong, J. Supercrit. Fluids, 2011, 56, 201–207 CrossRef CAS
.
- N. Sakai, T. Miyasaka and T. N. Murakami, J. Phys. Chem. C, 2013, 117, 10949–10956 CAS
.
- R. Sharma, F. Alam, A. Sharma, V. Dutta and S. Dhawan, J. Phys. Chem. C, 2014, 2, 8142–8151 CAS
.
- S. Dong, Y. Li, J. Sun, C. Yu, Y. Li and J. Sun, Mater. Chem. Phys., 2014, 145, 357–365 CrossRef CAS
.
- C. Chen, R. Li, L. Xu and D. Yan, RSC Adv., 2014, 4, 17393–17400 RSC
.
- K. Muthoosamy, R. G. Bai, I. B. Abubakar, S. M. Sudheer, H. N. Lim, H. S. Loh, N. M. Huang, C. H. Chia and S. Manickam, Int. J. Nanomed., 2015, 10, 1505 CAS
.
- Y.-F. Gao, M. Nagai, Y. Masuda, F. Sato and K. Koumoto, J. Cryst. Growth, 2006, 286, 445–450 CrossRef CAS
.
- A. Khan, W. M. Jadwisienczak and M. E. Kordesch, Phys. E, 2006, 33, 331–335 CrossRef CAS
.
- M. Kavitha, P. Gopinath and H. John, Phys. Chem. Chem. Phys., 2015, 17, 14647–14655 RSC
.
- F. Zheng, W. L. Xu, H. D. Jin, X.-T. Hao and K. P. Ghiggino, RSC Adv., 2015, 5, 89515–89520 RSC
.
- Z. Haider, J. Y. Zheng and Y. S. Kang, Phys. Chem. Chem. Phys., 2016, 18, 19595–19604 RSC
.
- B. Rajagopalan and J. S. Chung, Nanoscale Res. Lett., 2014, 9, 535 CrossRef PubMed
.
- A. Grinou, Y. S. Yun and H. J. Jin, Macromol. Res., 2012, 20, 84–92 CrossRef CAS
.
- N. J. Bell, Y. H. Ng, A. Du, H. Coster, S. C. Smith and R. Amal, J. Phys. Chem. C, 2011, 115, 6004–6009 CAS
.
- S. Yumitori, J. Mater. Sci., 2000, 35, 139–146 CrossRef CAS
.
- C. Xu, P. H. Shin, L. Cao, J. Wu and D. Gao, Chem. Mater., 2009, 22, 143–148 CrossRef
.
- B. X. Lei, J. Y. Liao, R. Zhang, J. Wang, C.-Y. Su and D. B. Kuang, J. Phys. Chem. C, 2010, 114, 15228–15233 CAS
.
- A. Zaban, M. Greenshtein and J. Bisquert, ChemPhysChem, 2003, 4, 859–864 CrossRef CAS PubMed
.
- J. Bisquert, A. Zaban, M. Greenshtein and I. Mora-Seró, J. Am. Chem. Soc., 2004, 126, 13550–13559 CrossRef CAS PubMed
.
| This journal is © The Royal Society of Chemistry 2017 |

