 Open Access Article
Creative Commons Attribution 3.0 Unported Licence
Cellulose nanocrystals as host matrix and waveguide materials for recyclable luminescent solar concentrators†
Farsad Imtiaz Chowdhury‡
 a,
Carson Dick‡a,
Lingju Meng
 a,
Seyed Milad Mahpeykara,
Behzad Ahvazib and
Xihua Wang*a
aDepartment of Electrical and Computer Engineering, University of Alberta, Edmonton, T6G 2V4, Canada. E-mail: xihua@ualberta.ca
bBiomass Processing & Conversion-BioResources, Alberta Innovates Technology Future, Edmonton, T6N 1E4, Canada
First published on 26th June 2017
Abstract
The use of luminescent solar concentrators is a cost-effective approach that can efficiently concentrate direct and diffused sun light without any optical components. In this work, the prospect of cellulose nanocrystals (CNCs), an ecofriendly biopolymer, as a host matrix and waveguide for luminescent solar concentrators (LSCs) has been studied. The results show that the CNC material as a host matrix will absorb more photons, ensuring more photoluminescence from organic dyes compared to acrylic polymer emulsion, a common host matrix material in LSCs. Due to the light scattering effect within the CNC material, optical efficiency of the fabricated device decreases once the distance between the point where light hits the sample and the edge, from where photons get collected by the integrating sphere, is increased. Thus optimization of CNC film processing is required if the CNC film is used as a waveguide in LSCs. However the higher optical efficiency of CNC samples compared to acrylic polymer emulsion samples at shorter distances suggests its superior quality as a host matrix. A recyclability study reveals that the CNC material can be reused without compromising device quality, unlike acrylic polymer emulsion samples, which makes it a good candidate as an ecofriendly material for low cost, large scale manufacturing of luminescent solar concentrators.
Introduction
Harvesting solar energy efficiently via cost-effective approaches is critical for large-scale adoption of solar energy as an energy resource in human society. Concentrating solar radiation has great potential to increase solar energy conversion efficiency and an inexpensive way was proposed by A. Goetzberger and W. Greube.1 This concept of enhancing the solar energy concentration has been studied extensively which ultimately gave rise to a device called the luminescent solar concentrator (LSC). A LSC typically consists of a waveguide which is coated or doped with highly fluorescent materials. These fluorescent materials can absorb direct or diffused light and re-emit at a longer wavelength. The emitted light then propagates to the waveguide edges by total internal reflection. Photovoltaic cells can be installed along the perimeter of the waveguide which can absorb the fluorescence and convert it to electricity (Fig. 1). As the surface area of the slab is much larger than the area of its edges, there will be an increase in photon concentration ratio, which is the ratio of photon flux escaping from the edge to the photon flux incident on the top of the surface.2,3 If the slab design is optimized (high ratio of top surface area over side edge area), there will be a high concentration of flux coming out of the edges which might boost the open circuit voltage of the solar cell, similar to concentrated photovoltaics (CPV). Therefore, the idealized LSC would produce more efficiency compared to the cell exposed to AM1.5G.3 However, a large portion of the light is escaped through the large top surface area and hence more design optimization is required to increase the performance of the LSC.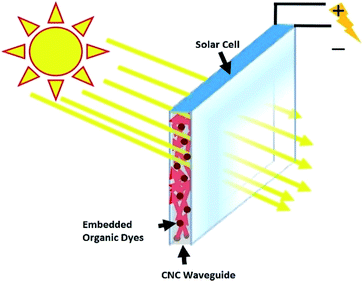 | ||
| Fig. 1 Schematic representation of fluorescence material based LSC where the solar cell installed at the edge can absorb fluorescence to produce electricity. | ||
Many types of luminescent fluorophores have been studied for LSC application such as organic dyes, inorganic phosphors,4–8 quantum dots (QDs)9–15 etc. Recently different designs for LSC have also been investigated such as variation in device geometry,16 multiple dyes based LSC,17,18 multiple layers based LSC,19 use of metal to enhance photoluminescence20 etc. The main motivation to go towards LSC is to replace those costly solar cells required in flat photovoltaic (PV) panels, with an inexpensive luminescent collector which would reduce the cost of solar power. A key advantage this LSC technology has over other concentration systems is that it can successfully convert both direct and diffused light into electricity. This will reduce the cost further as no sun tracking is required and will make it excellent candidate for building integrated photovoltaics (BIPV) and for regions with cloudier climates.6
Apart from studies on improving the efficiency of LSCs, identifying the optimum host material for the overall LSC system is also important. The material used as matrix material that would contain the dyes/QDs can have a significant effect on the LQY and stability of the dyes/QDs. Host matrix should have maximum transparency over a broad wavelength range with minimal scattering. Though acrylic polymer emulsion (APE) is one of the most commonly used matrix materials, other materials have also been investigated as host matrix for improved stability of dyes.21–23 Nature based nanomaterials, which offer ecological advantages, are also attracting lot of interest for such application.24,25 Cellulose is a widely-found biopolymer which has been used as energy resources, building material and component of clothing for a long time. The nanocrystalline existence of cellulose provides small building blocks of cellulose in the nanoscale, with the flexibility for various film processing and additives to hybrid materials/compounds. Different techniques and sources are present to produce this nanocellulose which are summarized in earlier reviews which focus on the production, chemistry and application of cellulose nanocrystals (CNCs).26–31 These CNCs feature a combination of attractive properties such as biocompatibility, high-Young's modulus, low thermal expansion coefficient, optical transparency, low-density, non-toxicity, negative diamagnetic anisotropy and flexible surface chemistry.28,32 Mass production of these CNCs is also possible at low cost using acid hydrolysis method. CNC has already been approved for unrestricted use in Canada and was the first nanomaterials to be included in Canada's Domestic Substances List (DSL).33
In this paper, we report the suitability of CNCs material as host matrix for LSC application. The performance of CNC material is compared with APE material, which is used most commonly as host matrix in LSC. Moreover, we have also studied the possibility of recyclability of CNC material which will help to reduce the material requirement and cost during large scale implementation of this material for LSC application.
Experiment
Materials
Cellulose nanocrystals (CNCs) were mass produced in the CNC pilot plant at Alberta Innovates Technology Futures (AITF, Edmonton, Alberta, Canada). APE was purchased from Golden Artist Colors Inc.34 Glycerol, methanol and glass samples were purchased from Fisher Scientific. Rhodamine 6G which was used as luminescent dye was purchased from Sigma-Aldrich.Organic dye solution
0.1 g of rhodamine 6G was mixed with 10 mL of methanol solution in a test tube. To dilute, 1 mL of this solution was taken from the test tube and mixed with 9 mL of methanol in another test tube which acted as our reference dye solution.CNC synthesis
Acid hydrolysis process was used to synthesis CNC. Sulfuric acid hydrolysis with an acid concentration of 64% at 45 °C was performed at first using two Pfaudler 50-gallon (189 liter) acid-resistant glass-lined reactors with a steam-heated jacket. Later on, a centrifuge step was performed using a GEA Westfalia SC-35 Separator. The last stage involved drying of CNC powder in a SPX-Anhydro Model 400 Spray Dryer Plant at the conditions of a 220 °C inlet temperature and an 85 °C outlet temperature.CNC and APE films deposition
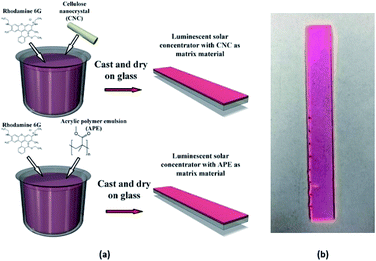
CNC films with organic dyes were prepared by the following steps. First, 2 g of CNC powder and 40 mL of deionized (DI) water were mixed together to form a CNC solution. 0.8 mL glycerol was later added to this solution to avoid crack formation in the films during drying. Three different samples were fabricated where with the above solution 1 mL, 0.5 mL and 0.25 mL reference dye solutions were added and named as 20× CNC, 5× CNC and 1× CNC, respectively. After that the solutions were stirred at 75 °C for 90 min. Finally, these mixtures were poured into plastic Petri dishes where we already placed our glass samples and let the solution to dry for 72 hours. After that, glass samples with CNC films were taken out of Petri dishes. For comparison APE samples with similar dye concentrations were fabricated. This APE, which was purchased from Golden Artist Colors, Inc,34 was in gel form and soluble in water. 5 mL of APE and 40 mL deionized water were initially mixed together to form an APE solution. After that 1 mL, 0.5 mL and 0.25 mL reference dye solutions were added with the above solution and named as 20× APE, 5× APE and 1× APE, respectively. Later these solutions were stirred at 75 °C for 90 min. At the end, these mixtures were poured into plastic Petri dishes with glass samples already placed inside and dried it for 72 hours at room temperature. After that, glass samples with APE films were taken out of Petri dishes. Thicknesses of all the CNC and APE samples were measured and found to be similar. Average thicknesses of CNC film and APE film deposited on glass were 0.327 ± 10% mm and 0.307 ± 10% mm, respectively. Dye concentrations of 20×, 5× and 1× samples (both CNC and APE) were found to be 2.09 μM, 0.52 μM and 0.104 μM, respectively. The process flow of the fabrication is shown in Fig. 2(a) and a fabricated sample is shown in Fig. 2(b).Result and discussion
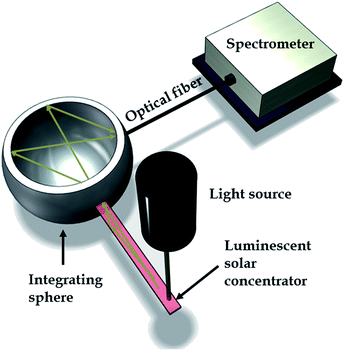
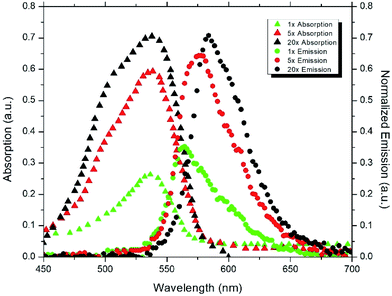
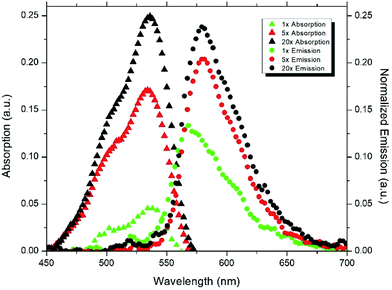
Photoluminescence (PL) spectra of the samples were measured at room temperature and at an excitation wavelength of 520 nm (Sciencetech Inc.) with an integrating sphere and a modular spectrometer (Ocean optics) and absorption spectra were measured using Perkin Elmer Lamda 1050 UV-Vis-NIR Spectrophotometer. Fig. 3 is showing a schematic of the characterization setup which was used to measure the photoluminescence of the samples.Fig. 4 and 5 show the absorption and emission spectra of CNC and APE samples at three different dye concentrations. These figures show that 20× CNC and 20× APE samples have the highest light absorption and emission, and 1× CNC and 1× APE samples have the lowest, which is consistent with their dye concentrations. It is also visible that CNC samples have higher light absorption and light emission compared to APE samples for comparable concentrations. From these two figures, it is also visible that with increasing dye concentration, there is a relative drop in peak emission compared to peak absorption for both CNC and APE samples which is due to the reabsorption losses when more dyes are present in the matrix. These losses are also the reason for slight red shift in emission peaks.
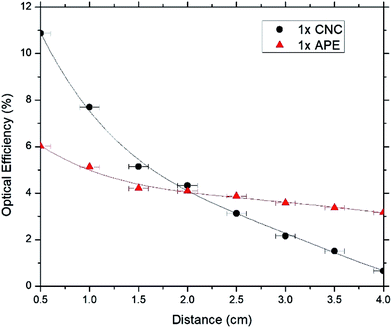
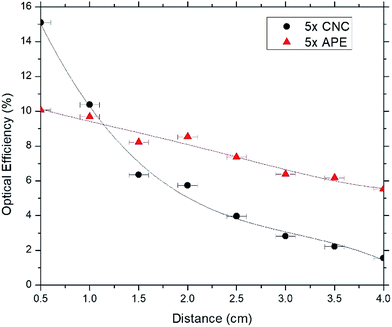
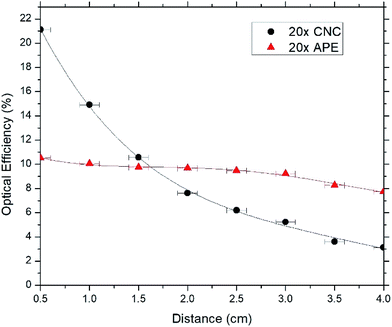
In Fig. 6–8, optical efficiencies at different edge distances of CNC and APE samples have been compared. Here optical efficiency is defined as the ratio of collected photons at the edge to incident photons on the sample and, edge distance is the distance between source incident point on the sample and edge from where emitted photons are being collected. In the experiment, we extracted the photons from only one edge of the sample and calculation shows that when the incoming beam hits the sample, only one fourth of light gets the chance to escape through that side of sample's edge (see ESI†). Hence the optical efficiency values at 0.5 cm were multiplied by 4 and to maintain consistency, rest of the values were also multiplied by 4 which we deem as the maximum optical efficiency that can be achieved by extracting photons from four side edges of the sample.
These figures show that optical efficiencies at 0.5 cm for 1× APE, 5× APE and 20× APE are 6.0%, 10.0% and 10.7%, respectively; suggesting a performance drop due to reabsorption of photons35,36 by the dyes when dye concentration is increased. CNC samples also show a similar trend with 10.9%, 15.1% and 21.0% optical efficiencies for 1× CNC, 5× CNC and 20× CNC, respectively.
These results also show that optical efficiencies of CNC samples are higher at shorter edge distances compared to APE samples. Transmission and reflection data of CNC and APE materials (see ESI†) show that CNC material may absorb a small amount (less than 10%) of light while APE material is almost transparent. However, this small absorption (unity minus transmission and reflection) might come from the scattered light that is not captured in the measured set-up. We believe this characteristic of CNC material influence the overall absorption of the LSC providing higher absorption and emission. When the edge distance is increased, CNC samples experience larger performance drop than APE samples. For 1× CNC, 5× CNC and 20× CNC, drop in optical efficiencies when edge distance is increased from 0.5 cm to 4 cm are 93.6%, 88.1% and 85.7%, respectively whereas for 1× APE, 5× APE and 20× APE, these values are 48.3%, 43.0% and 26.2%, respectively. These results indicate that CNC material as a host matrix has superior quality than APE material, which results in an increase in absorption and emission of light. But APE material, as a waveguide, supports light propagation better when distance being travelled is increased compared to CNC material. The reason for this is that light scattering is prominent in CNC material which reduces its optical efficiency significantly when the edge distance in increased and further optimization during CNC synthesis is required to improve this.
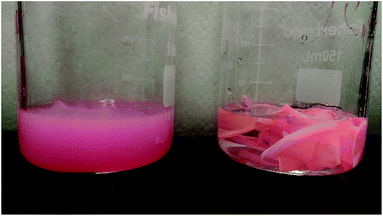
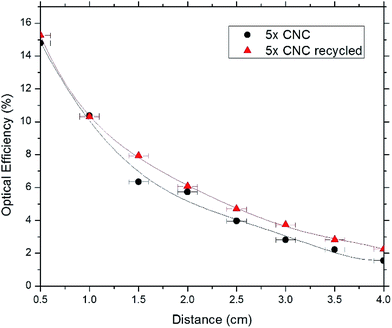
Next, we studied the recyclability of CNC and APE materials as host matrix. For this purpose, 5× CNC and 5× APE samples were taken into consideration. The host materials were stripped off the glass samples and from the Petri dishes and, were placed inside beakers. Adequate DI water was added and the solutions were stirred at 75 °C for 90 min. It was found that solid CNC material reabsorbed water and formed a diluted solution, similar to the one formed initially. APE material, on the other hand, did not absorb any water and remained as a solid once the experiment is finished. Fig. 9 shows the condition of CNC and APE materials after the stirring step, verifying the above statement. Later the recycled solution was used to fabricate a sample, named 5× CNC recycled, using the steps mentioned earlier and compared its performance with previous result. Fig. 10 is showing the optical efficiencies of 5× CNC and 5× CNC recycled samples. This figure shows that the quality of the sample does not drop even after performing the recycling step. Though this feature of CNC material is exciting, it also opens the door of other challenges as well. For large scale implementation of such material and in an environment where rain and snow are regular encounters, such solubility of CNC in water can be tackled with special coating layer that would not deteriorate the performance and at the same time will keep the LSC unaffected.
Conclusions
In this work, the CNC film as the host matrix and waveguide for LSC applications has been studied, and the CNC based LSC has been compared to that is made of APE. Optical efficiencies of the CNC samples showed that with increasing distance, the values dropped between 85% and 94% whereas for APE samples, drop is between 26% and 48%, depending on dye concentrations. These decreases in optical efficiencies with increasing distance for both APE and CNC samples are mainly due to reabsorption losses, but CNC samples experience larger performance drop which is due to the additional scattering of light taking place in CNC material. Also with increasing concentration of dyes, the relative peak emission intensities are found to decrease for both CNC and APE samples which is also due to the reabsorption losses. At shorter edge distances, optical efficiencies of CNC samples were higher than APE samples which suggest that as a host matrix CNC material is better than APE material but further optimization of CNC material is required to make it effective as a waveguide. Moreover, APE material is not recyclable but CNC material can be reused and the fabricated sample with recycled CNC material showed little or no loss in optical efficiency. Though more optimization is required during CNC film processing to reduce light scattering and increase its optical efficiency with increasing device area, biocompatibility and recyclability of CNC material make it a promising candidate for large scale implementation for LSC application at reduced cost.Acknowledgements
This work was supported by the Natural Sciences and Engineering Research Council of Canada (NSERC) and Alberta Innovates-Bio Solutions (AI-Bio).References
- A. Goetzberger and W. Greube, Appl. Phys., 1977, 14, 123–139 CAS.
- U. Rau, F. Einsele and G. C. Glaeser, Appl. Phys. Lett., 2005, 87, 171101 CrossRef.
- W. G. J. H. M. van Sark, K. W. J. Barnham, L. H. Slooff, A. J. Chatten, A. Büchtemann, A. Meyer, S. J. McCormack, R. Koole, D. J. Farrell, R. Bose, E. E. Bende, A. R. Burgers, T. Budel, J. Quilitz, M. Kennedy, T. Meyer, C. D. M. Donegá, A. Meijerink and D. Vanmaekelbergh, Opt. Express, 2008, 16, 21773 CrossRef CAS PubMed.
- A. M. Hermann, Sol. Energy, 1982, 29, 323–329 CrossRef CAS.
- R. Reisfeld and C. K. Jørgensen, in Solar Energy Materials, Springer Berlin Heidelberg, Berlin, Heidelberg, 1982, pp. 1–36 Search PubMed.
- B. C. Rowan, L. R. Wilson and B. S. Richards, IEEE J. Sel. Top. Quantum Electron., 2008, 14, 1312–1322 CrossRef CAS.
- M. J. Currie, J. K. Mapel, T. D. Heidel, S. Goffri and M. A. Baldo, Science, 2008, 321, 226–228 CrossRef CAS PubMed.
- L. R. Wilson and B. S. Richards, Appl. Opt., 2009, 48, 212 CrossRef CAS PubMed.
- F. Purcell-Milton and Y. K. Gun’ko, J. Mater. Chem., 2012, 22, 16687 RSC.
- K. Barnham, J. L. Marques, J. Hassard and P. O'Brien, Appl. Phys. Lett., 2000, 76, 1197–1199 CrossRef CAS.
- A. J. Chatten, K. W. J. Barnham, B. F. Buxton, N. J. Ekins-Daukes and M. A. Malik, Semiconductors, 2004, 38, 909–917 CrossRef CAS.
- A. J. Chatten, K. W. J. Barnham, B. F. Buxton, N. J. Ekins-Daukes and M. A. Malik, Sol. Energy Mater. Sol. Cells, 2003, 75, 363–371 CrossRef CAS.
- J. Bomm, A. Büchtemann, A. J. Chatten, R. Bose, D. J. Farrell, N. L. A. Chan, Y. Xiao, L. H. Slooff, T. Meyer, A. Meyer, W. G. J. H. M. van Sark and R. Koole, Sol. Energy Mater. Sol. Cells, 2011, 95, 2087–2094 CrossRef CAS.
- J. Xue, F. Song, X. Yin, X. Wang and Y. Wang, ACS Appl. Mater. Interfaces, 2015, 7, 10076–10079 CAS.
- M. Zhu, X. Peng, Z. Wang, Z. Bai, B. Chen, Y. Wang, H. Hao, Z. Shao, H. Zhong and S. Kim, J. Mater. Chem. C, 2014, 2, 10031–10036 RSC.
- M. Kennedy, S. J. McCormack, J. Doran and B. Norton, in Proceedings of ISES World Congress 2007, Springer Berlin Heidelberg, Berlin, Heidelberg, 2008, vol. I–V, pp. 1484–1488 Search PubMed.
- S. T. Bailey, G. E. Lokey, M. S. Hanes, J. D. M. Shearer, J. B. McLafferty, G. T. Beaumont, T. T. Baseler, J. M. Layhue, D. R. Broussard, Y.-Z. Zhang and B. P. Wittmershaus, Sol. Energy Mater. Sol. Cells, 2007, 91, 67–75 CrossRef CAS.
- A. A. Earp, G. B. Smith, J. Franklin and P. Swift, Sol. Energy Mater. Sol. Cells, 2004, 84, 411–426 CrossRef CAS.
- H. Hernandez-Noyola, D. H. Potterveld, R. J. Holt and S. B. Darling, Energy Environ. Sci., 2012, 5, 5798–5802 CAS.
- J. S. Biteen, L. A. Sweatlock, H. Mertens, N. S. Lewis, A. Polman and H. A. Atwater, J. Phys. Chem. C, 2007, 111(36), 13372–13377 CAS.
- G. Griffini, M. Levi and S. Turri, Prog. Org. Coat., 2014, 77, 528–536 CrossRef CAS.
- G. Griffini, M. Levi and S. Turri, Sol. Energy Mater. Sol. Cells, 2013, 118, 36–42 CrossRef CAS.
- G. Griffini, L. Brambilla, M. Levi, M. Del Zoppo and S. Turri, Sol. Energy Mater. Sol. Cells, 2013, 111, 41–48 CrossRef CAS.
- V. Fattori, M. Melucci, L. Ferrante, M. Zambianchi, I. Manet, W. Oberhauser, G. Giambastiani, M. Frediani, G. Giachi and N. Camaioni, Energy Environ. Sci., 2011, 4, 2849 CAS.
- M. Melucci, M. Durso, L. Favaretto, M. L. Capobianco, V. Benfenati, A. Sagnella, G. Ruani, M. Muccini, R. Zamboni, V. Fattori and N. Camaioni, RSC Adv., 2012, 2, 8610 RSC.
- D. Klemm, F. Kramer, S. Moritz, T. Lindström, M. Ankerfors, D. Gray and A. Dorris, Angew. Chem., Int. Ed., 2011, 50, 5438–5466 CrossRef CAS PubMed.
- S. J. Eichhorn, A. Dufresne, M. Aranguren, N. E. Marcovich, J. R. Capadona, S. J. Rowan, C. Weder, W. Thielemans, M. Roman, S. Renneckar, W. Gindl, S. Veigel, J. Keckes, H. Yano, K. Abe, M. Nogi, A. N. Nakagaito, A. Mangalam, J. Simonsen, A. S. Benight, A. Bismarck, L. A. Berglund and T. Peijs, J. Mater. Sci., 2010, 45, 1–33 CrossRef CAS.
- R. J. Moon, A. Martini, J. Nairn, J. Simonsen and J. Youngblood, Chem. Soc. Rev., 2011, 40, 3941 RSC.
- Y. Habibi, L. A. Lucia and O. J. Rojas, Chem. Rev., 2010, 110, 3479–3500 CrossRef CAS PubMed.
- E. Lam, K. B. Male, J. H. Chong, A. C. W. Leung and J. H. T. Luong, Trends Biotechnol., 2012, 30, 283–290 CrossRef CAS PubMed.
- A. Isogai, T. Saito and H. Fukuzumi, Nanoscale, 2011, 3, 71–85 RSC.
- Y. Zhou, C. Fuentes-Hernandez, T. M. Khan, J.-C. Liu, J. Hsu, J. W. Shim, A. Dindar, J. P. Youngblood, R. J. Moon and B. Kippelen, Sci. Rep., 2013, 3, 327–332 Search PubMed.
- L. Meng, S. M. Mahpeykar, Q. Xiong, B. Ahvazi and X. Wang, RSC Adv., 2016, 6, 85427–85433 RSC.
- Golden Artist Colors, Inc., http://www.goldenpaints.com/technicalinfo_selfgel, January 2017.
- L. R. Wilson, B. C. Rowan, N. Robertson, O. Moudam, A. C. Jones and B. S. Richards, Appl. Opt., 2010, 49, 1651 CrossRef PubMed.
- R. W. Olson, R. F. Loring and M. D. Fayer, Appl. Opt., 1981, 20, 2934 CrossRef CAS PubMed.
Footnotes |
| † Electronic supplementary information (ESI) available. See DOI: 10.1039/c7ra04344a |
| ‡ Farsad Imtiaz Chowdhury and Carson Dick contributed equally to this work. |
| This journal is © The Royal Society of Chemistry 2017 |

