 Open Access Article
An electrochemical sensing platform for trace recognition and detection of an anti-prostate cancer drug flutamide in biological samples†
Pradeep Kumar Brahman *a,
Lakkavarapu Sureshab,
Kasarla Ramakrushna Reddya and
Bondili J. S.b
aElectroanalytical Lab, Department of Chemistry, K L University, Guntur, Andhra Pradesh, India. E-mail: tiwari25_pradeep@yahoo.com; drpkt@kluniversity.in; Fax: +91-8842-547546; Tel: +91-9407-592987
bDepartment of Biotechnology, K L University, Guntur, Andhra Pradesh, India
First published on 2nd August 2017
Abstract
Developing simple, selective and sensitive platforms for anticancer drug analysis is of great importance in biomedical research. This study describes the fabrication of a ferrocene (FC) and multiwalled carbon nanotubes (MWCNTs) functionalized carbon paste electrode as a highly sensitive electrochemical sensor for the determination of anticancer drug flutamide in serum, plasma and urine samples. Scanning electron microscopy (SEM), cyclic voltammetry (CV), electrochemical impedance spectroscopy (EIS) and chronocoulometry methods were used to characterize the sensor. Electrochemical impedance studies revealed that the smaller Rct (charge transfer resistance) value was observed at FC/MWCNTs/CPE as compared to that of MWCNTs/CPE and CPE, which authenticates its good conductivity. The obtained sensor has a large specific area, high conductivity, good biocompatibility and fast redox properties. Various optimization parameters such as pH, accumulation time, deposition potential, scan rate and the effect of composite mixture on the electrochemical performance of the sensor were evaluated. A linear range from 0.1 to 110 μM for FT detection was obtained with a detection limit of 0.001 μM. Furthermore, the fabricated sensor has been utilized for estimation of FT in biological samples. This efficient strategy provides new insight into the design of novel flexible sensors for a wide range of applications in biosensing, bioelectronics, and clinical applications.
1. Introduction
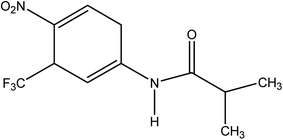
Among all anticancer drugs flutamide (FT), 4-nitro-3-trifluoromethyl-isobutilanilide (Scheme 1), is the primary nonsteroidal anti-androgen drug used to treat prostate cancer.1 Its action is based on blocking the effect of the male hormone, testosterone, whose supply is essential for the growth of prostate cancers. This drug and its primary hydroxy metabolite decrease metabolism of C-19 steroids by the cytochrome P-450 system at the target cells in the secondary sex organ.2 The prostate cancer cells are unable to grow without testosterone. FT does not cure prostate cancer, but it can keep the cancer under control for many months or years.During the past two decades great efforts have been made towards improving molecular sensing of chemically and biologically species.3–10 Electrochemical sensors have been proven as an inexpensive, simple and versatile analytical tool with remarkable detection sensitivity, reproducibility, ease of miniaturization and specific selectivity of target molecules.11–18 They have found a vast range of important applications in the fields of clinical, industrial, environmental and agricultural analyses.19–21 In addition the modification of electrode surface to act as a sensor is a widely used electroanalytical strategy useful for many sensing applications requiring highly compatible and properly functionalized surfaces to anchor the recognition material. However, development of a biosensor with improved parameters such as selectivity and stability, which depend on the biosensing molecule attachment and its compatibility with the solid surface, requires extensive investigation. Carbon nanotubes (CNTs) have been considered as a promising material for the development of biosensor with enhanced sensitivity because of its high chemical stability, good electrical conductivity, and tubular structure.22–26 Moreover, the high conductivity and charge transfer channels of CNTs make them a promising material for composite fabrication applications. In recent years, MWCNTs have been one of the most intensively investigated nanostructured materials.27–33 Chemical functionalization of MWCNTs can enhance specific surface area and thereby improve electrical conductivity, mechanical properties and compatibility for immobilization of biomolecules.
Over the past two decades, chemically modified carbon paste electrodes34 (CMCPEs) have attracted broad interest in biological and pharmaceutical sensing development due to low background current, wide range of potential window, easy surface renewal, lower detection limit, and low cost. Due to these advantages CMCPEs have been employed for several purposes, such as voltammetric determination of the herbicide propham,35 electroanalytical determination of 4-chloro-3-methylphenol,36 electrochemical analysis of D-penicillamine (D-PA), stripping measurements of hydrogen peroxide, electrocatalytic determination of ascorbic acid etc.37–39 An electroactive mediator needs to be of low relative molar mass, reversible, fast reacting, regenerated at low potential, pH independent, stable in both oxidized and reduced forms, unreactive with oxygen and non-toxic. Among the most successful mediators are those based on ferrocene and its derivatives, all of which meet the above criteria.
Drug analysis, which is an important branch of analytical chemistry, plays an important role in drug quality control. Many analytical methods for the determination of FT in biological fluids and in pharmaceutical preparations are reported in the literature. These methods include, high-performance liquid chromatography (HPLC),40 spectrophotometry41,42 and gas chromatography43 etc. Since, some of these methods are time-consuming, expensive or need complicated pretreatment, such as multi solvent extraction, as well as trained technicians to carry out the measurements, which limit their applications. However, because it is an electroactive compound, FT can be detected by electrochemical methods. This is advantageous because such detection is simple, sensitive, selective, responsive, and inexpensive. Therefore, little bit voltammetric study has been carried out for the electrochemical detection of FT.44,45 To the best our knowledge no report is available in the literature for the detection of flutamide based on FC and MWCNTs modified carbon paste electrode.
The present study deals with the fabrication of a novel electrochemical sensor based on FC and MWCNTs functionalized carbon paste electrode. The electrochemical behaviour of FC/MWCNTs/CPE was investigated to evaluate of its suitability for the detection and analysis of FT using square wave voltammetry. The surface properties of the FC/MWCNTs/CPE allow FT to be adsorbed effectively onto the fabricated sensor. This improves the sensitivity of the sensor such that it can be used for the detection of FT in biological samples. We have optimized the experimental parameters and developed a simple, stable, and sensitive method for the detection of FT. To the best of our knowledge, the combination of FC and MWCNTs modified CPE for the detection and quantification of FT has not been explored so far. The fabricated sensor has displayed fast electron transfer and prominent catalytic ability towards FT with wide linear range, low detection limit and large surface concentration. Therefore, this work opens a new channel to the construction of highly sensitive sensors by employing composite material containing FC and MWCNTs.
2. Experimental
2.1 Chemicals and reagents
Acetic acid, sodium acetate, MWCNTs (99%), paraffin oil obtained from Himedia, India. Graphite powder, flutamide, KH2PO4, K2HPO4 Tris buffer and ferrocene was procured from sigma, India. All the reagents were of analytical graded and used without further purification. All required solutions were prepared using double distilled water.2.2 Instrumentation
The voltammetric measurements were performed using an Autolab PGSTAT 204 equipped with USB electrochemical interface using NOVA software. Conventional three-electrode system employing, a CPE (unmodified and modified) was used as working electrode, platinum wire, and Ag/AgCl (sat. KCl) were used as counter and reference electrodes, respectively. The pH measurements were performed using systronic-362 μpH meter. Morphological analysis was carried out using SEM (FEI INSPECT F50).2.3 Preparation of CPE and FC/MWCNTs/CPE
The CPE was prepared by thoroughly mixing fine graphite powder with mineral oil at composition 70![[thin space (1/6-em)]](https://www.rsc.org/images/entities/char_2009.gif) :
:![[thin space (1/6-em)]](https://www.rsc.org/images/entities/char_2009.gif) 30 (w/w graphite/oil) using a motor and pestle and was allowed to homogenize for 24 hours. FC/MWCNTs/CPE was prepared by mixing mineral oil, graphite powder and ferrocene with various weight ratios. A portion of the paste was then packed into a Teflon micro tip (diameter 2.0 mm) and a copper wire was inserted to establish an electrical contact. Electrode surface was smoothed on a zero grade butter paper to produce a reproducible working surface. For comparison MWCNTs/CPE was also prepared by mixing graphite powder, mineral oil and MWCNTs at composition 60
30 (w/w graphite/oil) using a motor and pestle and was allowed to homogenize for 24 hours. FC/MWCNTs/CPE was prepared by mixing mineral oil, graphite powder and ferrocene with various weight ratios. A portion of the paste was then packed into a Teflon micro tip (diameter 2.0 mm) and a copper wire was inserted to establish an electrical contact. Electrode surface was smoothed on a zero grade butter paper to produce a reproducible working surface. For comparison MWCNTs/CPE was also prepared by mixing graphite powder, mineral oil and MWCNTs at composition 60![[thin space (1/6-em)]](https://www.rsc.org/images/entities/char_2009.gif) :
:![[thin space (1/6-em)]](https://www.rsc.org/images/entities/char_2009.gif) 30
30![[thin space (1/6-em)]](https://www.rsc.org/images/entities/char_2009.gif) :
:![[thin space (1/6-em)]](https://www.rsc.org/images/entities/char_2009.gif) 10 (w/w).
10 (w/w).
2.4 Voltammetric study
Cyclic voltammetric (CV) and square wave voltammetric (SWV) studies were carried out for FT analysis. Stock solution of FT was prepared in 90% ethanol. An appropriate aliquot was taken in 50 ml standard volumetric flask and made up to the mark with 0.2 M acetate buffer (pH 4.5). The solution was then transferred into an electrochemical cell and the measurements were carried out at 25 °C. The CV and SWV studies were carried out by sweeping the potential between 0.0 to −1.0 V. The voltammograms were recorded using unmodified and modified carbon paste electrodes. The EIS studies were performed on 5 mM [Fe(CN)6]3−/[Fe(CN)6]4− in 0.1 M KCl in the frequency range from 10−1 to 105 Hz at open circuit potential with amplitude of 5 mV.2.5 Preparation of solution for the determination of FT in biological samples
Urine and blood serum samples were obtained from local pathology laboratory Sri Diagnostic Centre and all ethical guidelines were followed in handling the samples for all measurements and ethics approval for the use of human subjects was obtained from Institutional ethics committee. 0.2 ml blood (serum and plasma)/urine sample was taken in a voltammetric cell and made up to 40 ml with acetate buffer. This solution was spiked with the known volume of standard drug sample. Calibration method was employed for quantification of FT in all serum, plasma and urine samples.3. Results and discussion
3.1 Morphological characterization of fabrication sensor
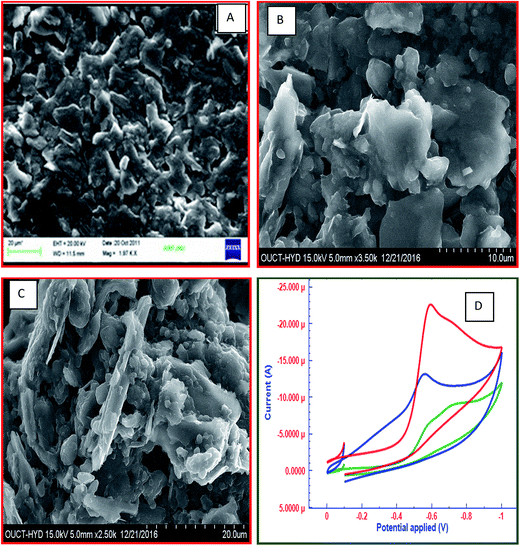
The morphology of the FC/MWCNTs/CPE sensor was studied by SEM. Fig. 1 shows the SEM images of CPE, MWCNTs/CPE and FC/MWCNTs/CPE. The comparison of SEM images shows a difference in the morphology of all three electrodes. The unmodified CPE surface is homogenous and a layer of irregular flakes of graphite powder is present and isolated from each other (Fig. 1A). The SEM of CPE modified with MWCNTs was characterized by presence of small bundles like structure (Fig. 1B). Also, it can be obviously seen that the FC dispersed successfully in the MWCNTs/CPE electrode (Fig. 1C).3.2 Characterization of fabricated electrochemical sensor by cyclic voltammetry
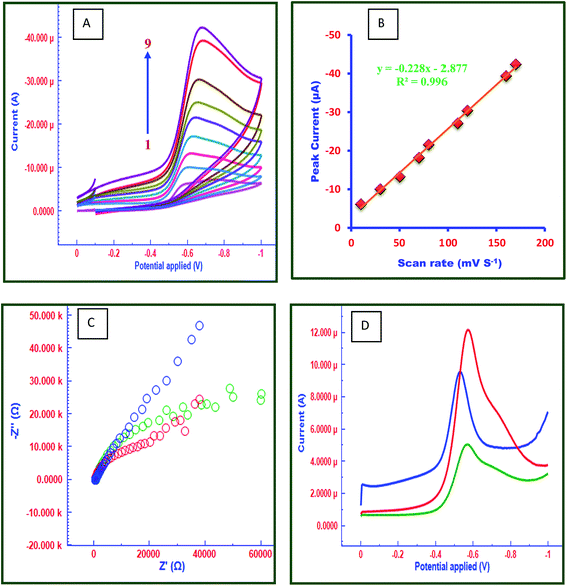
Cyclic voltammetry (CV) was used to elucidate the sensitivity and electrochemical properties of FC/MWCNTs/CPE sensor. For this purpose, different electrodes namely CPE, MWCNTs/CPE and FC/MWCNTs/CPE have been compared using 15 μM FT in acetate buffer solution pH 4.5. Potential range was applied for this study is 0.0 to −1.0 V. CV plots for 15 μM FT at all three electrodes are depicted in Fig. 1D. It can be seen in Fig. 1D, that FC/MWCNTs/CPE exhibits higher peak currents for the reduction of FT in comparison with the other electrodes, which can be related to the high surface area and electrocatalytic behaviour of MWCNTs and FC. In comparison with the other electrodes, FT displayed better electrochemical behavior at the FC/MWCNTs/CPE, which indicated that fabricated sensor provided the conducting bridges in order to promote the electron transfer of FT. Fig. 2A shows the influence of scan rate on reduction peak current and peak potential of 15 μM FT. It was observed that reduction peak current increased linearly with increasing scan rate ranging from 10 mV s−1 to 170 mV s−1 (Fig. 2B).The number of electrons (n) involved in the reaction was calculated from the cyclic voltammetry. Ep − Ep/2 value was calculated to be 23.7 mV. This value was then substituted in the following equation to obtain ‘n’ value:
| Ep − Ep/2 = (47.7/αn) mV | (1) |
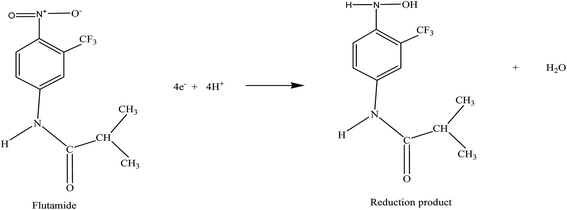
Solving this eqn (1), the αna value is found to be 2.01. Now, for a totally irreversible reaction, the electron transfer coefficient (α) is assumed to be 0.5. Therefore, by substitution of the value of α in the above equation provides the value of n = 4 for the reduction of FT. Following expected reduction mechanism of FT can be predicted (Scheme 2).
3.3 Electrochemical impedance spectroscopy
Electrochemical impedance spectroscopy (EIS) was used as an efficient tool to characterize the interface properties of the electrode surfaces.46 The EIS can give information on the impedance changes of the electrode surface during the modification process. The EIS includes a semicircular part and a linear part. The semicircular part at higher frequencies corresponds to the electron transfer limited process and the diameter is equivalent to the electron transfer resistance (Rct). The linear part at lower frequencies corresponds to the diffusion process. Fig. 2C presents the Nyquist diagrams of CPE, MWCNTs/CPE and FC/MWCNTs/CPE in 5 mM [Fe(CN)6]3−/[Fe(CN)6]4− at an applied voltage of 5 mV in the frequency range from 10−1 to 105 Hz. The frequency range selected in the experimental studies was from 10−1 to 105 Hz. The EIS of the CPE and MWCNTs/CPE exhibit a semicircle that shows a much higher interfacial electron transfer resistance. Whereas the EIS of the FC/MWCNTs/CPE film are close to a line, showing very low electron transfer resistance due to the large surface area, excellent electrocatalytic nature and high adsorption tendency of FC/MWCNTs/CPE. The charge transfer resistance (Rct) obtained for CPE, MWCNTs/CPE and FC/MWCNTs/CPE are 3.512 kohm, 2.235 kohm and 0.531 kohm, respectively. Therefore, this fabricated electrode was used for the electrochemical determination of FT.3.4 Chronocoulometry
Chronocoulometry was employed for the determination of the kinetics, and mechanism of electrode reactions involved in the electro-oxidation of 15 μM FT at CPE, MWCNTs/CPE and FC/MWCNTs/CPE. The diffusion coefficient and Qads of FT were calculated from the plot of Q vs. t1/2 using Anson equation. The resulting calculated parameters are presented in Table 1. As can be seen from the table, the value of the slope and the Qads for the FC/MWCNTs/CPE were more than that for other electrodes, confirming the more accumulation of FT onto the electrode surface more effectively (Table 1).| Electrodes | Diffusion coefficient (10−6 cm2 s−1) | Surface coverage (10−10 mole cm−2) |
|---|---|---|
| CPE | 6.23 ± 0.07 | 2.13 |
| MWCNTs/CPE | 6.21 ± 0.05 | 4.41 |
| FC/MWCNTs/CPE | 6.54 ± 0.20 | 10.12 |
The surface coverage (Γ0) for all three electrodes was calculated using the following relationship:
| Qads = nFAΓ0 | (2) |
3.5 Square wave voltammetry (SWV)
In order to elucidate the unique electrochemical behaviour of FC/MWCNTs/CPE sensor towards FT detection, the electrochemical behaviour of 15 μM FT was investigated at all three electrodes. Fig. 2D displays the square wave voltammograms for the 15 μM FT on the CPE, MWCNTs/CPE and FC/MWCNTs/CPE. It shows that FC/MWCNTs/CPE exhibits a higher response in terms of peak current compared to the other electrodes. The enhanced peak current implies that electrochemical reduction of FT is more facile on FC/MWCNTs/CPE, which indicates that proposed method is highly sensitive for the detection of FT. Performance of all three kinds of electrodes have been investigated statistically. For this purpose, square wave voltammograms for FT at 3 different CPEs, MWCNTs/CPEs and FC/MWCNTs/CPEs have recorded and statistical parameters calculated (ESI Fig. S1–S4 and Table S1†). Fig. 3A reflects the electrocatalytic effect of FT at three different electrodes. Above findings enabled us to determine FT using SWV on FC/MWCNTs/CPE sensor.3.6 Optimization of experimental conditions
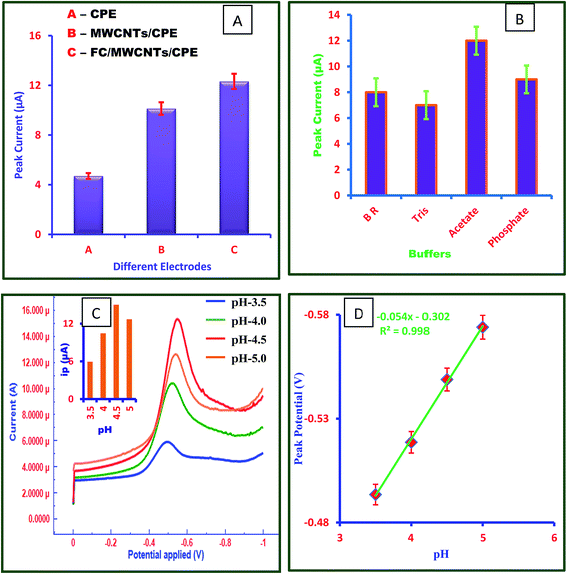
| Ep (V) = −0.054 pH − 0.302 (R2 = 0.998) | (3) |
Hence, it was evident that equal no of protons and electrons are involved in the reaction.
3.7 Calibration curve
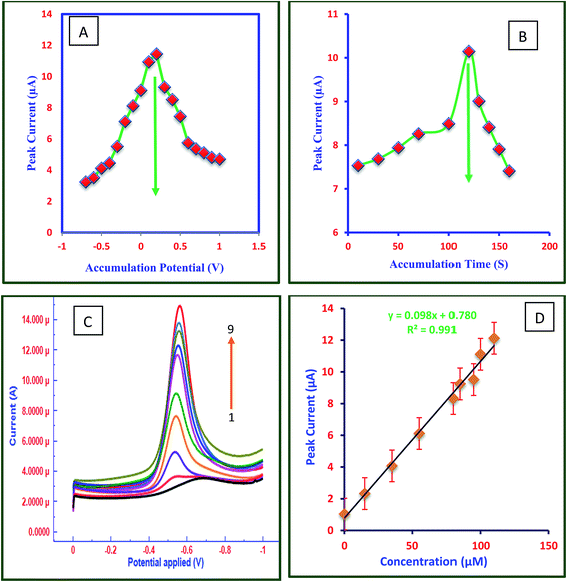
Fig. 4C shows the square wave voltammograms of FT at different concentrations in 0.2 M acetate buffer at pH 4.5 and Fig. 4D is the calibration plot between concentration of FT and peak current. The electrochemical responses of peak current of FT were increased linearly with its concentrations. The results indicated that the fabricated sensor is highly sensitive towards FT detection owing to the large peak current. The response of peak currents of FT at FC/MWCNTs/CPE was linear with the concentration of FT in the range of 0.1 μM to 110 μM. Calibration curves for three different FC/MWCNTs/CPEs were also plotted (ESI file S9†).3.8 Validation of the developed method
In order to validate the proposed analytical method with respect to parameters such as limit of quantification (LOQ), limit of detection (LOD), precision, accuracy, selectivity, recovery, robustness and ruggedness.| Method | Concentration taken (μM) | Concentration found (μM) | Recovery (%) (n = 5) | Precision % RSD (n = 5) |
|---|---|---|---|---|
| SWV | Intra-day | |||
| 15 | 14.95 | 99.66 | 1.24 | |
| Inter-day | ||||
| 15 | 14.75 | 98.33 | 3.14 | |
3.9 Comparison of proposed method with literature methods
A comparison between the analytical performances of the proposed method with previously reported methods for determination is shown in Table 3. The data reveals that the FC/MWCNTs/CPE shows superior analytical performance in terms of very low detection limit, wide linear dynamic range, high sensitivity, good reproducibility, and repeatability over methods reported in literature. In addition present method is simple, and does not involve any pre-treatment step.3.10 Analytical applications
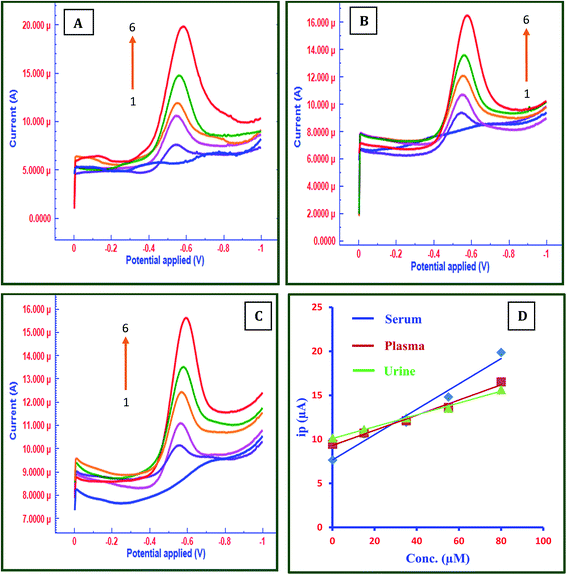
Analytical applications of the fabricated sensor were explored in the determination of FT in real samples by testing them on human blood serum, plasma and urine samples. The serum, plasma and urine samples were analyzed at FC/MWCNTs/CPE using calibration method. Serum, plasma and urine samples were diluted with 0.2 M acetate buffer of pH 4.5 without any pretreatment. Fig. 5 shows the SWVs in serum (A), plasma (B) and urine (C). Fig. 5D depicts calibration plots of all three samples. The samples were spiked with known amounts of FT and its voltammetric responses were recorded. Good linearity and LOD were obtained as shown in Table 4 providing further evidence that this is a reliable method that can be applied to the determination of FT in real samples such as serum, plasma and urine. This also suggests the accuracy and selectivity of the developed method.| Samples | Regression equation Ip (μA) | Linearity (μM) | R | LOD (μM) |
|---|---|---|---|---|
| Serum | Ip = 28.60x + 4.399 | 0.1–80 | 0.954 | 0.007 |
| Plasma | Ip = 17.09x + 7.358 | 0.1–80 | 0.967 | 0.009 |
| Urine | Ip = 13.38x + 8.560 | 0.1–80 | 0.979 | 0.004 |
4. Conclusion
A highly enhancing sensing platform based on ferrocene and MWCNTs fabricated electrochemical sensor FC/MWCNTs/CPE was established for the trace detection of flutamide. The fabricated sensor showed an excellent electrocatalytic activity in increasing the cathodic over-potential and remarkable enhancement of cathodic current of FT compared with electrochemical performances obtained at CPE and MWCNTs/CPE. This selective and sensitive platform is used for the determination of flutamide for the first time. Electrochemical behaviour of FT at all three electrodes namely CPE, MWCNTs/CPE and FC/MWCNTs/CPE has been evaluated. It was noticed that FC/MWCNTs/CPE exhibited excellent selectivity and sensitivity towards FT detection. Moreover, the proposed method is highly sensitive having very low detection limit, wide linear dynamic range, very good reproducibility, and repeatability over other methods reported in literature. It is expected that the proposed method will be of great help to both clinical as well as pharmaceutical industries.Acknowledgements
The authors are thankful to the Head, Department of Chemistry, K L University, Guntur, Andhra Pradesh, India for providing necessary laboratory facilities. This work is financially supported by Science and Engineering Research Board, (Grant No. SB/FT/CS-019/2014) New Delhi, India, under its Fastrack Young Scientists Scheme and UGC, New Delhi under its UGC research award scheme for teachers (Grant no. 30-12/2015 SA-II).References
- R. N. Brogden and S. P. Clissold, Flutamide Drug., 1989, 38, 185 CrossRef CAS.
- M. Jonler, M. Riehmann and R. C. Bruskewitz, Drugs, 1994, 47, 66 CrossRef CAS PubMed.
- A. K. Jain, V. K. Gupta, L. P. Singh and J. R. Raisoni, Electrochim. Acta, 2006, 51, 2547 CrossRef CAS.
- V. K. Gupta, M. R. Ganjali, P. Norouzi, H. Khani, A. Nayak and S. Agarwal, Crit. Rev. Anal. Chem., 2011, 41, 282 CrossRef CAS PubMed.
- R. Jain, V. K. Gupta, N. Jadon and K. Radhapyari, Anal. Biochem., 2010, 407, 79 CrossRef CAS PubMed.
- V. K. Gupta, A. K. Singh, S. Mehtab and B. Gupta, Anal. Chim. Acta, 2006, 566, 5 CrossRef CAS.
- A. Kutluay and M. Aslanoglu, Anal. Chim. Acta, 2014, 839, 59 CrossRef CAS PubMed.
- P. K. Kalambate, B. J. Sanghavi, S. P. Karna and A. K. Srivastava, Sens. Actuators, B, 2015, 213, 285 CrossRef CAS.
- T. Tavana, M. A. Khalilzadeh, H. Karimi-Maleh, A. A. Ensafi, H. Beitollahi and D. Zareyee, J. Mol. Liq., 2012, 168, 69 CrossRef CAS.
- Y. Teng, L. Fan, Y. Dai, M. Zhong, X. Lu and X. Kan, Biosens. Bioelectron., 2015, 71, 137 CrossRef CAS PubMed.
- J. A. Rather and K. D. Wael, Sens. Actuators, B, 2012, 171, 907 CrossRef.
- R. Khan and M. Dhayal, Biosen. Bioelectron., 2009, 24, 1700 CrossRef CAS PubMed.
- B. J. Sanghavi and A. K. Srivastava, Anal. Chim. Acta, 2011, 706, 246 CrossRef CAS PubMed.
- B. J. Sanghavi and A. K. Srivastava, Electrochim. Acta, 2010, 55, 8638 CrossRef CAS.
- R. R. Gaichore and A. K. Srivastava, J. Appl. Electrochem., 2012, 42, 979 CrossRef CAS.
- P. K. Brahman, R. A. Dar and K. S. Pitre, Sens. Actuators, B, 2013, 176, 307 CrossRef CAS.
- P. K. Brahman, R. A. Dar and K. S. Pitre, Sens. Actuators, B, 2013, 176, 307 CrossRef CAS.
- P. K. Brahman, N. Pandey, S. N. Topkaya and R. Singhai, Talanta, 2015, 134, 554 CrossRef CAS PubMed.
- M. Siswana, K. I. Ozoemena and T. Nyokong, Talanta, 2006, 69, 1136 CrossRef CAS PubMed.
- R. N. Goyal, V. K. Gupta and S. Chatterjee, Biosen. Bioelectron., 2009, 24, 1649 CrossRef CAS PubMed.
- J. A. Rather and K. D. Wael, Sens. Actuators, B, 2013, 176, 110 CrossRef CAS.
- L. Qu and L. Dai, J. Am. Chem. Soc., 2005, 127, 10806 CrossRef CAS PubMed.
- S. Alwarappan, S. Prabhulkar, A. Durygin and C.-Z. Li, J. Nanosci. Nanotechnol., 2009, 9, 2991 CrossRef CAS PubMed.
- G. Wu, Y. S. Chen and B. Q. Xu, Electrochem. Commun., 2005, 7, 1237 CrossRef CAS.
- S. Iijima, Nature, 1991, 354, 56 CrossRef CAS.
- H. Qi, C. Zhang and X. Li, Sens. Actuators, B, 2006, 114, 364 CrossRef CAS.
- J. Weber, A. Kumar, A. Kumar and S. Bhansali, Sens. Actuators, B, 2006, 117, 308 CrossRef CAS.
- N. Sato and H. Okuma, Sens. Actuators, B, 2008, 129, 188 CrossRef CAS.
- Y. C. Tsai and C. C. Chiu, Sens. Actuators, B, 2007, 125, 10 CrossRef CAS.
- Y. Lin, R. X. Wang and X. M. Li, Electrochem. Commun., 2005, 7, 597 CrossRef.
- S. Hrapovic, Y. Liu and K. B. Male, Anal. Chem., 2004, 76, 1083 CrossRef CAS PubMed.
- Y. C. Tsai, S. C. Li and J. M. Chen, Langmuir, 2005, 21, 3653 CrossRef CAS PubMed.
- M. G. Zhang, A. Smith and W. Gorski, Anal. Chem., 2004, 76, 5045 CrossRef CAS PubMed.
- I. Svancara, K. Kalcher, A. Walcarius and K. Vytras, Electroanalysis with Carbon Paste Electrodes, CRC Press, Francis & Taylor, 2012 Search PubMed.
- A. Leniart, M. Brycht, B. Burnat and S. Skrzypek, Sens. Actuators, B, 2016, 231, 54 CrossRef CAS.
- J. Robak, B. Burnat, A. Leniart, A. Kisielewska, M. Brycht and S. Skrzypek, Sens. Actuators, B, 2016, 236, 318 CrossRef CAS.
- G. Wang, J. J. Xu, L. H. Ye, J. J. Zhu and H. Y. Chen, Bioelectrochem., 2002, 57, 33 CrossRef CAS PubMed.
- J. Lin, C. He, Y. Zhao and S. Zhang, Sens. Actuators, B, 2009, 137, 768 CrossRef CAS.
- Y. Wang, W. Z. Wei, J. X. Zeng, X. Y. Liu and X. D. Zeng, Microchim. Acta, 2008, 160, 253 CrossRef CAS.
- L. C. Jiang and W. D. Zhang, Biosens. Bioelectron., 2010, 25, 1402 CrossRef CAS PubMed.
- D. Farthing, D. Sica, I. Fakhry, D. L. Walters, E. A. Cefali and G. Allan, Biomed. Chromatogr., 1994, 8, 251 CrossRef CAS PubMed.
- P. Nagaraja, K. R. Sunitha and M. F. Silwadi, J. Pharm. Biomed. Anal., 2000, 23, 617 CrossRef CAS PubMed.
- P. Nagaraja, H. R. Arun Kumar, R. A. Vasantha and H. S. Yathirajan, Int. J. Pharm., 2002, 235, 113 CrossRef CAS PubMed.
- P. K. Brahman, R. A. Dar, S. Tiwari and K. S. Pitre, Colloids Surf., A, 2012, 396, 8 CrossRef CAS.
- F. Ahmadi, J. B. Raoof, R. Ojani, M. Baghayeri, M. M. Lakouraj and H. Tashakkorian, Chin. J. Catal., 2015, 36, 439 CrossRef CAS.
- Y. Li, P. Wang, F. Li, X. Huang, L. Wang and X. Lin, Talanta, 2008, 77, 833 CrossRef CAS.
- Y. M. Temerk, H. S. M. Ibrahim and W. Schuhmann, Electroanalysis, 2016, 28, 372 CrossRef CAS.
- A. Alvarez-Lueje, C. Pena, L. J. Nunez-Vergara and J. A. Squella, Electroanalysis, 1998, 10, 1043 CrossRef CAS.
Footnote |
| † Electronic supplementary information (ESI) available. See DOI: 10.1039/c7ra04243d |
| This journal is © The Royal Society of Chemistry 2017 |

