 Open Access Article
Creative Commons Attribution 3.0 Unported Licence
The normal stress of an electrorheological fluid in compression mode
Zhiyuan Wanga,
Shouhu Xuana,
Wanquan Jiang b and
Xinglong Gong
 *a
*a
aCAS Key Laboratory of Mechanical Behavior and Design of Materials, Department of Modern Mechanics, University of Science and Technology of China (USTC), Hefei, China. E-mail: gongxl@ustc.edu.cn
bDepartment of Chemistry, USTC, Hefei, China
First published on 15th May 2017
Abstract
This work studied the normal stress of an ER fluid in compression mode through both experiment and simulation. The TiO2 based ER fluid was used to test the normal stress under different DC voltages and compressive speeds. The normal stress reached about tens of kPa and was affected by the applied voltage and compressive parameters. Then, a simulation model was presented to investigate the influencing factors on the normal stress. The computational normal stresses agreed well with the experimental results. Typically, the shear action was also found to be very important for the normal stress during the compression. When the shear rate is small, the shear action showed little effect on normal stress. When the shear rate exceeded a critical value, the normal stress oscillated within a certain range. At last, an ideal 2D simulation was conducted to investigate the relation between the mechanical property and the structure transformation.
Introduction
Electrorheological (ER) fluids are intelligent materials composed of microsized or nanosized dielectric particles dispersed in a liquid with a low dielectric constant.1–5 When an electric field is applied, the randomly dispersed particles are arranged to form complex column-like structures along the field. During this process, the ER fluids transit from a liquid state to a solid-like state and the apparent viscosity increases dramatically. Because of the unique ER effect, the ER fluids have broad potential in technological and industrial applications, such as sandwich structure,6,7 damper,8 actuator,9 and so on.Most applications of ER materials are operated in shear mode, in which the loading direction is perpendicular to the applied electric field. However, the shear stress of the ER fluid under an electric field of 1–5 kV mm−1 is only about several kPa,10,11 thus the application of ER fluid in shear mode is limited due to its relative low shear stress. To solve this problem, much effort has been contributed to invent ER fluids with high shear yield stress.12–16 Moreover, another loading mode also can be used to support a high load for ER fluid. In this compression mode, the ER system is stressed parallel to the electric field, thus the stress of the ER fluid has been critically increased. In comparison to the shear mode, the stress of ER fluid under compression mode is about one order of magnitude larger.17,18
Therefore, subsequent investigations have been focused on the performance of ER fluids in compression subjected to various mechanical and electrical inputs. Monkman studied ER fluids under compression which extended to higher amounts of compression. It was found that the certain ER fluids could support high normal stresses as a function of electric field and gap.19,20 Vieira et al. did a comprehensive research on the properties of ER fluids under compression and shear.21,22 Recently Tian et al. reported an ultrahigh normal stress in a slow compressive flow.23,24 By investigating the performance of ER fluids subjected to compressive loading, EI Wahed found the imposed force was highly dependent on the applied voltage and the weight fraction of the dispersed solid-phase.25 Liu et al. studied the normal force of the ER fluid employed for the haptic application, showing the application of the usage of compression mode.26 Most of previous work experimentally studied the normal stress under the compression mode. However, the related simulation on the particle structure dependent normal stress has not been reported. Besides, the ER fluid can work in both shear and compression mode at the same time.27 During the compression, the normal stress will be influenced by the shear action. Therefore, the influence of the shear action on the normal stress also requires detailed discussion.
In this work, the compression experiment was done to study the normal stress of ER fluid under different DC voltages and compression speeds. Then a simulation model was presented to study the normal stress of ER fluid in compression mode. Meanwhile, the influence of shear action on the normal stress during the compression is also discussed using the model.
Experiment
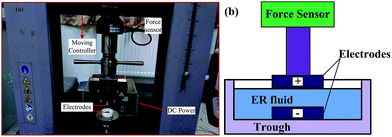
The ER fluid used in this study was prepared by dispersing TiO2 (titanium dioxide) particles in silicone oil with a volume fraction 25%. The amorphous TiO2 nanoparticles were prepared by a hydrolysis reaction of tetrabutyl titanate, the diameter of particles is about several hundred nanometers. The dielectric constant of silicone oil is 2.75, with a viscosity of 500 mPa s and a density of 0.97 g cm−3 at room temperature (25 °C). The ER fluid was compressed between two parallel copper plates (acting as electrodes, with a diameter of 20 mm) using the universal testing machine (C43.304E,MTS) with a 1000 N force sensor and a computer to record the output of the load cell and displacement (Fig. 1). The trough is made of polytetrafluoroethylene with an elastic modulus on the scale of 1 GPa, so the distortion of the insulating trough can be neglected in this experiment. Besides, the displacement resolution of the universal testing machine is 0.5 μm, so the test result is quite precise. The initial gap distance is 2.0 mm and the downward displacement of the upper plate is 1.5 mm. The upper plate is connected to a force sensor fixed on the rigid beam of universal testing machine. The upper plate is connected to the cathode, while the lower plate is connected to the anode. Before compression, a DC voltage was imposed on the ER fluid for 1–2 min in order to ensure the formation of chains structure in ER fluid. Different DC voltages and compressive speeds were applied on the sample during the compression.Model
The model ER system is supposed to consist of N interacting spherical particles of dielectric constant εp and diameter d, suspended in a silicone oil fluid of dielectric constant εf(εf < εp) and viscosity ηf. The model system is in a box with its volume V = Lx × Ly × Lz, confined between two parallel electrodes at z = 0 and Lz. An external electric field is applied along the z direction. The lower electrode is maintained stationary, and the upper electrode is lowered to squeeze the ER fluid. Lz is decreasing during compression. It has been found that the electric field holds most of the particles between plates and the dispersing phase is squeezed out during compression.28,29 Because of the very slow compressive speed, we can make an approximation that the number of ER particles remains unchanged during compression in our simulation model.The motion of ith particle having mass m at time t and position ri(t) is described by the following classical equation of motion:30
md2ri/dt2 = Fi − 3πdηf(dri/dt − ![[small gamma, Greek, dot above]](https://www.rsc.org/images/entities/i_char_e0a2.gif) zi zi![[x with combining circumflex]](https://www.rsc.org/images/entities/i_char_0078_0302.gif) ) + Ri ) + Ri
| (1) |
 , t* = t/[3πηfd3/(kBT)],
  ,
,  . So eqn (1) can be rewritten as
 | (2) |
![[small gamma, Greek, dot above]](https://www.rsc.org/images/entities/i_char_e0a2.gif) /(8kBT). For most real parameters of ER fluids, the magnitude of A in eqn (2) is very small (∼10−10), so in the following simulations we neglect this inertial effect. Thus, it can be simplified as
/(8kBT). For most real parameters of ER fluids, the magnitude of A in eqn (2) is very small (∼10−10), so in the following simulations we neglect this inertial effect. Thus, it can be simplified as
 | (3) |
Eqn (3) is integrated with a time step  using Euler's method;
  is the dimensionless maximum inter-particle force that acts on particles, thus, the maximum displacement of particles cannot exceed 0.01. Periodic boundary conditions are imposed in the x and y directions, reflecting boundary conditions in the z direction.
In the dynamic state, rheological properties are determined by the effective viscosity ηeff = 〈τzx〉/![[small gamma, Greek, dot above]](https://www.rsc.org/images/entities/i_char_e0a2.gif) , where τzx is the component of the stress tensor, which is an averaged value of the simulations. By using the Bingham model, τzx is expressed as τzx = τE + ηs
, where τzx is the component of the stress tensor, which is an averaged value of the simulations. By using the Bingham model, τzx is expressed as τzx = τE + ηs![[small gamma, Greek, dot above]](https://www.rsc.org/images/entities/i_char_e0a2.gif) , where ηs is the viscosity of suspensions (without an electric field). Later, Cho–Choi–Jhon (CCJ) model is presented to describe the rheological equation of state of ER fluids.33 In order to definitely understand the relationship of the particle interactions, we focused on the electric field induced shear stress τE, which was calculated by eqn (2):34
, where ηs is the viscosity of suspensions (without an electric field). Later, Cho–Choi–Jhon (CCJ) model is presented to describe the rheological equation of state of ER fluids.33 In order to definitely understand the relationship of the particle interactions, we focused on the electric field induced shear stress τE, which was calculated by eqn (2):34
 | (4) |
And the average normal stress is calculated by eqn (3):
 | (5) |
Results and discussion
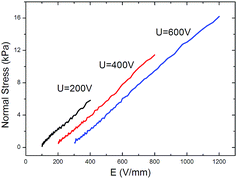
Fig. 2 shows the normal stress of TiO2 ER fluid under compression with different gap distance and compressive strain. The compressive strain is calculated as ε = (h0 − h)/h0, where h0 is the initial gap distance between the parallel plates and h is the instantaneous gap distance. During this test, the compressive speed keeps 1 mm min−1. A constant voltage was imposed on the ER fluid before compression to ensure the formation of chains structure. The normal stress of silicone oil alone was also tested in Fig. 2, and the curve of the normal stress almost a straight line (close to 0). No ER effect is found for the silicone oil, so the influence silicone oil on the normal stress is neglect. The normal stress increases with the decrease of gap distance or the increase of compressive strain, and the normal stress reached about tens of kPa. The chains become bigger in the radial direction as the gap distance decrease. Meanwhile, the electric field increases with decreasing of the gap distance and increasing of the applied voltage. Thus the electrostatic interaction between the neighboring particles is enhanced. Then the particle chain structure is more highly and strongly interconnected to support a high load, and thus provides higher possibility in practical application. The normal stress versus electric field strength is shown in Fig. 3. The normal stress increases rapidly with increasing of the electric field strength. The normal stresses under different voltages are not equal when the electric field strength is the same. Here, the compressive strain decreases from the condition of U = 200 V to the condition of U = 600 V and the normal stress decreases at the same time, so the normal stress critically depends on the compressive strain.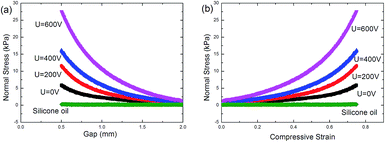 | ||
| Fig. 2 Normal stress of ER fluid versus gap distance (a) and compressive strain (b) under compression. The compressive speed is 1 mm min−1 and the initial gap distance is set at 2 mm. | ||
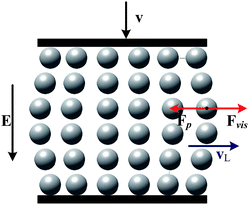
In Fig. 4, the different compressive speeds were applied in the test and the initial gap between electrodes is set at 2 mm. Different compressive speeds of 0.5 mm min−1, 1.0 mm min−1 and 2.0 mm min−1 had been used under the voltages of 400 V and 600 V. We can find that the slower speeds actually produce lager stress at the same compressive strain (Fig. 4(a) and (b)). This is opposite to the one expected in squeeze flow, which may be caused by the heterogeneity of the ER fluid under electric field.28 When a constant voltage is applied, the ER particles form chain structures across the two electrodes. A sketch of the structure of ER fluid during compression is shown in Fig. 5. During compression, the liquid flowing through the gaps of particles produces a pressure to destroy or deform the chains structure.24 For the ER particles, they experience a viscous force Fvis acting by the liquid and interaction force Fp from other particles. The particles will be squeezed out with the silicone oil from electrodes because of viscous force. But the interaction force from other particles makes the ER particles stay relatively stable. Then the particles which are squeezed out from the mother ER fluid are less than the silicone oil relative to the volume fraction of the sample. The slower compressive speed corresponds to smaller viscous force acting on the particles, so the particles squeezed out will be less and the particle chains structure keeps more intact to support a higher load. Therefore, the slower compressive speed produces lager normal stress. The above result indicates the separation between particles and oil occurs during compression, and this phenomenon increases the normal stress under small compressive speed.
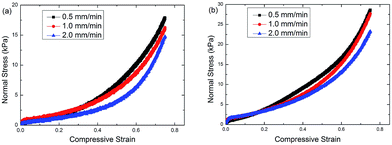 | ||
| Fig. 4 Normal stress of ER fluid versus compressive strain under different compressive speeds. The applied voltage is 400 V (a) and 600 V (b). | ||
Our simulations are carried out in a three-dimensional box (Lx = 15d, Ly = 5d, Lz = 15d) with parameters as follows: T = 300 K, εp = 100, εf = 2, d = 1 μm, ηf = 0.5 Pa·s, and particle number N = 240. In order to definitely understand the relationship of the particle interactions, we focused on the electric field induced stress. σE/σ0 (Normal_Stress*) represents the relative normal stress, where σE is the normal stress induced by electric field and σ0 is the initial normal stress without electric field. To simply the simulation, the change of the particle number is ignored.
Fig. 6 shows the comparison of the normal stress induced by electric field between the experiment result and simulation result. The σE in the experiment is calculated by the equation: σE = σ|E≠0 − σ|E=0, and the σE in the simulation is calculated out using the simulation model. The initial electric field is 100 V mm−1 in both experiment and simulation, in which the voltage is 200 V in the experiment and 1.5 V in the simulation. It can be seen that the microstructure dependent computational normal stresses are in good agreement with the experimental results, indicating the simulations are rational.
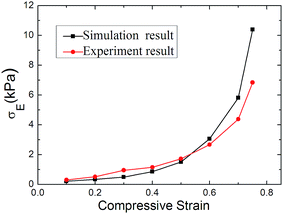 | ||
| Fig. 6 The electric field induced normal stress of ER fluid versus compressive strain under compression. | ||
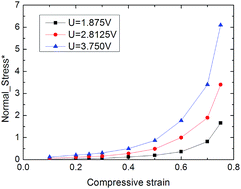
Fig. 7 shows the simulation result of normal stress under different DC voltages. The value of voltage is set according to the electric field strength. The initial gap between the electrodes is 15 μm in the simulation, so the initial electric field strength is 125 V mm−1, 187.5 V mm−1, 250 V mm−1 with the voltage of 1.875, 2.8125 and 3.750. The normal stress increases with increasing of the applied voltage, showing obvious ER effect. Moreover, the normal stress increases with the compressive strain, especially at large compressive strain. It implies that the ER particles have stronger load capability at smaller gap distance. As the applied voltage is constant, the electric field strength is enhanced with closer electrodes, and then the electric field induced a stronger stress. Meanwhile, the interval between ER particles also becomes smaller because the particles distribution space is reduced. Therefore the interaction force between particles is enhanced. Besides, the particles structure becomes more stable with smaller space. When the number of ER particles keeps constant, the particles chains or columns structure will be thickened to support higher load at smaller gap size.
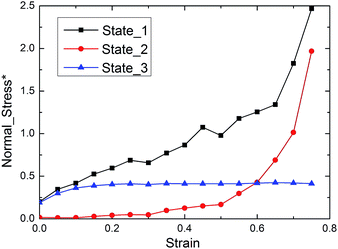
Then, to check the compression impact on the normal stress of ER fluid, the normal stresses under different states are calculated. Fig. 8 shows the normal stresses under a constant electric field of 0.5 kV mm−1 with/without compression (state 1/state 3). Meanwhile, the normal stress with compression under a constant voltage of 1.875 V (state 2) is also calculated. When the compression is finished, the electric field strength is equal to that in state 1 and 3, which are all 0.5 kV mm−1. In state 3, the normal stress derives from the shear action. Here the adopted shear rate (0.01 s−1) is the same with compressive speed, so the shear strain is equal to the compressive strain. Without compression, the normal stress is quite small relative to that under compression with the same electric field. As for state 2, in initial stage the normal stress is below that under no compression, because the electric field strength is quite small. With the compression continuing, the electric field is enhanced as the gap between electrodes is decreased, and then the interaction force between particles is also strengthened. So the normal stress in state 2 exceeds than that in state 3 at large strains and becomes close to that in state 1. Therefore, the electric field strength and compressive strain both have obvious influence on the normal stress of ER fluid, which matches the experimental result very well.
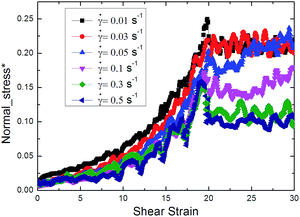
During the practical application, the ER fluid may work in both shear and compression mode at the same time, in which the rotation of the plate exerts a shear action on the ER fluid and the plate moves down to compress the ER fluid. Therefore, the influence of the shear action on the normal stress under the compression is very important. Here the ER particles are sheared at a constant shear rate and compressed at a constant rate at the same time. To investigate the influence of shear action, the ER particles are still sheared for a certain time after compression is finished. The compression is finished when the shear strain reaches 20. The applied voltage is a constant, and the initial electric field is 125 V mm−1 and the electric field is 500 V mm−1 when the compression is finished.
Fig. 9 shows the influence of shear rate on the normal stress. Under low shear rate, it can be found that the normal stresses are similar during compression. With increasing of the shear rate, the normal stress slightly decreases. After compression, the normal stress oscillates in a small range, it remains basically stable. When the shear rate is small (0.01, 0.03 s−1), the normal stress almost keeps stable after compression. This suggests that shear action has little effect on normal stress in this stage. But with the increase of shear rate, the normal stress decreases after compression and oscillates within a certain range. Under an applied steady shear field, the particle chains tilt to shear direction and keep intact. And the tilt angle of the chains increases with the shear rate increasing. Then the Z-direction component of the stress induced by electric field, i.e., the normal stress will decrease when the interaction of particles keeps stable. Therefore the normal stress decreases with the increasing of the shear rate. Besides, the tilt angle has a maximum value where the particle chains can keep intact. When the shear rate is too large, the particle chains will be destroyed and the interaction force between particles will decline obviously, so the normal stress decreases. After the destruction of chains structure, the particles will recombine to form chains again, and then the interaction force is enhanced and the normal stress increases. As the chains structure experiences destruction and reformation repeatly, the normal stress shows oscillation phenomenon when the shear rate is large enough and the normal stress declines, just as the shear rate equals 0.3 or 0.5 s−1 in Fig. 9.
Then we go on to find out the reason of the oscillation of normal stress. In order to understand the relation between the stress change and the structures transformation, an ideal simulation is also conducted in a two-dimensional situation. The simulation is conducted in a two-dimensional box (15 × 15), and several perfect chains are formed at beginning along Z direction. The particles are only sheared along X direction.
Fig. 10 shows the simulation result of the relative stress versus the strain when the shear rate is 0.01 s−1. X-Stress is the X component of the stress tensor, and the shear is in the X direction, so X-stress is the shear stress. Z-Stress is the Z component of the stress tensor, representing normal stress. When the shear rate is small, the shear stress and normal stress both remain stable after initial change. At beginning, the chains tilt to shear direction, and then the chain structure remains intact after the fine adjustment of particle interval. As the shear rate is quite small, the viscous force acting on the particles is too small to destroy the chains. So the chains structure doesn't experience destruction and reformation, and the stress keeps unchanged.
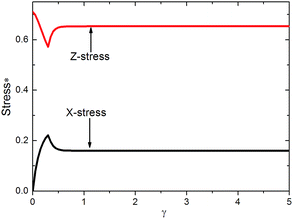 | ||
Fig. 10 Two-dimensional simulation results of the relative stress versus the strain with five chains. E = 100 V mm−1, and ![[small gamma, Greek, dot above]](https://www.rsc.org/images/entities/i_char_e0a2.gif) = 0.01 s−1. = 0.01 s−1. | ||
With increasing of the shear rate, the stress transits to oscillation state (Fig. 11). According to the change of the stress, the transformation can be divided into four regions and the corresponding structure is also calculated. The region I begins with the largest shear stress and ends with the smallest normal stress, corresponding to B → C process. At the beginning, the chains reach the largest tilt angle where the chain structure can be kept. Then the particle interval becomes too large and the chain structure is destroyed by the viscous force. And the structure is destroyed in the middle area, while the particles next to the electrodes are still in the chain structure. So the normal stress and shear stress decrease at the same time. Region II begins with the smallest normal stress and ends with the smallest shear stress (C → D process). After experiencing the destruction, the chains will be reformed along the Z direction. The normal stress increases gradually, but the shear stress continue to decrease to a minimum value. Region III begins with the smallest shear stress and ends with the largest normal stress (D → E process). If the chains are rearranged along the Z direction entirely, the smallest shear stress and largest normal stress will appear at the same time. But in fact the two states don't coexist in region III. This may be caused by the fine adjustment of particle interval. Region IV begins with the largest normal stress and ends with the largest shear stress (E → F process). The chains begin to tilt to the shear direction and remain intact. Then the shear stress increases and the normal stress decreases. The state F is similar to state B, indicating that the chains structure changes periodically. The chains structure experiences destruction and reformation repeatedly, so the normal stress is oscillating. And the oscillation of normal stress can be explained by the structure transformation.
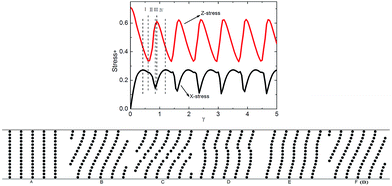 | ||
Fig. 11 Two-dimensional simulation results of the relative stress versus the strain and corresponding structure transformation with five chains. E = 100 V mm−1, and ![[small gamma, Greek, dot above]](https://www.rsc.org/images/entities/i_char_e0a2.gif) = 0.1 s−1. = 0.1 s−1. | ||
Conclusions
Both the experiment and simulation were conducted to study the normal stress of the ER fluid in compression mode. The normal stress of the titanium dioxide ER fluid under compression was tested. Then a simulation model was presented to understand the influence on the normal stress. Both the experiment and simulation indicate that the normal stress can be affected by the applied voltage and the compressive parameters. Moreover, the simulation model also demonstrates the shear action also affects the normal stress. When the shear rate is small, the shear action has little effect on normal stress. When the shear rate exceeds a critical value, the normal stress oscillates within a certain range. An ideal 2D simulation is conducted to observe the relations between the mechanical property and the structure transformation.Acknowledgements
Financial supports from the National Natural Science Foundation of China (Grant No. 11372301), the fundamental research funds for the Central Universities (WK2480000002), and the Strategic Priority Research Program of the Chinese Academy of Sciences (Grant No. XDB22040502) are gratefully acknowledged. This study was also supported by the Collaborative Innovation Center of Suzhou Nano Science and Technology.References
- T. C. Halsey, Science, 1992, 258, 761–766 Search PubMed.
- P. Sheng and W. J. Wen, Annu. Rev. Fluid Mech., 2012, 44, 143–174 CrossRef.
- J. B. Yin, Y. J. Shui, Y. Z. Dong and X. P. Zhao, Nanotechnology, 2014, 25, 045702 CrossRef PubMed.
- M. W. Kim, I. J. Moon, H. J. Choi and Y. Seo, RSC Adv., 2016, 6, 56495–56502 RSC.
- X. W. Wang, X. Qian, X. C. Jiang, Z. Lu and L. X. Hou, RSC Adv., 2016, 6, 26096–26103 RSC.
- A. Allahverdizadeh, M. J. Mahjoob, I. Eshraghi and N. Nasrollahzadeh, Int. J. Mech. Sci., 2013, 70, 130–139 CrossRef.
- M. Eshaghi, R. Sedaghati and S. Rakheja, J. Intell. Mater. Syst. Struct., 2016, 27, 2003–2037 Search PubMed.
- K. G. Sung, M. S. Seong and S. B. Choi, Meccanica, 2013, 48, 121–134 Search PubMed.
- T. Miyoshi, K. Yoshida, J. W. Kim, S. I. Eom and S. Yokota, Sens. Actuators, A, 2016, 245, 68–75 Search PubMed.
- H. See, J. Ind. Eng. Chem., 2004, 10, 1132–1145 CAS.
- X. P. Zhao and J. B. Yin, J. Ind. Eng. Chem., 2006, 12, 184–198 Search PubMed.
- H. J. Choi and M. S. Jhon, Soft Matter, 2009, 5, 1562–1567 RSC.
- W. L. Zhang, Y. D. Liu, H. J. Choi and Y. Seo, RSC Adv., 2013, 3, 11723–11731 RSC.
- Y. P. Seo, H. J. Choi and Y. Seo, Polym. Adv. Technol., 2015, 26, 117–120 CrossRef CAS.
- M. Ilcikova, M. Mrlik, V. Babayan and P. Kasak, RSC Adv., 2015, 5, 57820–57827 RSC.
- J. H. Wu, Z. Y. Song, F. H. Liu, J. J. Guo, Y. C. Cheng, S. Q. Ma and G. J. Xu, NPG Asia Mater., 2016, 8, e322 CrossRef CAS.
- Y. Tian, S. Z. Wen and Y. G. Meng, Phys. Rev. E: Stat., Nonlinear, Soft Matter Phys., 2003, 67, 51501 CrossRef PubMed.
- Y. G. Meng and F. E. Filisko, J. Appl. Phys., 2005, 98, 074901 CrossRef.
- G. J. Monkman, J. Phys. D: Appl. Phys., 1995, 28, 588–593 CrossRef CAS.
- G. J. Monkman, Mechatronics, 1997, 7, 27–36 CrossRef.
- S. L. Vieira and A. C. F. de Arruda, J. Intell. Mater. Syst. Struct., 1998, 9, 44–52 CrossRef CAS.
- S. L. Vieira, M. Nakano, R. Oke and T. Nagata, Int. J. Mod. Phys. B, 2001, 15, 714–722 CrossRef.
- Y. Tian, M. L. Zhang, X. L. Zhu, Y. G. Meng and S. Z. Wen, Smart Mater. Struct., 2010, 19, 035009 CrossRef.
- Y. Tian, X. L. Zhu, J. L. Jiang, Y. G. Meng and S. Z. Wen, Smart Mater. Struct., 2010, 19, 105024 CrossRef.
- A. K. El Wahed, Mater. Des., 2011, 32, 1420–1426 CrossRef CAS.
- Y. D. Liu, B. M. Lee, T. S. Park, J. E. Kim, H. J. Choi and S. W. Booh, J. Colloid Interface Sci., 2013, 404, 56–61 CrossRef CAS PubMed.
- C. Gracia-Fernández, S. Gómez-Barreiro, A. Elmoumni, A. Álvarez, J. López-Beceiro and R. Artiaga, J. Rheol., 2016, 60, 121–127 CrossRef.
- R. Lynch, Y. Meng and E. Filisko, J. Colloid Interface Sci., 2006, 297, 322–328 CrossRef CAS PubMed.
- E. C. McIntyre and F. E. Filisko, J. Rheol., 2010, 54, 591–603 CrossRef CAS.
- H. X. Guo, Z. H. Mai and H. H. Tian, Phys. Rev. E: Stat. Phys., Plasmas, Fluids, Relat. Interdiscip. Top., 1996, 53, 3823–3831 CrossRef CAS.
- X. L. Gong, F. Yang, S. H. Xuan, L. H. Zong, W. Zhu and W. Q. Jiang, Phys. Rev. E: Stat., Nonlinear, Soft Matter Phys., 2011, 84, 061505 CrossRef CAS PubMed.
- Z. Y. Wang, X. L. Gong, F. Yang, W. Q. Jiang and S. H. Xuan, J. Intell. Mater. Syst. Struct., 2015, 26, 1141–1149 CrossRef CAS.
- M. S. Cho, H. J. Choi and M. S. Jhon, Polymer, 2005, 46, 11484–11488 CrossRef CAS.
- Z. H. Sun, X. X. Wang, A. K. Soh and H. A. Wu, Modell. Simul. Mater. Sci. Eng., 2006, 14, 423–431 CrossRef.
| This journal is © The Royal Society of Chemistry 2017 |

