 Open Access Article
Creative Commons Attribution 3.0 Unported Licence
A comparative study of nematic liquid crystals doped with harvested and non-harvested ferroelectric nanoparticles: phase transitions and dielectric properties
Y. Lin a,
A. Daoudib,
F. Duboisa,
J.-F. Blach
 c,
J.-F. Henninot
 c,
O. Kurochkind,
A. Grabare,
A. Segovia-Merab,
C. Legranda and
R. Douali*a
aUnité de Dynamique et Structure des Matériaux Moléculaires (UDSMM), Université du Littoral Côte d’Opale (ULCO), 62228 Calais, France. E-mail: douali@univ-littoral.fr
bUnité de Dynamique et Structure des Matériaux Moléculaires (UDSMM), Université du Littoral Côte d’Opale (ULCO), 59140 Dunkerque, France
cUniv. Artois, CNRS, Centrale Lille, ENSCL, Univ. Lille, UMR 8181, Unité de Catalyse et de Chimie du Solide (UCCS), F-62300 Lens, France
dInstitute of Physics of National Academy of Sciences of Ukraine, 46 prospect Nauky, 03028 Kyiv, Ukraine
eInstitute of Solid State Physics and Chemistry, Uzhgorod National University, 54 Voloshin Str., 88000 Uzhgorod, Ukraine
First published on 14th July 2017
Abstract
Harvested and non-harvested tin thiohypodiphosphate (Sn2P2S6) ferroelectric nanoparticles are used to dope the 4-n-octyl-4′-cyanobiphenyl liquid crystal (8CB). Due to their higher average spontaneous polarization, the harvested nanoparticles have stronger interactions with the liquid crystal molecules which leads to a higher order parameter as demonstrated by the increase in phase transition temperatures. This is confirmed by the results of dielectric characterization. In the homeotropic orientation, the increase in the order parameter leads to a higher dielectric permittivity. In the planar orientation, the coupling between the spontaneous polarization of the nanoparticles and the order parameter induces a slight reorientation of the liquid crystal director from the initial planar orientation, leading to an increase in the dielectric permittivity. This effect is more important for the liquid crystal doped with harvested nanoparticles.
1 Introduction
Nematic liquid crystals doped with ferroelectric nanoparticles have been of great interest over the past decade. This hybrid system is obtained by the dispersion of low nanoparticle concentrations (<1 wt%), which allows the modification of several intrinsic properties of the liquid crystal, such as the optical diffraction and birefringence,1–3 the dielectric anisotropy,4–6 and the phase transition temperatures.7,8 These hybrid materials open new perspectives to improve the performance of liquid crystal based devices.5,9–11 Due to the effects of spontaneous polarization, doping with ferroelectric nanoparticles leads to an increase in the liquid crystal order parameter.7,8,12,13 The permanent polarization of nanoparticles depends on their size, shape and aggregation, the mechanical treatment, etc.14 In some cases, elaboration leads to nanoparticles with different spontaneous polarizations; a part of them can present a weak or null spontaneous polarization. The absence of permanent polarizations of nanoparticles is considered to be responsible for the low reproducibility of the performances of these hybrid systems.8,15 Recently, the harvesting technique proposed by G. Cook et al. has been used for extracting single nanoparticles with strong permanent dipole moments.16–22 As reported by A. Rudzki et al., harvested ferroelectric barium titanate (BaTiO3) nanoparticles present a polarization four times higher than that of the non-harvested nanoparticles.21,22 In this paper, we use broadband dielectric spectroscopy to determine the dielectric properties and phase transitions of the 4-n-octyl-4′-cyanobiphenyl liquid crystal (8CB) doped with harvested and non-harvested ferroelectric nanoparticles.2 Experimental
2.1 Materials
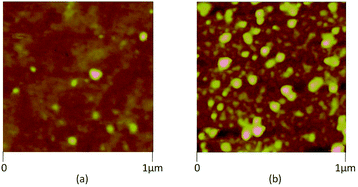
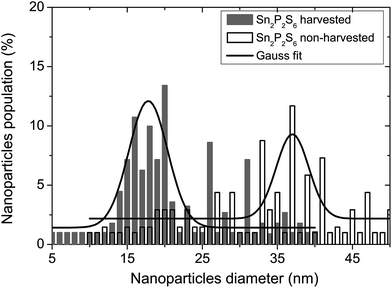
In this study, the 8CB liquid crystal from Frinton Laboratories (USA) was used as the matrix. It presents a large dielectric anisotropy ε′a ≈ 8 at room temperature and exhibits the following phase sequence: crystalline (C)–smectic A (SmA)–nematic (N)–isotropic (I).We carried out measurements on the suspension of the 8CB nematic liquid crystal doped with tin thiohypodiphosphate (Sn2P2S6) nanoparticles. The Sn2P2S6 crystals were synthesized at Uzhgorod University and the nanoparticles were produced by the Reznikov group. At room temperature, the single crystal had a spontaneous polarization (P) of 14 µC cm−2 parallel to the [101] direction of the monoclinic cell. The nanoparticles were prepared by milling microsized particles together with oleic acid in a vibration mill for 120 h. The oleic acid was used as a surfactant on the nanoparticles’ surfaces in order to avoid the formation of aggregates.8 The nanoparticle suspension was obtained at a concentration of 0.1 wt%. The morphology of the resulting particles was characterized using atomic force microscopy (AFM, Veeco multimode equipped with a nanoscope IIIa controller, power of diode laser: 1 mW, λ = 690 nm) by depositing the nanoparticle/heptane stabilized suspension on quartz substrate by a dip coating method, as shown in Fig. 1. The size distribution of the obtained nanoparticles is shown in Fig. 2 as a histogram; the data was fitted with the Gaussian distribution function:23,24
 | (1) |
The nanoparticles in the resulting suspension were selected by the harvesting technique. In this method, separation of the polarized and non-polarized particles occurred in the gradient of a DC field between 10 and 20 kV, which was applied to the nanoparticle suspension.16,25 The harvesting procedure was performed using the experimental setup proposed in ref. 16. In this method, the suspension of ferroelectric particles and surfactant in heptane was put in a glass container. There was a thin inner wire electrode at the center of the container and an external radial foil electrode wrapped around the container. The inner wire electrode was put inside a thin-walled, sealed glass capillary tube. The physical separation between the inner wire electrode and the outer foil electrode was approximately 1 cm. When the high DC voltage was applied to the inner wire electrode while the outer foil electrode was grounded, a strong gradient of the field was produced in the direction of the inner electrode. Then the nanoparticles with strong polarization were collected on the inner electrode, and the average diameter obtained from eqn (1) was about 18 nm as shown in Fig. 2. This harvesting technique selected a very small number of nanoparticles which could not be weighed. The dispersion of these nanoparticles in heptane resulted in an unknown concentration which was still much lower than the suspension of non-harvested nanoparticles. This could be visually checked from the suspension color which presented a more clear aspect.
The two types of ferroelectric nanoparticles in heptane were dissolved in the 8CB liquid crystal with different concentrations (Table 1) and then mixed by magnetic agitation for 30 min at 50 °C to ensure homogeneous dispersion. These nanocolloids were stirred ultrasonically for one day and the solvent was then slowly evaporated. The present comparative study concerns the non-doped liquid crystal (nanocolloid #1), one nanocolloid with non-harvested nanoparticles (nanocolloid #2) and two nanocolloids with harvested nanoparticles (nanocolloids #3 and #4). For the non-harvested nanoparticles dispersed with the 8CB liquid crystal, we previously showed that the volume concentration, ϕNP = 0.08%, allows optimization of the effects of the nanoparticles.8,13 Moreover this concentration corresponds to a homogeneous dispersion. For these reasons, this concentration was chosen for nanocolloid #2. Using the suspension containing the harvested nanoparticles, we prepared one nanocolloid (#3) with the same quantity of suspension during the elaboration as for nanocolloid #2, then the concentration ϕNP3 was much lower than that of nanocolloid #2. Nanocolloid #4 presented a concentration ϕNP4 = 3ϕNP3. To estimate the statistical measurement errors in comparison with any variation due to the effects of the nanoparticles, we prepared a minimum of two mixtures for each concentration of nanoparticles.
| Nanocolloid | Comment |
|---|---|
| #1 | Non-doped 8CB liquid crystal |
| #2 | 8CB/Sn2P2S6 non-harvested (ϕNP2 = 0.08%) |
| #3 | 8CB/Sn2P2S6 harvested (ϕNP3 ≪ ϕNP2) |
| #4 | 8CB/Sn2P2S6 harvested (ϕNP4 = 3ϕNP3) |
2.2 Experimental setup
Differential Scanning Calorimetry (DSC) measurements were performed on TA Instruments (DSCQ1000) equipped with a liquid nitrogen system allowing cooling and heating ramps. A rate of 2 °C min−1 (for heating and cooling runs) was applied in the temperature range from 20 °C to 80 °C. For each mixture, DSC measurements were carried out for at least two samples, and two experiments were carried out for each sample.For the dielectric measurements we used commercial cells from PPW AWAT (Poland) made from two glass substrates coated with conducting ITO (indium tin oxide) layers. On the ITO layers, the polyimides SE130 and SE1211 were coated to align the liquid crystal molecules with the planar and homeotropic orientations, respectively. The cells had a thickness of 20 µm and were filled by capillary action with the nanocolloids in nematic phase. The cells were then introduced in an appropriate heating stage and measurements were made using a Hewlett Packard 4284A Impedance Analyzer covering the frequency range from f = 20 Hz to f = 1 MHz.13 The amplitude of the measuring sinusoidal electric field was fixed at 0.1 V. For each mixture, a minimum of two samples were measured for each orientation.
3 Results and discussion
3.1 Phase transition temperatures from calorimetric measurements
Fig. 3 displays the DSC thermograms corresponding to the different nanocolloids. All of the DSC thermograms clearly exhibited two phase transitions, smectic A–nematic and nematic–isotropic, and allowed us to determine corresponding temperatures for the non-doped liquid crystal (T0SmA–N = 32.6 °C and T0N–I = 39.6 °C) and the three nanocolloids. Table 2 shows the shifts ΔTSmA–N and ΔTN–I between the phase transition temperatures of the nanocolloids and those of the non-doped liquid crystal. These shifts indicate a variation of the liquid crystal order parameter SLC related to the doping ferroelectric nanoparticles, which also present an order parameter SNP in the nanocolloids. We have previously discussed the origin of the shifts ΔTSmA–N and ΔTN–I;8,13 they result from a competition between two principal effects. The first effect, related to the permanent polarization of nanoparticles, is favorable to the increase of phase transition temperatures.7,12 The second effect is linked to the anchoring interactions between liquid crystal molecules and inclusions; 26–28 these interactions disturb the liquid crystal order and are unfavorable to the increase of phase transition temperatures.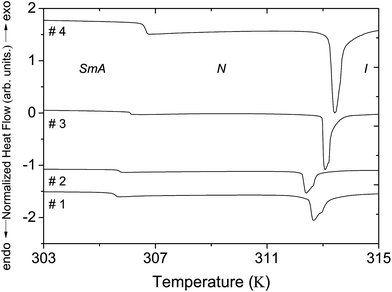 | ||
| Fig. 3 DSC thermograms of the non-doped 8CB liquid crystal and nanocolloids. The thermograms are shifted along the ordinate axis for clarity. | ||
| Nanocolloid | #2 | #3 | #4 |
|---|---|---|---|
| ΔTSmA–N | +0.10 ± 0.02 | +0.50 ± 0.02 | +1.20 ± 0.02 |
| ΔTN–I | −0.40 ± 0.02 | +0.40 ± 0.02 | +0.75 ± 0.02 |
For the non-harvested Sn2P2S6 nanoparticles dispersed in the 8CB liquid crystal (nanocolloid #2), we have already demonstrated that the shift ΔTN–I determined from the DSC measurements is negative and increases (in absolute value) with the nanoparticle concentration. This indicates a decrease of the liquid crystal order parameter due to a predominant anchoring effect.8 For low concentrations (ϕNP < 0.13%, homogeneous nanoparticles dispersion), the dependence of ΔTN–I on the nanoparticle concentration is quasi-linear; it becomes stronger for higher concentrations due to the reduction of the polarization effect by the formation of aggregates. Moreover, the shift ΔTSmA–N increases for low concentrations (predominant polarization effect) and then decreases for higher concentrations (predominant anchoring effect). In this study, the discussion is focused on nanocolloids with homogeneous nanoparticle dispersion.8 In such conditions, both the polarization and anchoring effects induce a linear dependence of TN–I on the nanoparticle concentration according to the expressions:5,7,8,12,28
 | (2) |
| ΔTN–I = −(1 + B)ϕNPT0N–I, | (3) |
Table 2 clearly shows that nanocolloid #3 with harvested nanoparticles presented shifts ΔTN–I and ΔTSmA–N which were higher than those of nanocolloid #2, although the nanoparticle concentration in nanocolloid #3 was much lower than in nanocolloid #2. This means that the ratio between the polarization and anchoring effects was more pronounced in the suspension with harvested nanoparticles. Concerning the smectic-A–nematic phase transition, the observed shift for each nanocolloid was higher than ΔTN–I, which confirms that the ferroelectric nanoparticle polarization effect is more favorable to smectic A order, as discussed in our previous paper.8
It is interesting to compare the results of the nanocolloids with the harvested nanoparticles (nanocolloids #3 and #4). In comparison with nanocolloid #3, nanocolloid #4 presented a concentration three times higher, but a ΔTN–I shift only nearly two times higher. This non-linear increase led to a saturation effect of the phase transition temperature and the order parameter. We highlight that the saturation is not taken into account in eqn (2). However, the smectic-A–nematic phase transition temperature had a different nanoparticle concentration dependence to that of TN–I. This could be related to the presence of the coupling between smectic and nematic ordering.8,13,29
3.2 Phase transition temperatures from dielectric measurements
We previously showed that phase transition temperatures can also be determined from the temperature dependence of dielectric permittivity.13 The phase transition temperature TN–I was obtained from the discontinuities of the plots ε′∥(T) and ε′⊥(T). The smectic-A–nematic phase transition temperature was evaluated from particular parts of the plots: at TSmA–N, the ε′∥(T) and ε′⊥(T) plots show a maximum and an inflection point, respectively. The phase transition temperatures obtained from the plots ε′∥(T) and ε′⊥(T) were the same. Fig. 4 presents the ε′∥(T) and ε′⊥(T) plots near the nematic–isotropic and the smectic-A–nematic phase transitions, respectively, at 1 kHz. The shifts TSmA–N and TN–I between the phase transition temperatures of the nanocolloids and those of the non-doped liquid crystal (TSmA–N = 32.8 °C and TN–I = 39.6 °C) are given in Table 3.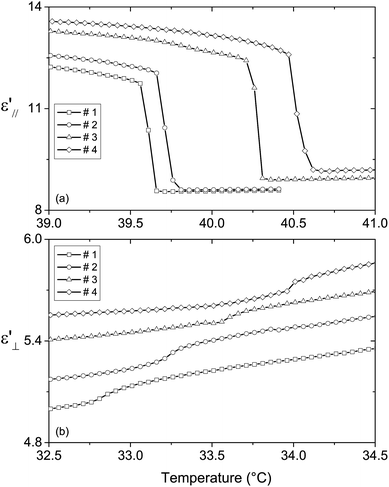 | ||
| Fig. 4 Temperature dependence of (a) ε′∥ near the nematic–isotropic phase transition and (b) ε′⊥ near the smectic-A–nematic phase transition for the non-doped and doped liquid crystals. | ||
| Nanocolloid | #2 | #3 | #4 |
|---|---|---|---|
| ΔTSmA–N | +0.45 ± 0.04 | +0.70 ± 0.03 | +1.20 ± 0.04 |
| δTSmA–N | +0.35 ± 0.06 | +0.20 ± 0.05 | 0.00 ± 0.06 |
| ΔTN–I | +0.15 ± 0.02 | +0.65 ± 0.03 | +0.90 ± 0.05 |
| δTN–I | +0.55 ± 0.04 | +0.25 ± 0.05 | +0.15 ± 0.07 |
We noticed that all of the phase transition temperatures of the nanocolloids obtained from dielectric measurements (Table 3) were higher than those determined from the DSC measurements (Table 2). This is in agreement with the results previously published for 8CB/non-harvested Sn2P2S6 nanocolloids.13 Indeed, the measuring AC electric field amplified the polarization effect because the permanent dipoles of nanoparticles tend to align in the direction of the electric field, thus the polar order of the nanoparticles, SNP, improved the nematic liquid crystal order, SLC, in accordance with the following equation:7
 | (4) |
It is interesting to evaluate the difference between the nanoparticle effects with and without electric field. Table 3 shows the differences between the shifts obtained from the two experimental methods: δT = ΔTDielectric − ΔTDSC. From these values, we noticed that the nanocolloids with harvested nanoparticles (#3 and #4) presented lower values of δTN–I and δTSmA–N compared to those of nanocolloid #2; this means that the electric field effect was less pronounced with the harvested nanoparticles. Indeed, the order parameter of nanocolloid #2 was lower as discussed in the above section; it could be improved more easily by the electric field. This was confirmed by comparing nanocolloids #3 and #4. Moreover, for nanocolloid #4, we highlight the zero value of δTSmA–N, which means that the TSmA–N measured from DSC characterization corresponds to a saturated order parameter.
3.3 Dielectric permittivities and anisotropy
The measured permittivities of the four nanocolloids with the two orientations and the corresponding dielectric anisotropy are given in Table 4. Due to the very low nanoparticle concentrations, the contribution of the Sn2P2S6 permittivity to the dielectric response of the nanocolloids could be neglected.30 Thus, the measured dielectric permittivity resulted only from the dielectric response of the liquid crystal molecules, which were affected by the reorientational effect of the electric field on the permanent dipoles of ferroelectric nanoparticles.30| Nanocolloid | #1 | #2 | #3 | #4 |
|---|---|---|---|---|
| (a) | ||||
| ε′∥ at T − TN–I = −0.6 °C | 12.05 ± 0.05 | 12.45 ± 0.04 | 13.01 ± 0.03 | 13.32 ± 0.03 |
| ε′∥ at T − TSmA–N = 0.6 °C | 13.07 ± 0.04 | 13.34 ± 0.04 | 13.90 ± 0.03 | 14.25 ± 0.03 |
![[thin space (1/6-em)]](https://www.rsc.org/images/entities/char_2009.gif) |
||||
| (b) | ||||
| ε′⊥ at T − TN–I = −0.6 °C | 6.00 ± 0.04 | 6.09 ± 0.04 | 6.30 ± 0.03 | 6.46 ± 0.02 |
| ε′⊥ at T − TSmA–N = 0.6 °C | 5.08 ± 0.04 | 5.19 ± 0.04 | 5.64 ± 0.02 | 5.88 ± 0.03 |
![[thin space (1/6-em)]](https://www.rsc.org/images/entities/char_2009.gif) |
||||
| (c) | ||||
| ε′a at T − TN–I = −0.6 °C | 6.05 ± 0.04 | 6.36 ± 0.04 | 6.71 ± 0.03 | 6.86 ± 0.03 |
| ε′a at T − TSmA–N = 0.6 °C | 7.99 ± 0.04 | 8.15 ± 0.04 | 8.26 ± 0.03 | 8.37 ± 0.03 |
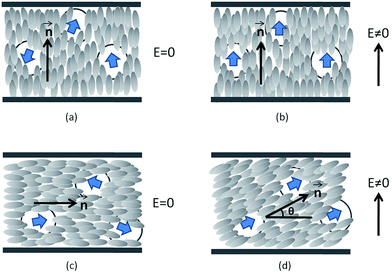
In the homeotropic orientation and before applying the electric field (Fig. 5(a)), the doped liquid crystal showed an order parameter S∥(E = 0), which could be higher (nanocolloids #3 and #4) or lower (nanocolloid #2 near the nematic–isotropic phase transition) than that of the non-doped liquid crystal S0LC due to the competition between the anchoring and the permanent polarization effect as discussed in the Section 3.1. During the dielectric measurements, the order parameter of the nanocolloids increased due to the coupling between the permanent polarization of the nanoparticles and the AC electric field: the nanoparticles’ dipoles aligned in the direction of the electric field and, due to the polarization effect, the liquid crystal molecules aligned with the nanoparticles. This effect improved the liquid crystal order parameter (Fig. 5(b)) and explained the increase in the measured permittivities in the homeotropic orientation (Table 4(a)). To compare the influence of harvested and non-harvested nanoparticles on the dielectric permittivity ε′∥, we present in Fig. 6(a) the increase in ε′∥ with respect to that of the non-doped liquid crystal. We observed that the nanocolloids with harvested nanoparticles (#3 and #4) presented a higher increase in ε′∥, which indicated a stronger coupling between the permanent polarization of the nanoparticles and the electric field. The liquid crystal ordering was then improved and the measured permittivity ε′∥ was increased. We also highlight that all of the shifts Δε′∥ near the nematic–isotropic phase transition were slightly higher than those measured near the smectic-A–nematic phase transition. This is probably related to the lower viscosity of the liquid crystal near the nematic–isotropic phase transition, which is more favorable for the nanoparticles to reorientate under the AC electric field.13,31
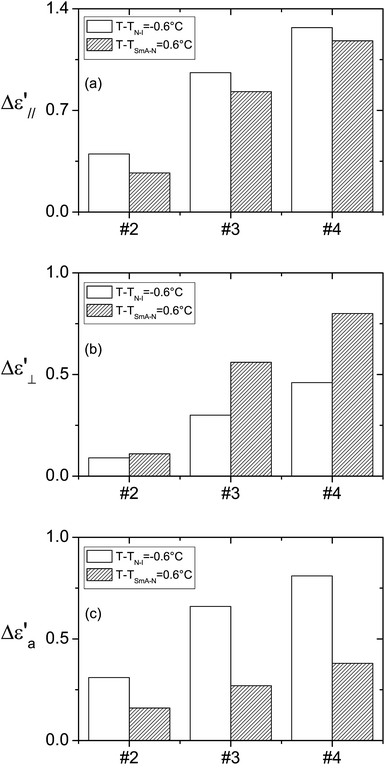 | ||
| Fig. 6 Histograms of the shifts between the dielectric characteristics of the nanocolloids and those of the non-doped liquid crystal: the permittivities (a) ε′∥ and (b) ε′⊥, and anisotropy (c) ε′a. | ||
As in the homeotropic orientation, the electric field in the planar orientation also induced the improvement of the liquid crystal order as shown by the increase in ΔTN–I (Table 3). However, during dielectric measurements, the permanent dipole moments of nanoparticles tend to reorientate parallel to the direction of the measuring electric field, thus the initial planar orientation of the nanocolloid was disturbed (Fig. 5(c) and (d)). The real orientation presents a reorientation angle θ from the initial orientation, which affects the measured values of the permittivities. By increasing the nanoparticles’ polarization, the angle θ, and consequently the measured permittivity, increased. Due to the higher average polarization of the harvested nanoparticles and despite the lower nanoparticle concentrations of nanocolloids #3 and #4, the measured permittivities ε′⊥ were higher than that of nanocolloid #2 as shown in Table 4(b). In Fig. 6(b) we present the variation of the measured permittivity Δε′⊥ of the nanocolloids with respect to that of the non-doped liquid crystal. Contrary to the homeotropic orientation, for each nanocolloid, the shift Δε′⊥ near the smectic-A–nematic phase transition was higher than that near the nematic–isotropic phase transition. Indeed, the viscosity influence was favorable to a higher value of the angle θ near the nematic–isotropic phase transition, but the measured permittivity was more sensitive to θ variations near the smectic-A–nematic phase transition where the dielectric anisotropy was much higher than near the nematic–isotropic phase transition.
The static dielectric anisotropy ε′a = ε′∥ − ε′⊥ was estimated from the measured dielectric permittivity in the planar and homeotropic orientations (Table 4(c)). The nanocolloids presented a dielectric anisotropy higher than that of the non-doped liquid crystal, which means that the favorable effect of the nanoparticles in the homeotropic orientation was predominant compared to that in the planar orientation. Table 4(c) shows a clear increase in the dielectric anisotropy for the harvested nanoparticles. These results are in agreement with the increase in the order parameter evidenced from the phase transition temperatures obtained by the dielectric measurements as discussed above (Table 3). Near the nematic–isotropic phase transition, the improvement of the anisotropy Δε′a of nanocolloids #3 and #4 was about 110% and 160%, respectively, compared with that of nanocolloid #2 (Fig. 6(c)). This improvement was less important near the smectic-A–nematic phase transition (about 70% and 140% for nanocolloids #3 and #4).
4 Conclusion
In this work, we presented a comparative study on the phase transition temperatures and dielectric properties of the 8CB liquid crystal doped with harvested and non-harvested Sn2P2S6 ferroelectric nanoparticles. The experimental data obtained from DSC characterizations showed that an increase in the average polarization of the harvested nanoparticles leads to a more significant increase in the phase transition temperatures compared to that with non-harvested nanoparticles. During the dielectric measurements, the applied AC electric field amplified the nanoparticles’ polarization effect on the liquid crystal order parameter. This electric field influence was more important on the non-harvested nanoparticles.Without an electric field, the harvested nanoparticles strongly improved the order parameter; due to the saturation of the liquid crystal ordering, the electric field could not significantly amplify the coupling between the polarization and the order parameter. The coupling between the nanoparticle polarization and the electric field led to different values of permittivity of the studied nanocolloids. In the homeotropic orientation, the highest values were obtained with the harvested nanoparticles in agreement with the increase in the order parameter observed from the DSC characterizations. In the planar orientation, the AC electric field induced a new orientation, slightly shifted from the initial configuration. This shift and the corresponding measured permittivity increased with the polarization. For this reason, the highest values of the measured permittivities were obtained from the nanocolloids with the harvested nanoparticles; these nanocolloids also showed the highest dielectric anisotropy in agreement with the highest order parameter.
References
- G. Cook, A. V. Glushchenko, V. Reshetnyak, A. T. Griffith, M. A. Saleh and D. R. Evans, Opt. Express, 2008, 16, 4015–4022 CrossRef CAS PubMed.
- O. Buchnev, A. Dyadyusha, M. Kaczmarek, V. Reshetnyak and Y. Reznikov, J. Opt. Soc. Am. B, 2007, 24, 1512–1516 CrossRef CAS.
- A. Lorenz, N. Zimmermann, S. Kumar, D. R. Evans, G. Cook and H.-S. Kitzerow, Phys. Rev. E: Stat., Nonlinear, Soft Matter Phys., 2012, 86, 051704 CrossRef PubMed.
- Y. Reznikov, O. Buchnev, O. Tereshchenko, V. Reshetnyak, A. Glushchenko and J. West, Appl. Phys. Lett., 2003, 82, 1917–1919 CrossRef CAS.
- F. Li, J. West, A. Glushchenko, C. I. Cheon and Y. Reznikov, J. Soc. Inf. Disp., 2006, 14, 523–527 CrossRef CAS.
- M. Kaczmarek, O. Buchnev and I. Nandhakumar, Appl. Phys. Lett., 2008, 92, 103307 CrossRef.
- L. M. Lopatina and J. V. Selinger, Phys. Rev. E: Stat., Nonlinear, Soft Matter Phys., 2011, 84, 041703 CrossRef PubMed.
- Y. Lin, R. Douali, F. Dubois, A. Segovia-Mera and A. Daoudi, Eur. Phys. J. E, 2015, 38, 103 CrossRef CAS PubMed.
- Y. Shiraishi, N. Toshima, K. Maeda, H. Yoshikawa, J. Xu and S. Kobayashi, Appl. Phys. Lett., 2002, 81, 2845–2847 CrossRef CAS.
- I. Musevic, M. Skarabot, D. Babic, N. Osterman, I. Poberaj, V. Nazarenko and A. Nych, Phys. Rev. Lett., 2004, 93, 187801 CrossRef CAS PubMed.
- K. Takizawa, K. Kodama and K. Kishi, Appl. Opt., 1998, 37, 3181–3189 CrossRef CAS PubMed.
- L. M. Lopatina and J. V. Selinger, Phys. Rev. Lett., 2009, 102, 197802 CrossRef PubMed.
- Y. Lin, A. Daoudi, A. Segovia-Mera, F. Dubois, C. Legrand and R. Douali, Phys. Rev. E, 2016, 93, 062702 CrossRef CAS PubMed.
- H. Atkuri, G. Cook, D. R. Evans, C.-I. Cheon, A. Glushchenko, V. Reshetnyak, Y. Reznikov, J. West and K. Zhang, J. Opt. A: Pure Appl. Opt., 2009, 11, 024006 CrossRef.
- O. Kurochkin, H. Atkuri, O. Buchnev, A. Glushchenko, O. Grabar, R. Karapinar, V. Reshetnyak, J. West and Y. Reznikov, Condens. Matter Phys., 2010, 13, 33701 CrossRef.
- G. Cook, J. L. Barnes, S. A. Basun, D. R. Evans, R. F. Ziolo, A. Ponce, V. Reshetnyak, A. Glushchenko and P. P. Banerjee, J. Appl. Phys., 2010, 108, 064309 CrossRef.
- G. Cook, V. Y. Reshetnyak, R. F. Ziolo, S. A. Basun, P. P. Banerjee and D. R. Evans, Opt. Express, 2010, 18, 17339–17345 CrossRef CAS PubMed.
- S. A. Basun, G. Cook, V. Y. Reshetnyak, A. V. Glushchenko and D. R. Evans, Phys. Rev. B: Condens. Matter Mater. Phys., 2011, 84, 024105 CrossRef.
- D. R. Evans, S. A. Basun, G. Cook, I. P. Pinkevych and V. Y. Reshetnyak, Phys. Rev. B: Condens. Matter Mater. Phys., 2011, 84, 174111 CrossRef.
- A. Lorenz, N. Zimmermann, S. Kumar, D. R. Evans, G. Cook, M. F. Martinez and H.-S. Kitzerow, J. Phys. Chem. B, 2013, 117, 937–941 CrossRef CAS PubMed.
- A. Rudzki, D. R. Evans, G. Cook and W. Haase, Appl. Opt., 2013, 52, E6–E14 CrossRef CAS PubMed.
- R. K. Shukla, C. M. Liebig, D. R. Evans and W. Haase, RSC Adv., 2014, 4, 18529 RSC.
- R. Kumar and K. K. Raina, Liq. Cryst., 2015, 42, 119–126 CrossRef CAS.
- D. Jayoti, Khushboo, P. Malik and A. Singh, Liq. Cryst., 2016, 43, 623–631 CrossRef CAS.
- O. Kurochkin, E. Mavrona, V. Apostolopoulos, J.-F. Blach, J.-F. Henninot, M. Kaczmarek, S. Saitzek, M. Sokolova and Y. Reznikov, Appl. Phys. Lett., 2015, 106, 043111 CrossRef.
- G. Cordoyiannis, L. K. Kurihara, L. J. Martinez-Miranda, C. Glorieux and J. Thoen, Phys. Rev. E: Stat., Nonlinear, Soft Matter Phys., 2009, 79, 011702 CrossRef PubMed.
- K. Denolf, G. Cordoyiannis, C. Glorieux and J. Thoen, Phys. Rev. E: Stat., Nonlinear, Soft Matter Phys., 2007, 76, 051702 CrossRef PubMed.
- A. Matsuyama and R. Hirashima, J. Chem. Phys., 2008, 128, 044907 CrossRef PubMed.
- A. Mertelj, L. Cmok, M. Copic, G. Cook and D. R. Evans, Phys. Rev. E: Stat., Nonlinear, Soft Matter Phys., 2012, 85, 021705 CrossRef PubMed.
- Y. Lin, A. Daoudi, F. Dubois, A. Segovia-Mera, C. Legrand and R. Douali, J. Mol. Liq., 2017, 232, 123–129 CrossRef CAS.
- S. DasGupta, P. Chattopadhyay and S. K. Roy, Phys. Rev. E: Stat., Nonlinear, Soft Matter Phys., 2001, 63, 041703 CrossRef CAS PubMed.
| This journal is © The Royal Society of Chemistry 2017 |

