DOI:
10.1039/C7RA04074A
(Paper)
RSC Adv., 2017,
7, 30784-30791
Detection of vasodilator drugs through microwave spectroscopy of Au NP colorimetric probes using a microwave metallic photonic crystal-inspired resonant probe†
Received
10th April 2017
, Accepted 8th June 2017
First published on 15th June 2017
Abstract
Here, we report a low-cost, time-effective, easy-to-use, and novel analytical technique incorporating microwave spectroscopy of unmodified gold nanoparticles for the successful detection of two vasodilator drugs – amlodipine besylate and minoxidil. The sensor probe consists of a microwave metallic photonic crystal, which is loaded into the ground plane of a ∼λ/4 cylindrical line source. The sensing scheme is based on inducing aggregation in the gold nanoparticles upon addition of the analyte drug, and then performing microwave spectroscopy for different concentrations of the two drugs. The proposed method was validated in the concentration ranges of 100–0.05 μM and 20–0.625 mM for amlodipine besylate and minoxidil drugs, respectively, and a good linearity was obtained for the calibrated data. The scope of the reported user-friendly technique can be further enhanced by improvement of the limit of detection of specific drugs by favourable functionalization and/or surface modification of suitable nanoparticle probes.
1. Introduction
Vasodilator drugs are effective in preventing numerous health disorders like high blood pressure, heart failure, and angina.1 Most of the vasodilator drugs are balanced with arterial dilators and venous dilators. They are used to dilate arteries and veins simultaneously. Therefore, they prove to be beneficial as an enhanced therapeutic treatment.2 However, consumption of the vasodilator may interfere with other dietary elements and may cause nausea, headaches, heart palpitations, etc. amlodipine besylate is an L-type calcium channel blocker which is used for the treatment of angina and hypertension. It also has antihypertensive and antianginal effects.3 Minoxidil is used to control blood pressure by relaxing and dilating the blood vessels, and it is always used in combination with beta-blockers and diuretics in order to prevent its side effects.4 Several analytical techniques such as High Pressure Liquid Chromatography (HPLC),5,6 Liquid Chromatography-Mass Spectrometry (LC-MS),7,8 fluorescence,9,10 electrochemical,11,12 and UV-visible spectroscopy13,14 are reported for the analysis of two vasodilator drugs (amlodipine besylate and minoxidil) in pure pharmaceutical formulations and tablets. Unfortunately, these methods require more time for analysis, expensive instrumentation, and moreover, their applicability is limited only to the laboratory. Therefore, a simple analytical technique is essential for the detection and quantification of analyte drugs in different matrices.
The gold nanoparticles (Au NPs) as colorimetric probes are actively involved in research for the development of effective detection and screening approach of biomolecules, inorganic elements and drugs.15 The particle distance-dependent optical property of the Au NPs undergoes red-shift in the wavelength of surface plasmon resonance (SPR) after the induced aggregation and exhibits a very high extinction coefficient.16 This unique tunable optical property sensitively allows Au NPs for visual sensing of the analyte through color change with great sensitivity. It is found that small sized (∼5–13 nm) water dispersible Au NPs play an important role in the colorimetric assay. In this connection, unmodified Au NPs and functionalized Au NPs have been utilized as probes for the colorimetric detection of target drug molecules by creating affinity and inducing aggregation. Rawat et al. showed simultaneous detection of four different drug formulations (venlafaxine, imipramine, amlodipine, and alfuzosin) by using bare gold nanoparticles. It is achieved through strong interaction between Au NPs surface and four drugs at pH 4 ammonium acetate buffer media.17 Teepoo et al. applied colorimetric assay using unmodified Au NPs for the determination of drug ramoplanin in biofluid up to 0.01 ppm.18 Yarbakht and co-worker reported the visual detection of methamphetamine using aptamer coated gold nanoparticles.19 Xie et al. developed DNA interstrand cross-linked Au NPs for colorimetric detection of the anticancer drug.20 Selvaraj et al. showed biological assay of antileukemic drug (6-mercaptopurine) using gold nanoparticles.21 These approaches allow simple analysis for detecting the presence of analyte drug; however, as the analyte concentration approaches the limit of detection (LOD), the UV-visible spectrometry fail to deliver highly distinct absorbance spectra. Thus, calibration is one of the issues which restrict the development of a portable colorimetric-based spectrometer as a prototype sensor device. This encouraged us to introduce an ingenious sensor and spectroscopic study which possesses a potential scope in the development of the novel portable device to facilitate effective detection of the concerned species.
Devices based on microwave theory and techniques have also gained significant attention for bio-sensing. In the recent years, resonator-based radiofrequency (RF) biosensing platforms have been developed for sensing over a broad range of microwave spectrum. Grenier et al. presented a broadband microwave sensor integrated with microfluidic technology dedicated for the purpose of bioengineering the human cells.22 Compact coplanar waveguide transmission line based label-free RF biosensors are reported for the characterization of cancer cell,23 glucose,24 and many other analytes. More interestingly, artificial materials such as metamaterials have emerged with excellent sensing properties at nanostructured scale.25 Cao et al. developed ∼45 μm width U-shaped periodic structure of Split Ring Resonators (SRRs) with the thiolated surface to detect the presence of RGG9 biomarker.26 Park et al. reported electric LC-type terahertz metamaterials for the characterization of fungi bacteria.27 In particular, metamaterials operating at terahertz frequencies and the optical regime have a relatively higher sensitivity. However, expensive fabrication, complex measurement setup, and sample preparation with remarkably sophisticated functionalization is required. Whereas, X-band (8–12 GHz) metamaterial sensor demonstrated by Lee and co-authors for specific binding between prostate-specific antigen (PSA) and antibody showed LOD up to 1 ng mL−1.28 Since the majority of the investigated microwave sensor devices are planar, in situ analysis cannot be performed into various biological and chemical assays. Microwave reflection probes are one of the suitable candidates for the in situ microwave spectroscopy. But, so far, only the non-resonant open-ended coaxial probes have been studied for the broadband microwave dielectric spectroscopy of liquids,29 biological tissues,30 and RF laminates.31 Large sample volume is required in some of the exceptionally designed yet bulky resonant probes.32,33
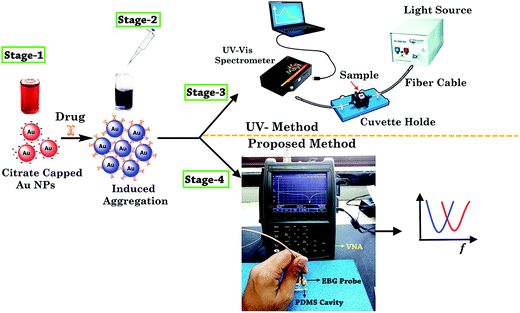
In this work, a low-profile coaxial probe is presented which acquires resonance from the microwave metallic photonic crystal loaded in the probe ground plane. The sensing mechanism is based on microwave spectroscopy of the gold nanoparticles colorimetric assay, wherein, the probe tip is inserted into the prepared sample and shift is calibrated in the resonant frequency. The aggregation in Au NPs by the two drugs (amlodipine besylate, and minoxidil) which led to the red-shift in the wavelength of SPR was confirmed using a UV-visible spectrophotometer, Dynamic Light Scattering (DLS), and FT-IR measurements. The proposed technique possesses the advantage of simple measurement setup, significantly identifiable resonance peaks, minimal requirement of sample volume, and easy calibration.
2. Sensor development
2.1 Design
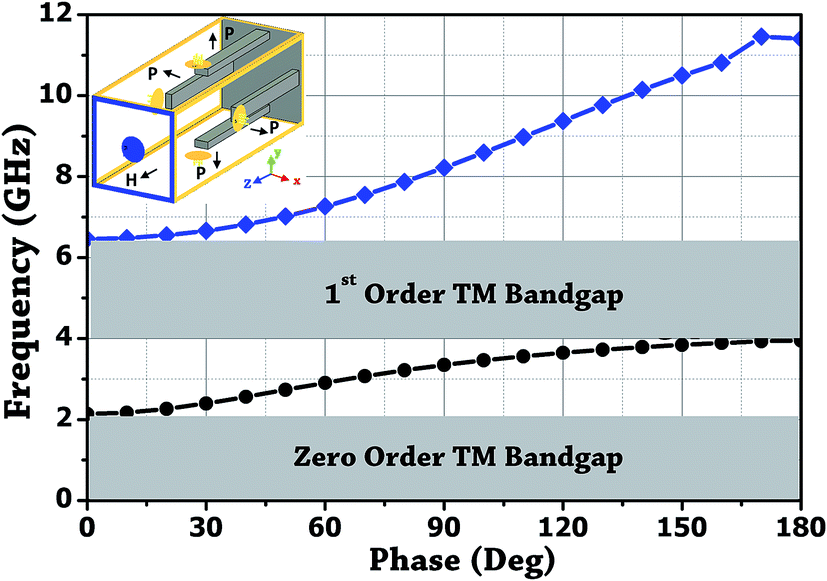
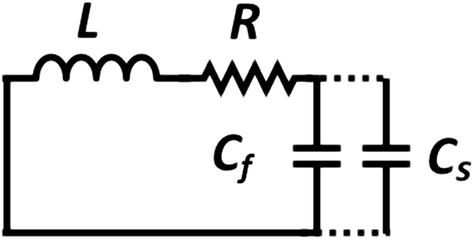
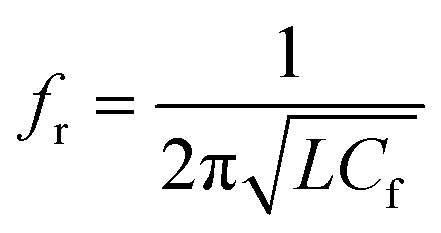
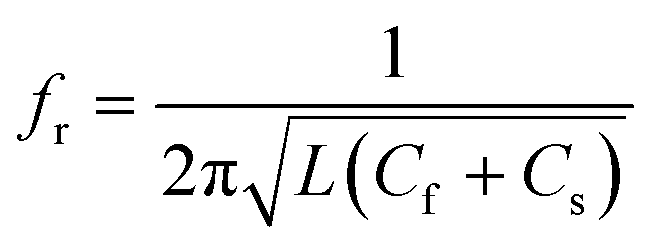
The design of metallic photonic crystal (MPC) loaded microwave probe consists of a four surrounded rectangular metal rods, each with the width of w1 = 2 mm, height L1 = 7.5 mm, and vertically suspended on the ground plane of a panel type SMA female connector of ground plane length L = 12.5 mm. The cylindrical pin of diameter d = 1.3 mm and height l1 = 16.3 mm act as a ∼λ/4 line source carrying current, where, λ is the operating wavelength. Fig. 1a shows the schematic of the proposed sensor probe, whose transverse magnetic (TM) bandgap regions were numerically calculated using Eigenmode solver of the Computer Simulation Tool, Microwave Studio (CST-MWS) v.2016. The finite line source having a current density (J) traps the evanescent waves within the MPC, and energy is allowed to propagate only above the MPC structure. Thus, the entire field components no longer remain invariable in the z-direction for TM boundary and it leads to the existence of bandgap. It is well-known that supper-cell structure is commonly applied by defining the periodic boundary to the unit-cell structure for the computation of microwave photonic crystal.34 However, in the proposed geometry, the lattice points are in the middle of the square lattice plane, and therefore, computation burden can be minimized by calculating phase variation in x or y-direction only, and the irreducible Brillouin zone boundary need not be evaluated completely.35 Fig. 2 shows the simulated bandgaps for TM mode, where, zero order global TM bandgap is up to 2 GHz, and 1st order TM bandgap exists between 4 GHz to 6.2 GHz. Based on these results, the probe resonance is likely to exist in the 1st order TM bandgap region. As shown in Fig. 3, the sensing operation can be understood from the equivalent probe circuit. The lumped model of the excited coaxial line has a finite inductance (L) and resistance (R), whereas, the Cf is the fringing field capacitance between the probe and MPC rods.
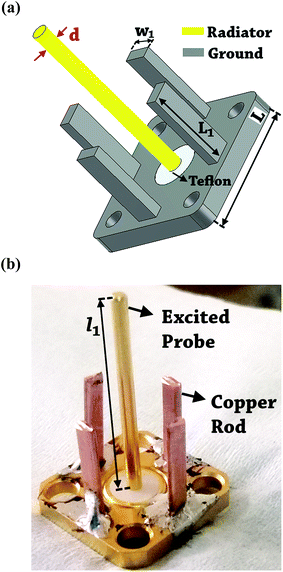 |
| | Fig. 1 (a) Schematic of the proposed resonant probe. (b) Fabricated structure. | |
 |
| | Fig. 2 Dispersion diagram of microwave metallic photonic crystal in square lattice. | |
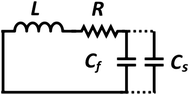 |
| | Fig. 3 Equivalent lumped circuit model. | |
In this case, the resonant frequency can be obtained using eqn (1). When the probe tip interacts with the liquid sample, the value of Cf is influenced and acts as an additional capacitance Cs in parallel with the sample as shown in eqn (2). This parallel capacitance, therefore, shifts down the resonant frequency (fr).
| |
 | (1) |
| |
 | (2) |
2.2 Device fabrication and testing
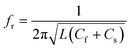
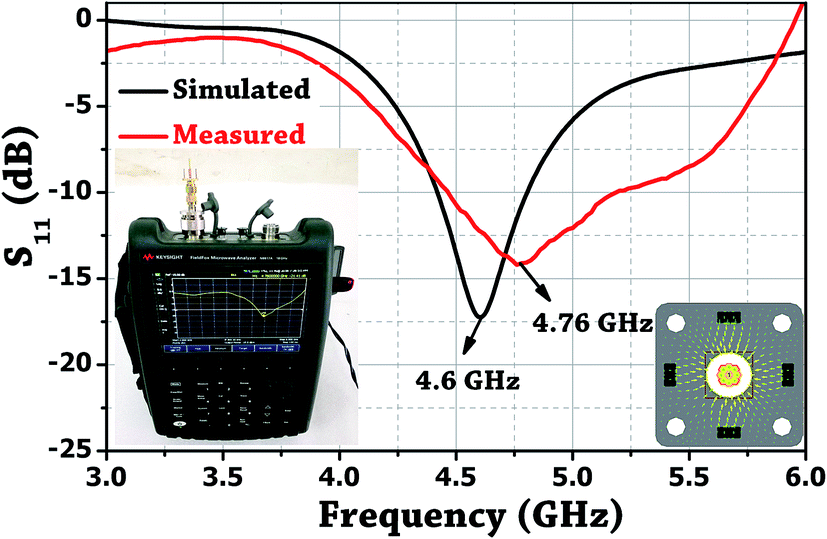
The probe was realized by utilizing a female sub-miniature version-A (SMA) panel type connector with elongated feed pin and soldering four rectangular copper rods over the ground body of the connected which surrounds the feed pin. Fig. 1b shows the photo of the fabricated probe. A microwave signal excitation was given to the probe, and its reflection scattering spectra (S11) was simulated and later measured using Vector Network Analyzer (VNA) to validate the proof of concept. It is evident from Fig. 4 that the simulated fundamental resonance of the probe at 4.6 GHz is found to be in the 1st TM bandgap and possess TM110 mode. The measured frequency response at 4.76 GHz is in close agreement with the simulation result and confirms its proper functioning.
 |
| | Fig. 4 Plot of the reflection coefficient for the MPC-inspired resonant probe. | |
3. Experiment
3.1 Chemicals and materials
Gold chloride (HAuCl4·xH2O) and sodium citrate tribasic dihydrate (C6H5Na3O7·2H2O) were purchased from SRL Pvt. Ltd, India. TRIS (hydroxymethyl) aminomethane, phosphate buffer saline (PBS) and ammonium acetate were purchased from Sigma-Aldrich, USA. Amlodipine besylate and minoxidil were obtained from TCI Chemicals, Japan. The milli-Q-pure water of 18.2 MΩ was used in the experimentation. All the reagents were of analytical grade and used without further purification.
3.2 Instrumentation
The probe resonant frequency was measured using Agilent vector network analyzer (N9917A, 18 GHz). The UV-visible absorbance spectrum was measured with Ocean Optics, Maya Pro 2000 spectrophotometer. DLS analysis was performed using Zetasizer Nano ZS90, Malvern Instruments, and FTIR spectroscopy was recorded with the help of ATR-8000A, Shimadzu.
3.3 Synthesis and characterization of gold nanoparticles
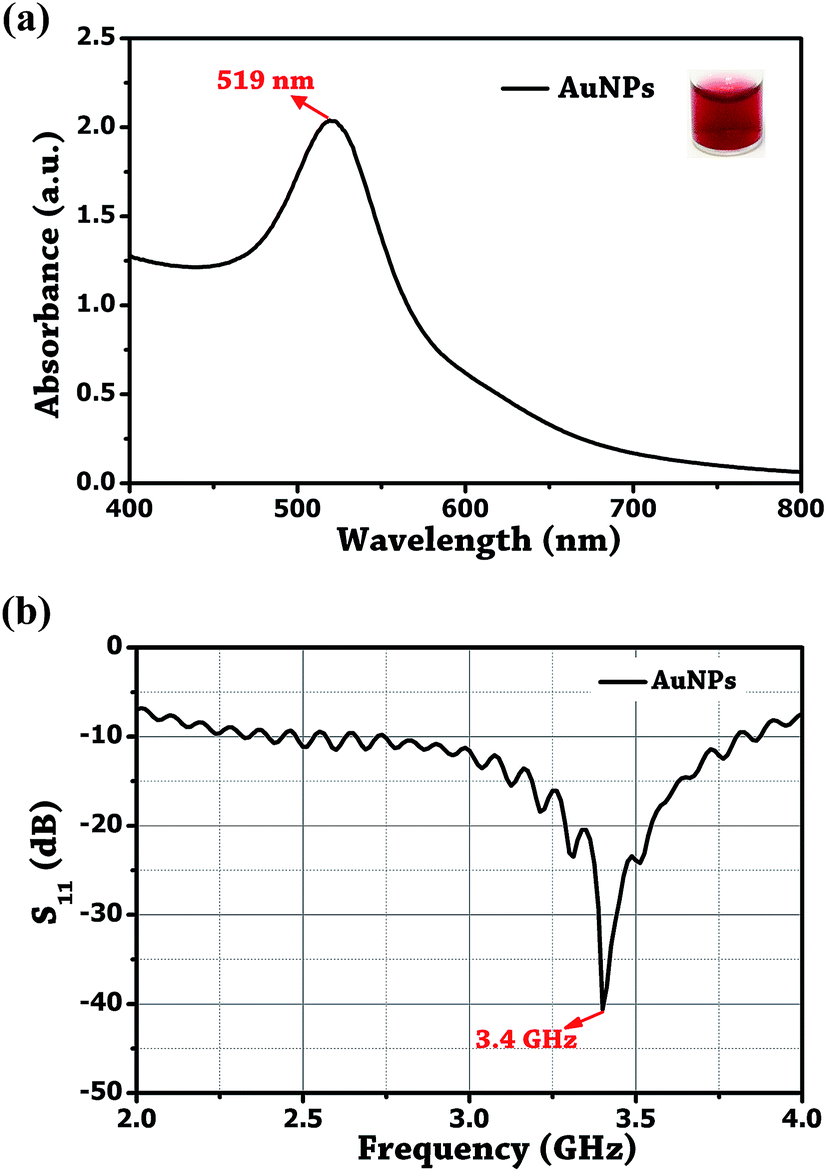
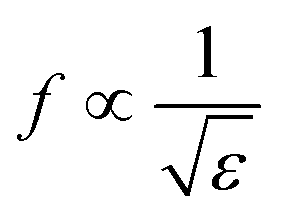
The Au NPs were prepared by the reduction of Au3+ using Turkevich method.36 In brief, 20 mL of 1 mM HAuCl4 was refluxed in a 50 mL conical flask for 15 min under constant stirring. To this, 38.8 mM of citrate was rapidly injected, and the mixture was further stirred for 40 min at 510 rpm. Maintaining the reaction temperature at ±85 °C yielded change in the colour of the solution from pale yellow to cherry red and confirms the formation of Au NPs. The peak absorbance of the synthesized Au NPs was measured at 519 nm, and a resonance at 3.4 GHz was obtained by dipping the probe tip in the colloidal solution of gold as shown in Fig. 5. It is important to understand that it is the solution permittivity which causes the resonant frequency to shift towards the lower side in the spectrum as,  , where f is the frequency and ε is the solution permittivity.
 |
| | Fig. 5 (a) UV-visible absorbance plot. (b) Probe reflection coefficient (S11) of the unmodified Au NPs. | |
3.4 Detection of drugs
Initially, colorimetric detection of two vasodilator drugs (amlodipine besylate and minoxidil) was independently carried out using unmodified Au NPs as sensing probe. The details of the drugs are illustrated in ESI Table 1.† Briefly, 100 μL of different concentrations of amlodipine and minoxidil was prepared in deionized water and separately added into 500 μL of unmodified Au NPs. The resulting color change in the solution after 5 min of incubation at room temperature was analyzed with UV-visible spectroscopy, DLS, and FTIR measurement to study the aggregation mechanism of Au NPs with the drugs. Immediately, after the induced aggregation, the microwave sensor probe tip was dipped into the solution, and a corresponding shift in the resonant frequency was recorded. Thus, the detection of two vasodilator drugs is based microwave spectroscopy of the aggregated Au NPs, where, the aggregation phenomenon of Au NPs amplifies the signal response of the probe unlike performing microwave spectroscopy of samples in purified water. This technique is useful when the color change in the solution cannot be distinguished with naked eyes and the UV-visible spectroscopic results show ambiguity in the region of peak absorption (ESI Fig. 2†). Next, the frequency responses were calibrated to find the LOD.
4. Results and discussion
4.1 Sensing mechanism and measurement technique
The solution pH is one the key parameter which enables selective probing of the gold nanoparticles with the functional groups of target drug molecules. Since the dissociation constant (pKa) value of amlodipine besylate is 8.6,37 and that of minoxidil is 4.61,38 pH 4 buffer media was selected to facilitate a positive charge on the drug molecules. At this pH, the surface of the citrate-stabilized Au NPs acquires negative change, because of first pKa value of citrate being <4, and electrostatically interacts with the molecules of the positively charged drug. Furthermore, the active functional group (–NH2), electron rich N-atoms, and the aromatic ring of the target drug molecules yield hydrogen bonding, coordination interaction, and π–π interaction with the unmodified Au NPs which mediates the aggregation. These conditions display higher sensitivity and selectivity for the detection of two vasodilator drugs. The effect of different buffer media on unmodified Au NPs was investigated to ensure that SPR phenomenon can take place solely due to the nanoparticles size, interparticle distance, the complex permittivity of the suitable buffer media, and the functional groups of the analyte drug. ESI Fig. 1† shows the absorption (ASPR/A519) of Au NPs in the presence of TRIS, ammonium acetate, and PBS buffer. It was found that PBS buffer changes the solution color to purple and peak absorption was measured at a longer wavelength (λ825). On the other hand, TRIS and ammonium acetate showed wavelength at λ522 with an absorbance of 1.673 and 1.628. This shows that TRIS buffer maintains close similarity with the color and SPR band of the bare Au NPs and it can be used for the purpose of sensing.
UV-visible spectroscopy has been widely reported for the characterization of SPR phenomenon. It takes place in the nanoparticles due to the morphological changes. First of all, citrate as a reducing and stabilizing agent was used in the preparation of Au NPs with the sole objective of developing an alternate method for simple and sensitive detection of the analyte drugs. Further, drug solution was prepared with the help of aforesaid method, and the determined volume was injected into the Au NPs colloidal solution to observe the color change. The sample was characterized with a UV-visible method to confirm the complexing of Au NPs induced by the drug. After that, microwave spectroscopy was performed by transferring 200 μL of the sample into a multi-compartment cavity made from polydimethylsiloxane (PDMS) and measuring the frequency of resonance on VNA by dipping the bandgap-inspired probe into the sample. Fig. 6 shows the complete stages of the proposed method of analysis.
 |
| | Fig. 6 Schematic of the sensing and measurement technique for the spectroscopy of two vasodilator drugs. | |
4.2 Characterization
Au NPs of 7–13 nm facilitate better binding ability of unmodified nanoparticles with the drug molecule.18 As shown in Fig. 7a, the average hydrodynamic diameter of the synthesized gold nanoparticles measured using DLS was found to be ∼11.5 nm. A considerable increase in the average hydrodynamic diameter of the unmodified Au NPs was observed after modification with amlodipine and minoxidil. Fig. 7b and c shows the increase in average diameter to ∼342 and ∼105 for amlodipine and minoxidil respectively. It indicates a decrease in the interparticle distance of Au NPs upon the addition of two drugs. This also indicates the presence of more binding site in the amlodipine drug compared to the minoxidil drug. The FT-IR spectroscopy was also studied to validate the organic framework on the surface of Au NPs and sensing mechanism.
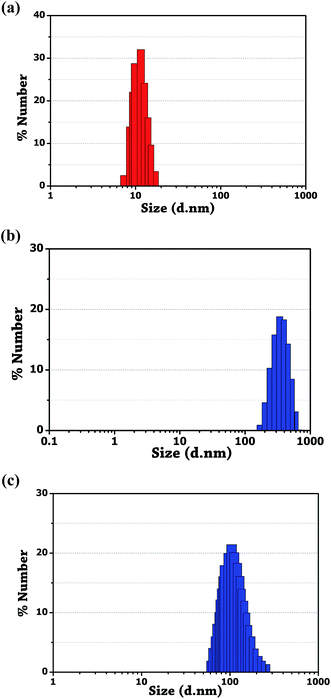 |
| | Fig. 7 DLS measurement. (a) Bare Au NPs. (b) Aggregation of unmodified Au NPs induced by amlodipine besylate. (c) Minoxidil. | |
ESI Fig. 2† shows the FT-IR spectrum of pure amlodipine, pure minoxidil, and their complexing with unmodified Au NPs at pH = 4 buffer media. The FT-IR spectra of amlodipine besylate and minoxidil were recorded in the solid-state form, whereas, the Au NPs sample was first mixed with potassium bromide, and then dried in the oven for 1 h for recording the spectra in a solid-state form. It is revealed from ESI Fig. 2a,† that the peak at 3155 cm−1 corresponds to the N–H stretching of a primary amine group, and the peaks at 2948 cm−1 and 1614 cm−1 resembles the aromatic C–H and –C![[double bond, length as m-dash]](https://www.rsc.org/images/entities/char_e001.gif) C– stretching vibrations for the pure amlodipine besylate pharmaceutical drug formulation. Similarly, the peaks at 3423.72 cm−1 and 1643.98 cm−1 represents the N–H stretching and bending of primary amines respectively in the pure minoxidil drug. More importantly, a drastic decrease in the intensity of theses peaks was observed in the spectra of Au NPs complex with amlodipine and minoxidil as shown in ESI Fig. 2b and d.†
C– stretching vibrations for the pure amlodipine besylate pharmaceutical drug formulation. Similarly, the peaks at 3423.72 cm−1 and 1643.98 cm−1 represents the N–H stretching and bending of primary amines respectively in the pure minoxidil drug. More importantly, a drastic decrease in the intensity of theses peaks was observed in the spectra of Au NPs complex with amlodipine and minoxidil as shown in ESI Fig. 2b and d.†
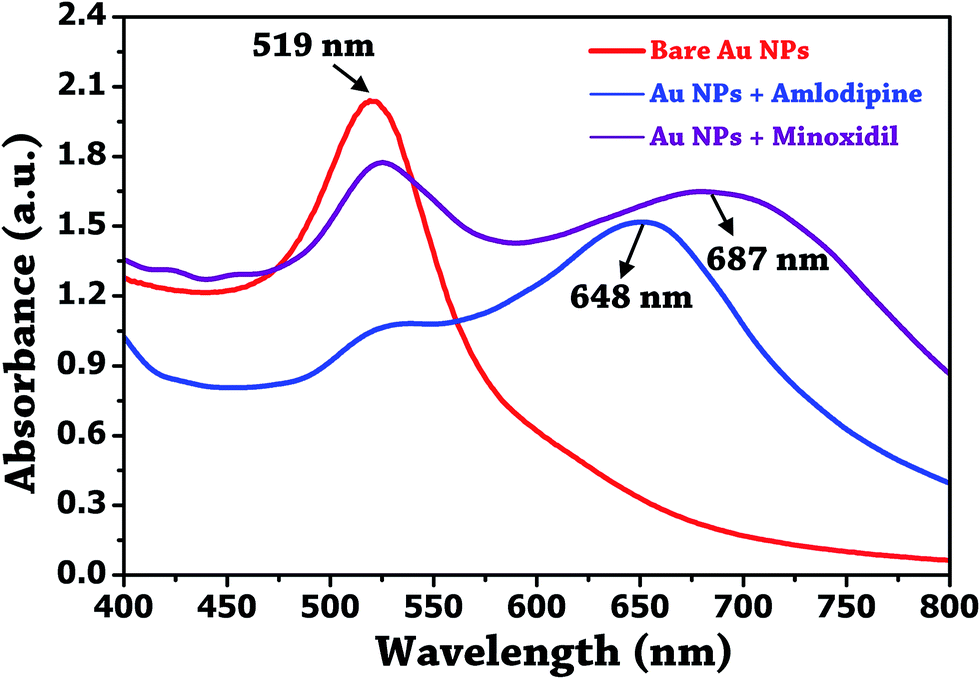
The above results confirm the involvement of active function group –NH2, and benzene ring of the amlodipine in the induced aggregation and shift in the SPR band. The UV-visible spectrum was also recorded to ascertain the aggregation mechanism as shown in Fig. 8. The shape of the absorption profile of Au NPs was complete lost upon the addition of 100 μM amlodipine besylate and 10 mM minoxidil.
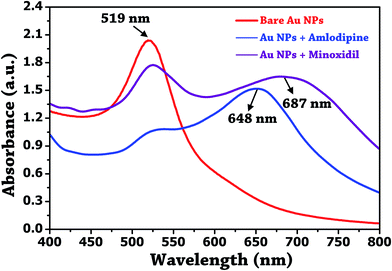 |
| | Fig. 8 UV-visible absorption plot of unmodified Au NPs, and their conjugation with amlodipine besylate (100 μM) and minoxidil (10 mM). | |
4.3 Analysis and detection of vasodilator drug formulations: microwave spectroscopy of Au NPs colorimetric probe using resonant probe
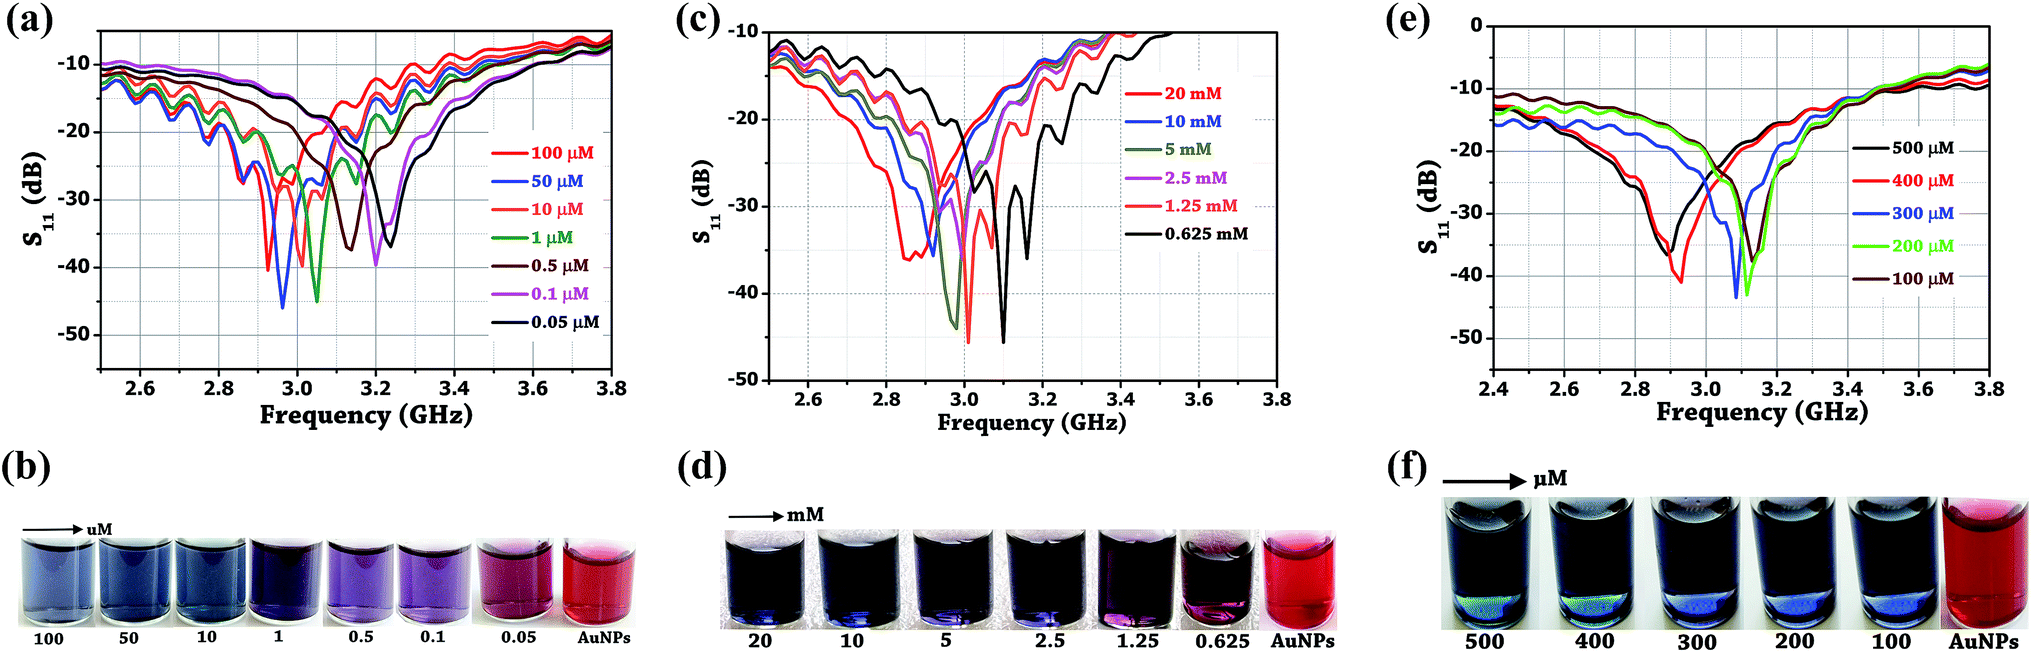
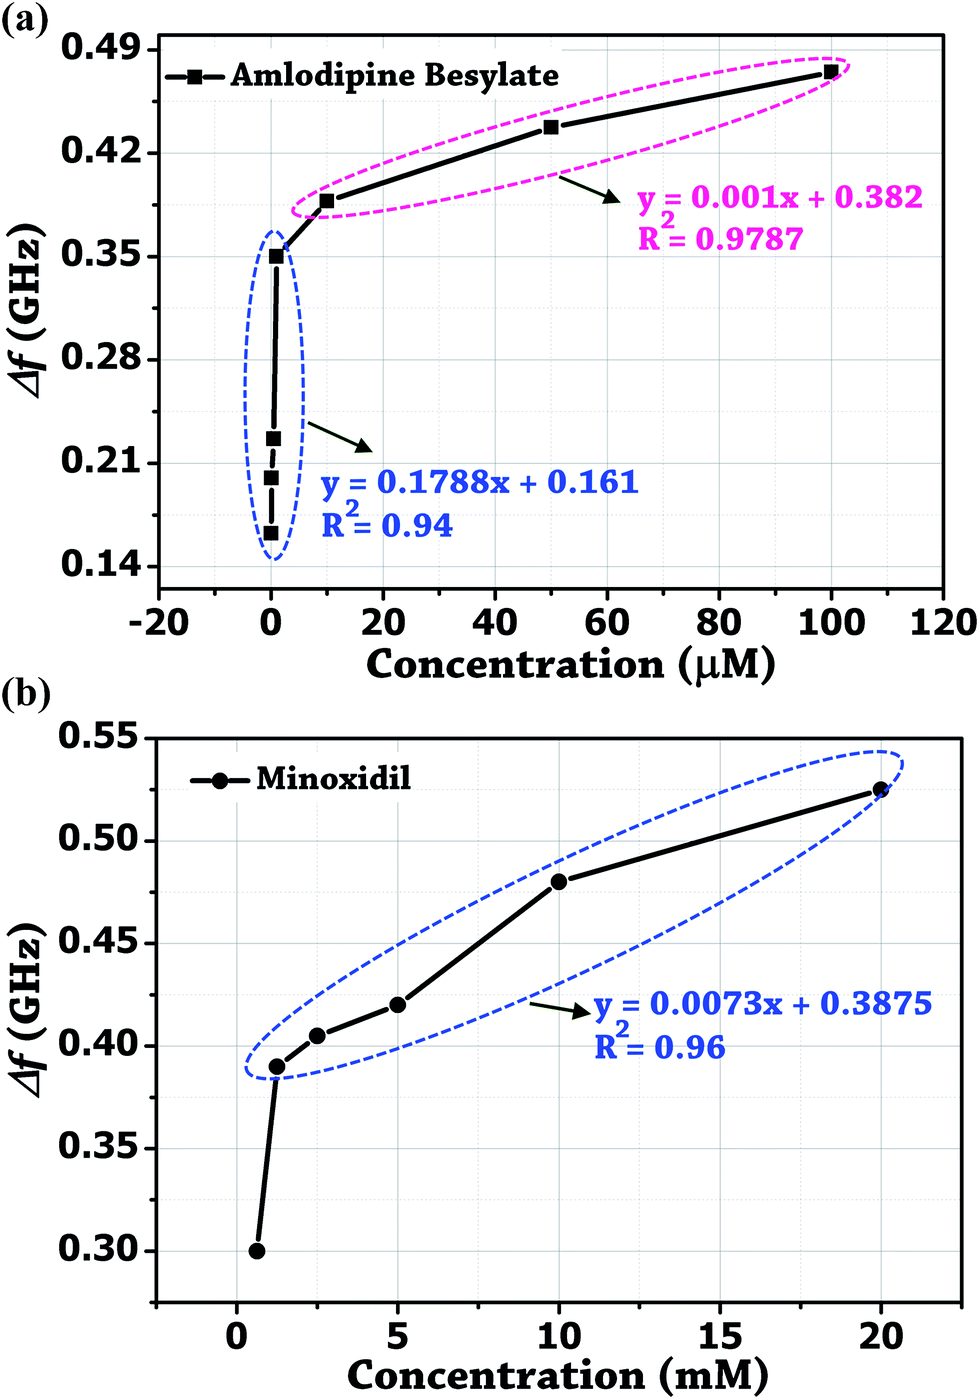
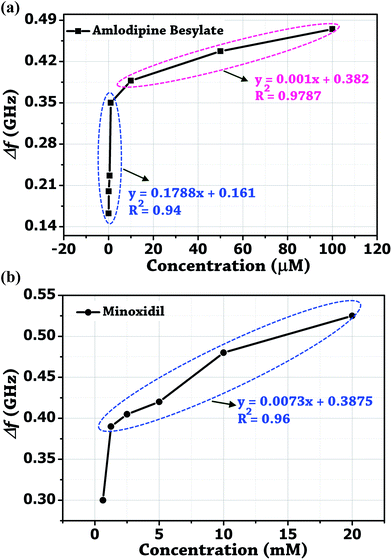
Initially, the colorimetric assay on the two drugs (amlodipine besylate and minoxidil) of different concentrations was performed individually using unmodified gold nanoparticles. It was done with the purpose of studying the extent especially when the colour change of the solution becomes difficult to analyze with naked eyes. In brief, a stock solution of amlodipine besylate (100 μM) and minoxidil (20 mM) was prepared using pH 4 TRIS buffer. We believe that for the condition pKa citrate < pH 4 < pKa 8.6, a strong electrostatic force of attraction exists between the Au NPs and two vasodilator drugs in concern. Therefore, various concentrations of amlodipine besylate were prepared from 100 μM downwards, and the corresponding color changes were recorded. Fig. 9b shows the color change of solution from blue to purple and then magenta upon adding 100 μL of the drug into 500 μL of Au NPs in the range of 100–0.05 μM. Immediately, microwave spectroscopy was performed by measuring the reflection coefficient (S11) of each sample using the proposed metallic crystal loaded microwave resonant probe. As shown in Fig. 9a, the resonant frequencies were obtained at 2.925 GHz, 2.9625 GHz, 3.0125 GHz, 3.05 GHz, 3.1735 GHz, 3.2 GHz and 3.2375 GHz for the amlodipine besylate concentration in the range from 100–0.05 μM. The spectroscopic observations were found consistent with the color change in Au NPs solution from red through magenta, purple and then to blue. As a result, the fitted linear equation y = 0.001x + 0.382 in the range of 100–10 μM has R2 = 0.9787 and linear equation y = 0.1788x + 0.161 shows R2 = 0.94 for concentration in the range 10–0.05 μM (Fig. 10a). The calculated LOD was found to be 164 nM. This shows that as the drug concentration decrease, the solution permittivity also reduces which shifts the frequency of resonance towards the higher side in the frequency spectrum and near to the frequency response of bare Au NPs measured at 3.4 GHz.
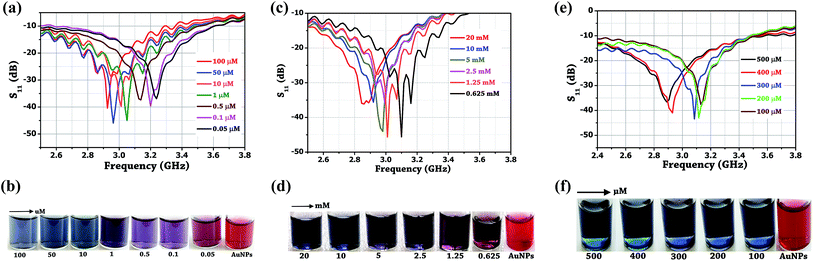 |
| | Fig. 9 Microwave resonance spectra and inset photographs of the corresponding Au NPs solution upon addition of (a and b) amlodipine besylate (0.05–100 μM), (c and d) minoxidil (0.625–20 mM), (e and f) amlodipine besylate (100 μM) in the presence of minoxidil (100–500 μM). | |
 |
| | Fig. 10 Derived calibrated curves from the probe resonance for different concentration of the two vasodilator drugs added independently into Au NPs solution. (a) Amlodipine Besylate. (b) Minoxidil. | |
Similarly, the conjugation of Au NPs with minoxidil drug was investigated for different concentrations between 20–0.625 mM. Fig. 9d shows a progressive change in the Au NPs solution color from red to blue. Testing at the further lower concentration was not favorable due to low solubility of the drug which may otherwise result in erroneous reading. Through the in situ analysis using the proposed microwave resonant probe, the frequency of resonances were obtained at 2.875 GHz, 2.92 GHz, 2.98 GHz, 2.995 GHz, 3.01 GHz and 3.1 GHz in the range of 20–0.625 mM drug respectively as shown in Fig. 9c. The linear trend between the resonant frequencies (fr) and drug concentration is found to be y = 0.0073x + 0.3875, resulting in the coefficient of determination R2 = 0.96 with estimated LOD = 1.78 mM (Fig. 10b). The response of the probe was also tested for the coexistence of minoxidil (100–500 μM) in amlodipine (100 μM) in the solution ratio 1![[thin space (1/6-em)]](https://www.rsc.org/images/entities/char_2009.gif) :2. It was observed that the presence of minoxidil did not influence the binding of amlodipine with Au NPs, and distinct resonances were obtained, viz. 2.89 GHz, 2.93 GHz, 3.085 GHz, 3.115 GHz, and 3.13 GHz as shown in Fig. 9e and f. Table 1 summarizes the analytical data obtained from the analysis of two drugs.
:2. It was observed that the presence of minoxidil did not influence the binding of amlodipine with Au NPs, and distinct resonances were obtained, viz. 2.89 GHz, 2.93 GHz, 3.085 GHz, 3.115 GHz, and 3.13 GHz as shown in Fig. 9e and f. Table 1 summarizes the analytical data obtained from the analysis of two drugs.
Table 1 Analytical data obtained for the two vasodilator drugs using unmodified Au NPs as colorimetric probe and MPC-inspired sensor probe
| Parameters |
Unmodified Au NPs |
Au NPs aggregation by amlodipine besylate |
Au NPs aggregation by minoxidil |
| Color |
Red |
Blue |
Blue |
| Size (nm) |
11.57 |
∼342 |
∼105 |
| SPR (nm) |
519 |
648 |
687 |
| Probe resonant frequency (GHz) |
3.4 |
2.925 |
2.875 |
| Active functional group in aggregation mechanism |
— |
–NH2 |
–NH2 |
| LOD |
— |
164 nM |
1.78 mM |
The performance of the probe was ascertained by repeating the experiment with three iterations (n = 3) on different samples. The measured resonances for amlodipine besylate (10 μM, 0.5 μM), and minoxidil (625 μM, 100 μM) have lower standard deviation as shown in Table 2. The precision determined through relative standard deviation (RSD) was found <2% and demonstrates less uncertainty between the measurements. In the results of probe reflection coefficient (S11) for the two vasodilator drugs, ripples in the resonance curve are likely due to the continuous aggregation of Au NPs over time. However, one should note that the resonant frequency points will be unaffected, as the probe sensor is inspired by the electromagnetic bandgap properties which restrict any deviation in the frequency of resonance. But, a lower value of standard deviation still exists, which might be due to the slight error in the position of the probe, and can be corrected using a position control system or a fixed clamp-type arrangement. Our results suggest that the proposed analytical method of microwave spectroscopy in combination with the colorimetric assay of gold nanoparticles can be effectively used for the simple detection and quantification of the analyte drugs.
Table 2 Repeatability and reproducibility analysis of the vasodilator drugsa
| Sample |
Concentration (μM) |
Resonant frequencyb (GHz) |
Precisionc (%) |
| Drug-1: amlodipine besylate, drug-2: minoxidil. Mean ± standard deviation (n = 3). Precision determined through % RDS as (standard deviation ÷ mean) × 100. |
| Drug-1 |
10 |
3.0125 ± 0.03 |
0.995 |
| 0.5 |
3.1735 ± 0.025 |
0.787 |
| Drug-2 |
625 |
3.1 ± 0.041 |
1.322 |
| 100 |
3.25 ± 0.015 |
0.461 |
5. Conclusions
A very economical, time-effective and simple analytical technique based on microwave spectroscopy of unmodified Au NPs undergoing aggregation upon the addition of analyte at optimum pH, has been reported in the present work. Our proposed technique involving the distinct resonance curves for different concentration of the two drugs in Au NPs, is much simpler and user-friendly than that of UV-visible spectroscopy. We demonstrated the detection and quantification of two vasodilator drugs (amlodipine besylate and minoxidil) in their pharmaceutical formulations, using unmodified Au NPs. The applicability of our proposed technique can be further enhanced to improve LOD (currently 164 nM and 1.78 mM for amlodipine besylate and minoxidil, respectively) of the targeted drugs by using surface-modified Au NPs, janus nanoparticles, functionalized nanoparticles, etc. which may provide larger scope of future work. Ripple in the resonance curves is one of the identified challenge which occurs due to the dispersive nature of Au NPs solution. The method was successfully tested in the case where two drugs may coexist. The repeatability and reproducibility test shows higher amount of precision has been achieved. It anticipated that the analytical platform with integrity of microwave sensor probe and Au NPs colorimetric probe simultaneously holds potential for the analysis of drugs, biomolecules, and pathogens.
Acknowledgements
The authors thank Electronics Engineering Department and Chemical Engineering Department, SVNIT, for providing the measurement facility. They also thank Technical Quality Improvement Program (TEQIP), Phase-II, SVNIT, for supporting this research (Grant no. ECED/TEQIP-II/1910/2015-2016).
References
- M. Miyamoto, K. Kotani, S. Ishibashi and N. Taniguchi, Int. J. Vasc. Med., 2012, 2012, 1–11 CrossRef.
- J. N. Cohn MD, G. T. Mclnnes MD and A. M. Shepherd MD, J. Clin. Hypertens., 2011, 13, 690–692 CrossRef PubMed.
- S. Julius, S. E. Kjeldsen and M. Weber, Lancet, 2004, 363, 2022–2031 CrossRef CAS.
- L. Amankwa, L. G. Chatten and S. Pons, Analyst, 1983, 108, 1221–1226 RSC.
- R. A. Shaalan, T. S. Belal, F. A. El Yazbi and S. M. Elonsy, Arabian J. Chem., 2017, 10, 381–394 Search PubMed.
- L. Gagliardi, A. Amato, L. Turchetto and D. Tonelli, Anal. Lett., 1991, 24, 1825–1835 CrossRef CAS.
- R. R. Kallem, R. Mullangi, K. K. Hotha, L. K. Ravindranath, Y. N. Spoorthy and J. V. L. N. Seshagirirao, Bioanalysis, 2013, 5, 827–837 CrossRef CAS PubMed.
- D. R. Johnson and S. R. Botch, J. Anal. Toxicol., 2011, 35, 65–74 CrossRef PubMed.
- N. Y. Khalil, T. A. Wani, M. A. Abunassif and I. A. Darwish, J. Liq. Chromatogr. Relat. Technol., 2011, 34, 2583–2595 CrossRef CAS.
- I. A. Aljuffali, C. T. Sung, F.-M. Shen, C.-T. Huang and J.-Y. Fang, AAPS J., 2014, 16, 140–150 CrossRef CAS PubMed.
- M. Khairy, A. A. Khorshed, F. A. Rashwan, G. A. Salah, H. M. A. Abdel-Wadood and C. E. Banks, Sens. Actuators, B, 2017, 239, 768–775 CrossRef CAS.
- V. Pfaffeen and P. I. Ortiz, Anal. Sci., 2005, 22, 91–94 CrossRef.
- N. Alizadeh and F. Hemati, Bull. Fac. Pharm., 2014, 52, 109–114 Search PubMed.
- Z. A. Zaheer, S. Mirza, I. Moazzam and I. W. Sayad, Der Pharma Chemica, 2012, 4, 568–573 Search PubMed.
- K. Saha, S. S. Agasti, C. Kim, X. Li and V. M. Rotello, Chem. Rev., 2012, 112, 2739–2779 CrossRef CAS PubMed.
- Y.-C. Yeh, B. Creran and V. M. Rotello, Nanoscale, 2012, 4, 1871–1880 RSC.
- K. A. Rawat, H. Basu, R. K. Singhal and S. K. Kailasa, RSC Adv., 2015, 5, 19924–19932 RSC.
- S. Teepoo, P. Chumsaeng, K. Palasak, N. Bousod, N. Mhadbamrung and P. S. Lim, Talanta, 2013, 117, 518–522 CrossRef CAS PubMed.
- M. Yarbakht and M. Nikkhah, J. Exp. Nanosci., 2016, 11, 593–601 CrossRef CAS.
- X. Xie, R. Deng, F. Liu, W. Xu, S. F. Y. Li and X. Liu, Anal. Methods, 2013, 5, 1116–1119 RSC.
- V. Selvaraj, M. Alagar and I. Hamerton, Electrochim. Acta, 2006, 52, 1152–1160 CrossRef CAS.
- K. Grenier, D. Dubuc, P.-E. Poleni, M. Kumemura, H. Toshiyoshi, T. Fujii and H. Fujita, IEEE Trans. Microwave Theory Tech., 2009, 57, 3246–3253 CrossRef CAS.
- N.-Y. Kim, K. K. Adhikari, R. Dhakal, Z. Chuluunbaatar, C. Wang and E.-S. Kim, Sci. Rep., 2014, 5, 1–9 Search PubMed.
- Y.-F. Chen, H.-W. Wu, Y.-H. Hong and H.-Y. Lee, Biosens. Bioelectron., 2014, 61, 417–421 CrossRef CAS PubMed.
- D. Smith, W. Padilla, D. Vier, S. N. Nasser and S. Schultz, Phys. Rev. Lett., 2000, 84, 4184–4187 CrossRef CAS.
- C. Cao, J. Zhang, X. Wen, S. L. Dodson, N. T. Dao, L. Mun Wong, S. Wang, S. Li, A. T. Phan and Q. Xiong, Nano, 2013, 7, 7583–7591 CAS.
- S. J. Park, J. T. Hong, S. J. Choi, H. S. Kim, W. K. Park, S. T. Han, J. Y. Park, S. Lee, D. S. Kim and Y. H. Ahn, Sci. Rep., 2014, 4, 1–7 Search PubMed.
- H.-J. Lee, J.-H. Lee and H.-L. Jung, Appl. Phys. Lett., 2011, 99, 163703 CrossRef.
- J. P. Grant, R. N. Clarke, G. T. Symm and N. M. Spyrou, J. Phys. E: Sci. Instrum., 1989, 22, 757–770 CrossRef CAS.
- M. Stuchly, T. Athey, G. Samaras and G. Taylor, IEEE Trans. Microwave Theory Tech., 1982, 30, 87–92 CrossRef.
- D. Baudry, A. Louis and B. Mazari, Prog. Electromagn. Res., 2006, 60, 311–333 CrossRef.
- D. J. Rowe, A. Porch, D. A. Barrow and C. J. Allender, IEEE Trans. Microwave Theory Tech., 2012, 60, 1699–1708 CrossRef.
- N. Wagner, M. Schwing and A. Scheuermann, IEEE Trans. Geosci. Rem. Sens., 2014, 52, 880–893 CrossRef.
- A. R. McGurn and A. A. Maradudin, Phys. Rev., 1993, 48, 17576–17579 CAS.
- E. I. Smirnova, C. Chen, M. A. Shapiro, J. R. Sirigiri and R. J. Temkin, J. Appl. Phys., 2002, 91, 960–968 CrossRef CAS.
- J. Turkevich, P. C. Stevenson and J. Hillier, Discuss. Faraday Soc., 1951, 11, 55–75 RSC.
- https://www.drugbank.ca/drugs/DB00381.
- https://www.drugbank.ca/drugs/DB00350.
Footnote |
| † Electronic supplementary information (ESI) available. See DOI: 10.1039/c7ra04074a |
|
| This journal is © The Royal Society of Chemistry 2017 |
Click here to see how this site uses Cookies. View our privacy policy here. 
 Open Access Article
 This Open Access Article is licensed under a
  a,
Piyush N. Patel
a,
Piyush N. Patel
 , where f is the frequency and ε is the solution permittivity.