DOI:
10.1039/C7RA03961A
(Paper)
RSC Adv., 2017,
7, 27361-27369
Folate-modified silicon carbide nanoparticles as multiphoton imaging nanoprobes for cancer-cell-specific labeling†
Received
7th April 2017
, Accepted 16th May 2017
First published on 23rd May 2017
Abstract
Interest in multiphoton microscopy for cell imaging has considerably increased over the last decade. Silicon carbide (SiC) nanoparticles exhibit strong second-harmonic generation (SHG) signal, and can thus be used as nonlinear optical probes for cell imaging. In this study, the surface of SiC nanoparticles was chemically modified to enable cancer-cell-specific labeling. In a first step, an aminosilane was grafted onto the surface of SiC nanoparticles. The resulting nanoparticles were further modified with folic acid, using an isothiocyanate-based coupling method. Nanoparticles from different functionalization steps were investigated by zeta potential measurement, colorimetric titration, infrared and ultraviolet-visible (UV-Vis) absorption spectroscopy, X-ray photoelectron spectroscopy (XPS), and time-of-flight secondary ion mass spectrometry (ToF-SIMS). Characterization results confirmed successful covalent grafting of silane and folic acid to nanoparticle surface. Finally, the efficacy of these folate-modified SiC nanoparticles for cancer-cell-specific labeling was evaluated by multiphoton microscopy, by measuring SHG-emitting cell area on multiphoton images. The average cancer-cell labeling percentage was about 48%, significantly higher than for negative controls (healthy cells, competition assay and poly(ethylene glycol) modified-SiC nanoparticles), where it ranged between 10% and 15%. These results demonstrated good efficiency and specificity for these folate-modified SiC nanoparticles in cancer-cell-specific labeling.
Introduction
With the increase in life expectancy, cancer has become one of the most important health issues around the world. Treatment efficacy correlates with early and accurate diagnosis. Thus continual improvement is necessary in diagnosis techniques, particularly in imaging. Progress has been made, using acoustic waves or various electromagnetic waves such as X-rays, radiofrequency waves and visible or infrared photons, allowing highly sensitive and non-invasive observation.1 Of all these techniques, optical imaging offers high sensitivity without the drawbacks of ionizing radiation. Fluorescence microscopy is, by far, the most widely used technique in histopathology, due to its simplicity and good lateral resolution. It usually requires cell labeling with various fluorophores. However, fluorescent labels have drawbacks, such as narrow absorption spectra in the visible range and generally large emission bands. This can impair the signal-to-noise ratio, due to the fluorescence of biological tissues. Moreover, many fluorophores are highly sensitive to photobleaching, and some exhibit high toxicity.2 Quantum dots have been proposed as a solution to overcome the problem of photobleaching, but their toxicity, due to heavy-metal release, is a limiting factor for biological application. To counterbalance these limitations, imaging techniques based on nonlinear optical properties have been developed during this last decade. Second-harmonic generation (SHG) and two-photon excited fluorescence (TPEF) microscopies are the most frequently used nonlinear optical (NLO) techniques. Although NLO properties can be observed in some biological molecules or structures, such as collagen, lipid membranes or NADH,3–6 the NLO signal of living tissue is quite low.5 Thus, to improve imaging quality, many studies have focused on developing new and effective NLO probes.7–12 Similarly to fluorescence, two kinds of probe have been studied: organic molecular probes, and nanoparticles. Nanoparticle probes with NLO properties, also called harmonic nanoparticles (HNPs)11,12 or second-harmonic radiation imaging probes (SHRIMPs),10,13 are of great interest for cell imaging. The HNPs so far studied for biological imaging were mainly based on metal oxides such as KNbO3,14–16 LiNbO3,11 BaTiO3,9,10,16–18 ZnO,8,9,16 BiFeO3,19 or KTiOPO4;11,16 ZnO and KTiOPO4, however, exhibit non-negligible toxicity11 and are less interesting for application in living cells. Due to their non centrosymmetric crystal structure, HNPs exhibit an intense and sharp SHG signal, without photobleaching and in a wide range of excitation wavelengths. This ability to tune the excitation wavelength allows near-infrared excitation radiation to be used. This spectral region is very interesting, since light absorption and scattering by living tissue are greatly reduced in this range, thus enhancing excitation intensity and allowing use of thicker samples, due to the greater penetration depth of the exciting light.12 Unlike HNPs, for which the exciting light is scattered only during the SHG process, nonlinear active molecules in solution exhibit TPEF properties which require a specific excitation wavelength to achieve light absorption between two molecular energy levels. By contrast, the excitation wavelength of HNPs can be tuned in a wide range. Moreover, scattering does not induce photobleaching. Furthermore the nonlinear cross-sections of HNPs are greater by one to two orders of magnitude18 than in nonlinear active molecules. Silicon carbide (SiC) nanoparticles present numerous advantages for living-cell imaging. Firstly, they exhibit strong SHG properties20,21 with low toxicity for cells,22–24 although this low toxicity has to be set against some reports of proinflammatory response and oxidative stress.22,23; this type of behavior seems to be limited to nanoparticles with diameters in the 15 nm range.23 Secondly, SiC surface can be modified using silane chemistry25,26 or radical chemistry.27–29 Multiphoton imaging, used to observe NLO probes, is particularly useful for cancer diagnosis.11,13,19 In fact, multiphoton microscopy presents various advantages over linear techniques, including an inherent 3-dimensional sectioning capability without the need for a confocal pinhole, deeper imaging penetration thanks to lower scattering at longer wavelengths, and longer sample stability because of reduced absorption beyond the focal region.30 HNPs efficiently emit SHG under two photon excitation, and some of these nanomaterials have recently shown also strong third harmonic emission31 which can be detected simultaneously with SHG to increase selectivity against the tissue background.32 To specifically label tumor cells, HNPs must be functionalized with a cancer-cell-specific ligand, and for this folic acid is of particular interest. Folic acid receptors are overexpressed by a wide range of cancer cells,33 giving this molecule versatile recognition properties. Moreover, as folic acid receptors are found at low levels in normal tissue, a folic acid ligand provides high specificity. Finally, folic acid is chemically stable and offers several covalent coupling possibilities for nanoparticle functionalization.
In this paper, we describe a method to prepare folate-modified SiC HNPs. The surface of SiC nanoparticles was firstly chemically modified in order to graft a synthetic poly(ethylene glycol)-folate (PEG-folate) molecule. The role of the PEG spacer is to increase the affinity between folic acid and cancer-cell receptors, thanks to its length and flexibility.34 The nanoparticles from different functionalization steps were fully characterized using spectroscopic and chemical analyses. Finally, after incubation with healthy and cancer cells, the labeling efficiency of folate-modified SiC HNPs was evaluated on multiphoton laser scanning microscopy.
Materials and methods
Materials
SiC–3C nanoparticles were purchased from KM Labs (Ukraine). All chemicals were obtained from Sigma-Aldrich and used as received. Milli-Q water (18.2 MΩ cm) was used in all the preparations.
Surface modification of SiC nanoparticles
The initial powder of SiC nanoparticles was heated at 600 °C, in air, for 1 h. After cooling, the powder was dispersed at a concentration of 80 mg mL−1 in an aqueous potassium hydroxide (KOH) 9 M solution and the dispersion was sonicated during 1 h. Then, nanoparticles were washed 3 times by centrifugation (1000g, 1–5 min) and redispersed in water. After redispersion, nanoparticles were left for sedimentation for 24 h. The resulting precipitate was discarded and the supernatant was kept for functionalization. The supernatant concentration was estimated at 2.7 mg mL−1 by weighing. A dispersion of nanoparticles was prepared by mixing 9 mL anhydrous ethanol with 1 mL supernatant. Then 155 μL of a 0.1 M ethanol solution of 3-aminopropyltriethoxysilane (APTES) was added to the nanoparticle dispersion. The mixture was left to react overnight under magnetic stirring (300 rpm), and finally heated to reflux for 1 h. During the reflux, a syringe pump was used to introduce ethanol at a flow rate of 10 mL h−1, to compensate for solvent evaporation. After reaction, nanoparticles were briefly sonicated, washed twice by centrifugation (1000g, 1 min) and redispersed in ethanol. The same functionalization protocol was then repeated a second time, to increase the density of APTES molecules on the nanoparticle surface. After each step of functionalization, nanoparticles were characterized by zeta potential measurements and infrared spectroscopy. Amine surface density was quantified by a colorimetric titration method, described below. X-ray photoelectron spectroscopy (XPS) and time-of-flight secondary ion mass spectrometry (ToF-SIMS) were used to compare KOH-treated and APTES-modified SiC nanoparticles.
Synthesis of PEG-folate
PEG-folate was synthesized as described by Lee et al.34 In a first step, folic acid was activated using N-Hydroxysuccinimide (NHS) chemistry: 1 g (0.11 M) of folic acid was dissolved in 20 mL anhydrous dimethyl sulfoxide (DMSO), and then activated by adding 950 mg (0.23 M) dicyclohexyl carbodiimide (DCC), 525 mg (0.23 M) NHS and 500 μL (0.18 M) triethylamine. The solution was stirred magnetically (1000 rpm) overnight at room temperature. After reaction, the solution was concentrated under vacuum heating (60 °C). Then NHS-folate was precipitated and washed with diethylether. In a second step, PEG-folate was obtained by dissolving 35 mg (13 mM) NHS-folate, 190 mg (13 mM) PEG-diamine (molecular weight = 3000 g mol−1) and 500 μL (0.72 M) triethylamine in 5 mL anhydrous DMSO. The solution was stirred (500 rpm) overnight at room temperature, then dialyzed (Spectra/Por, molecular weight cut-off = 1 kDa) against water for 3 days. Finally, PEG-folate powder was obtained after freeze drying.
Grafting of PEG-folate onto SiC nanoparticles
Amino-functionalized SiC nanoparticles were centrifuged and redispersed in dimethylformamide (DMF) at a concentration of 5.4 mg mL−1. Then 500 μL of this nanoparticle dispersion was mixed with 1500 μL of a 170 nM 1,4-butane diisothiocyanate solution in DMF (Scheme 1). The mixture was stirred (1500 rpm) overnight. After reaction, nanoparticles were washed twice by centrifugation (6700g, 2 min) and redispersed in 1 mL DMSO. Then, 1000 μL PEG-folate solution (750 μM) in DMSO was added to the dispersion. The mixture was stirred (1500 rpm) overnight. After reaction, nanoparticles were washed twice by centrifugation (6700g, 2 min) and redispersed in DMSO. The resulting SiC-PEG-folate nanoparticles were characterized on XPS, ToF-SIMS, infrared and ultraviolet-visible (UV-Vis) absorption spectroscopy. The same process was used, using O-(2-aminoethyl)polyethylene-glycol (molecular weight = 3000 g mol−1), to synthesize simple PEGylated nanoparticles (SiC-PEG) as negative control.
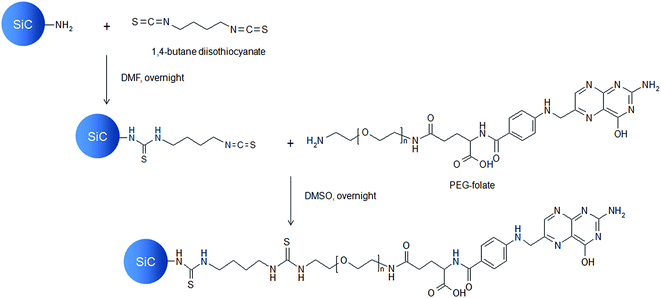 |
| | Scheme 1 Functionalization of SiC nanoparticles with PEG-folate. | |
Cell incubation with SiC nanoparticles
Cell cultures of 3T3-L1 mouse fibroblasts (American Type Culture Collection, Manassas, VA, USA) and human hepatocarcinoma-derived HuH7 cells (European Collection of Cell Cultures, Salisbury, UK) were initially grown in Dulbecco's modified Eagle's medium (DMEM) containing 4.5 g L−1 glucose supplemented with 10% newborn calf serum (American Type Culture Collection, Manassas, VA, USA), 100 IU penicillin, and 100 μg streptomycin at 37 °C in a water-saturated atmosphere with 5% CO2, in a Heraeus incubator. Cells were seeded at 2500 per well. Two days before nanoparticle incubation, cells were transferred in folate-free DMEM. Cells were incubated for 4 h in presence of SiC nanoparticles (70 μg mL−1) in 500 μL folate-free DMEM. Four different assays were performed (Table 1). For the competition assay, 100 μg folic acid was added to the culture medium, in addition to cells and nanoparticles. After incubation, cells were rinsed 3 times, stained with Nile Red fluorophore, rinsed again, and fixed on glass slides by formaldehyde (4%).
Table 1 Conditions for cell incubation in presence of SiC nanoparticles
| Cell type |
3T3-L1 |
HuH7 |
HuH7 |
HuH7 |
| SiC type |
SiC-PEG-folate |
SiC-PEG-folate |
SiC-PEG-folate |
SiC-PEG |
| Competition assay |
No |
No |
Yes |
No |
Multiphoton imaging
Fixed cells were observed with a Nikon multiphoton inverted microscope (A1R-MP) coupled to a Mai-Tai tunable Ti:sapphire oscillator (Spectra-Physics; 100 fs, 80 MHz, 700–1000 nm). A plan apochromat 20× water-immersion objective with a 0.75 numerical aperture was used to focus the excitation laser at 790 nm and epi-collect the Nile Red and SHG emission. The collected signals were processed by non-descanned detectors with using band-pass filters (SemRock) of 395/11 nm for SHG and 607/70 nm for Nile Red fluorescence.
Characterization methods
Infrared absorption spectra were obtained in ATR mode on a diamond crystal using a Nicolet 6700 spectrometer (Thermo Scientific). Zeta potential was evaluated using a Zetasizer apparatus (Malvern Instruments). UV-Vis absorption spectra were collected in a quartz cell with 1.0 cm path length using a SAFAS-UV mc2 double-beam spectrophotometer. Proton nuclear magnetic resonance spectroscopy (1H NMR) was performed using an Avance III – 400 MHz (Bruker) spectrometer. Colorimetric amine titration was performed by adapting a method35 based on the electrostatic interaction between protonated amine groups from nanoparticles and sulfonate groups from Coomassie Brilliant Blue (CBB) dye; the detailed procedure for CBB titration is given in ESI.† XPS measurements were performed with an Axis Ultra-DLD spectrometer (Kratos, Manchester, UK), using an Al(Kα) monochromatic source (1486 eV) operating at 150 W with X-ray spot size 400 × 700 μm2. ToF-SIMS analysis was conducted using a reflection-type TOFSIMS IV spectrometer (ION-TOF GmbH, Münster, Germany) equipped with a 25 keV liquid metal-ion gun (LMIG) operating with bismuth primary ions. Detailed experimental conditions for XPS and ToF-SIMS can be found in ESI.†
Results and discussion
Surface modification of SiC nanoparticles
SiC–3C nanoparticles with a mean diameter of 150 nm were selected (Fig. S1†). Their non-centrosymmetric crystalline structure and their large diameter (associated with a large two-photon absorption cross-section) provide an intense SHG peak, as shown in ESI (Fig. S1D†). Amine functionalization of SiC nanoparticles was performed using silanization reaction. To monitor APTES grafting on SiC nanoparticles, zeta potential measurements and amine titration onto nanoparticles were performed before and after each silanization step, as shown in Table 2. Zeta potential values shifted from −40 mV for KOH-treated SiC nanoparticles to −20 mV after the first step of APTES silanization (APTES-1) and to +20 mV after the second step (APTES-2). Amine surface density increased from 0 for KOH-treated nanoparticles to 0.5 amine nm−2 for APTES-2. These results are consistent with a strong surface modification throughout the various steps of the process. The strongly negative zeta potential of KOH-treated SiC nanoparticles can be attributed to silanol groups initially present at the surface after alkaline treatment. These silanols react gradually with APTES during the two steps of silanization and are replaced by amine functions, explaining the increase in zeta potential after each step of reaction. Amine surface density results presented a similar increase, confirming qualitative results obtained with zeta potential measurement. Infrared spectroscopy data (Fig. 1) revealed C–H stretching vibrations at 2845 cm−1 and 2915 cm−1 for APTES-1 and APTES-2 modified SiC nanoparticles. These peaks were not observed for KOH-treated SiC nanoparticles, and can be attributed to C–H bonds from the silane when grafted on the nanoparticle surface.25 There was also a significant evolution in the 1000–1200 cm−1 region, corresponding to the stretching vibration of Si–O–Si bonds. The NH2 peak at 1620 cm−1 could not be observed, due to the presence of broad SiC phonon36 and water peaks (the full infrared spectra are given in ESI, Fig. S2†). For KOH-treated and APTES-1 modified SiC nanoparticles, no Si–O–Si peak was observed. However, for APTES-2 modified SiC nanoparticles, a broad Si–O–Si peak appeared. The delayed appearance of this peak was consistent with the gradual increase in zeta potential. Indeed, we can consider that, for APTES-1 modified SiC nanoparticles, only some APTES spots were grafted on the SiC surface. During the second step of functionalization, the additional APTES molecules could react with the remaining silanol groups onto SiC nanoparticles but could also condense with the available silanol functions onto the already grafted APTES molecules. This 2 or 3-dimensional condensation process may enable a continuous layer of silica to be reached on the surface of the particles after the second silanization step. Therefore, the APTES-2 modified SiC nanoparticles were used for PEG-folate grafting. XPS analyses confirmed results obtained with previous analysis techniques. Atomic percentage results showed a clear increase in oxygen content, related to a clear decrease in silicon content and appearance of nitrogen, whereas carbon content remained largely unchanged (Table 3). This is consistent with APTES grafting on the nanoparticle surface. Analysis of the Si2p level of KOH-treated SiC nanoparticles (Fig. 2A) revealed intense peaks at 100.42 and 100.96 eV, typical of Si–C bonds, and a smaller peak at 102.08 eV, ascribable to Si–O bonds. After modification with APTES, a dramatic decrease in the Si–C peaks and a very intense Si–O peak at 102.64 eV indicated the formation of layers containing many Si–O bonds due to a successful silanization. In addition, the peak at 102.64 eV was typical of silicon suboxides,37 which is compatible with triethoxysilane structure. Finally, an intense peak at 400.38 eV appeared after silanization, corresponding to the N 1s level and indicating the presence of nitrogen in N–H bonds from APTES (Fig. S3 in ESI†).38 The low-intensity peak located at 398.03 eV can be attributed to C–NH2 bonds.39 ToF-SIMS analyses were also performed, to characterize the evolution of nanoparticle surface chemistry during the silanization process. Results are summarized in Table 4. Before silanization, fragmentation revealed combinations of carbon, oxygen and silicon, indicating the presence of an oxidized surface with silanol groups on the nanoparticle surface. After APTES grafting, these fragments were absent and replaced by a new type of fragments. In these new fragments, nitrogen was detected, coming from APTES. The presence of C3H7N+ and SiC3H9N+, corresponding to the aminopropyl chain of APTES, confirmed APTES grafting on the SiC nanoparticles.
Table 2 Zeta potential measurements and amine surface density for KOH-treated SiC nanoparticles, after the first silanization step with APTES (APTES-1) and after the second silanization step with APTES (APTES-2)
| SiC nanoparticles |
KOH-treated |
APTES-1 |
APTES-2 |
| Zeta potential (mV) |
−40 |
−20 |
+20 |
| Amine surface density (NH2 nm−2) |
0 |
0.36 |
0.5 |
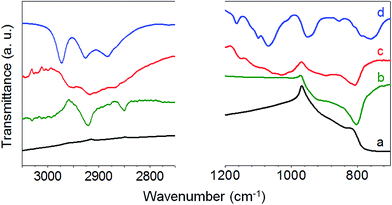 |
| | Fig. 1 Infrared transmission spectra of KOH-treated (a), APTES-1 (b), APTES-2 modified SiC nanoparticles (c) and APTES (d). | |
Table 3 Atomic percentages of carbon, oxygen, silicon and nitrogen for KOH-treated and APTES-2 modified SiC nanoparticles, determined using XPS
| |
Atomic percentage (%) |
| C |
O |
Si |
N |
| KOH-treated SiC |
51.52 ± 0.48 |
13.50 ± 0.42 |
34.95 ± 0.50 |
— |
| APTES-2 SiC |
45.90 ± 0.30 |
32.14 ± 0.60 |
8.40 ± 0.15 |
8.91 ± 0.40 |
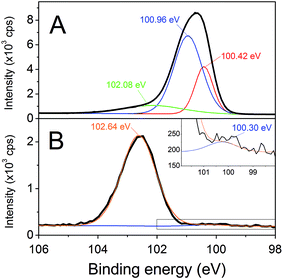 |
| | Fig. 2 Si2p level XPS spectra of KOH-treated (A) and APTES-2 modified SiC nanoparticles (B). Inset: magnification on the peak located at a binding energy of 100.30 eV observed for APTES-2 modified SiC nanoparticles. | |
Table 4 Main negative and positive fragments for KOH-treated and APTES-2 modified SiC nanoparticles, determined using ToF SIMS analysis
| m/z |
KOH-treated SiC |
APTES-2 SiC |
Fragment formula |
Potential origin |
| 45.01 |
Present |
Absent |
SiOH+ |
Silanols from SiC surface |
| 91.95 |
Present |
Absent |
Si2C3− |
SiC fragments |
| 175.88 |
Present |
Absent |
Si4O4−/Si4C4O− |
Oxide layer on SiC |
| 44.00 |
Absent |
Present |
SiNH2+ |
Secondary ion with Si and N from APTES |
| 57.05 |
Absent |
Present |
C3H7N+ |
Aminopropyl fragment from APTES |
| 86.99 |
Absent |
Present |
SiC3H9N+ |
Aminopropyl + Si fragment from APTES |
Synthesis of PEG-folate
The PEG folate molecule was obtained by coupling folic acid with PEG-diamine. The reaction was mediated by dicyclohexyl-carbodiimide/N-Hydroxysuccinimide (DCC-NHS) and the product was characterized by infrared (Fig. 3) and 1H NMR spectroscopy (Fig. S4 in ESI†). A typical peak at 1690 cm−1, corresponding to carbonyl bonds of folic acid (Fig. 3a), could be seen on the PEG-folate infrared spectrum (Fig. 3c). This peak may be associated with free carboxylic acid groups remaining on the PEG-folate (Scheme 1). Then, C![[double bond, length as m-dash]](https://www.rsc.org/images/entities/char_e001.gif) O stretching vibration at 1645 cm−1 and N–H bending vibration at 1605 cm−1, coming from amide groups, can be observed in both Fig. 3a and c. Additionally, in Fig. 3c, the characteristic peaks coming from PEG (Fig. 3b) can also be identified, such as C–H stretching at 2880 cm−1, C–H bending at 1460 cm−1 and 1342 cm−1 and C–O stretching at 1107 cm−1. These peaks confirmed the successful grafting of folic acid on PEG-diamine. Furthermore, on the 1H NMR spectrum of PEG-folate (Fig. S4†), typical protons of folic acid were also observed (400 MHz, D2O, δ in ppm): 3.5–3.66 ppm (m, 276H), 3.72 ppm (t, 2H), 4.74 ppm (s, 1H), 6.76 ppm (t, 1.3H), 7.61 ppm (t, 1.3H) and 8.71 ppm (d, 0.6H).
O stretching vibration at 1645 cm−1 and N–H bending vibration at 1605 cm−1, coming from amide groups, can be observed in both Fig. 3a and c. Additionally, in Fig. 3c, the characteristic peaks coming from PEG (Fig. 3b) can also be identified, such as C–H stretching at 2880 cm−1, C–H bending at 1460 cm−1 and 1342 cm−1 and C–O stretching at 1107 cm−1. These peaks confirmed the successful grafting of folic acid on PEG-diamine. Furthermore, on the 1H NMR spectrum of PEG-folate (Fig. S4†), typical protons of folic acid were also observed (400 MHz, D2O, δ in ppm): 3.5–3.66 ppm (m, 276H), 3.72 ppm (t, 2H), 4.74 ppm (s, 1H), 6.76 ppm (t, 1.3H), 7.61 ppm (t, 1.3H) and 8.71 ppm (d, 0.6H).
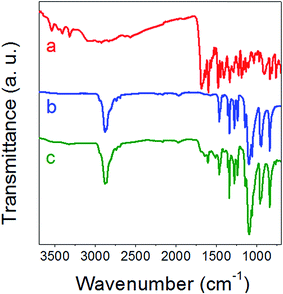 |
| | Fig. 3 Infrared transmission spectra of folic acid (a), PEG-diamine (b) and PEG-folate (c). | |
Grafting of PEG-folate on SiC nanoparticles
Isothiocyanate-based coupling was used to conjugate PEG-folate to SiC nanoparticles. Contrary to classical coupling with carbodiimide-NHS chemistry, this method leads to high yields without by-products needing to be removed. PEG-folate grafting on isothiocyanate-modified SiC nanoparticles was monitored on infrared spectroscopy (Fig. 4), XPS (Fig. 5), UV-visible absorption (Fig. 6) and ToF-SIMS (Table 5). Analyses were performed on pure PEG-folate and folate-modified SiC nanoparticles. The infrared spectrum of folate-modified SiC nanoparticles (Fig. 4b) revealed 2 peaks, at 1610 cm−1 and 1107 cm−1. The 1610 cm−1 peak can be attributed to C![[double bond, length as m-dash]](https://www.rsc.org/images/entities/char_e001.gif) O stretching vibration from carbonyl functions of folic acid, while the 1107 cm−1 peak was associated with C–O stretching vibration from ether bonds of PEG.40–42 This peak can also be attributed, to a lesser extent, to stretching vibration of thiocarbonyl functions,43 which are generally localized close to 1100 cm−1. The presence of ether bonds from PEG was also confirmed by the C 1s level XPS spectrum of PEG-folate (Fig. 5A). The two lowest energy peaks (284.99 and 286.61 eV) can be attributed to C–C and C–O bonds, respectively. In particular, the 286.61 eV peak was very intense and could be used to characterize the presence of ether bonds on folate-modified SiC nanoparticles.44 This peak was also observed on C 1s level XPS spectrum of folate-modified SiC nanoparticles at 286.56 eV (Fig. 5C). Its intensity reached 48% of the total signal measured for C 1s level, compared to only 26% for APTES-2 modified SiC nanoparticles (Fig. 5B), confirming the success of PEG-folate grafting. Finally, the peak observed around 287.9 eV (287.99 eV for PEG-folate and 287.94 eV for folate-modified SiC nanoparticles) is characteristic of amide bonds and also indicates the presence of PEG-folate on SiC nanoparticles. PEG-folate also showed strong absorption in the UV-Vis region, due to folic acid (Fig. 6a). APTES-2 modified SiC nanoparticles exhibited a continuous scattering background in the UV-Vis range (Fig. 6c). This signal was subtracted from the spectrum of folate-modified nanoparticles (Fig. 6b, inset), after which a band at 285 nm was clearly obtained for folate-modified nanoparticles, corresponding to that of folic acid (Fig. 6a).45,46 ToF-SIMS analyses of pure PEG-folate and folate-modified SiC nanoparticles are summarized in Table 5. Concerning PEG-folate, the fragments with m/z equal to 162.04 and 176.04 are of particular interest, since they can easily be attributed to the pteridine cycle of folic acid. In addition, fragments at 44.04 and 58.03 can be attributed respectively to ethylene oxide sub-units of PEG-diamine and aminoethyl tails of PEG-diamine. These peaks were also present for folate-modified SiC nanoparticles. In addition, ToF-SIMS detected fragments containing sulfur, and notably a fragment with m/z = 71.99, which can be attributed to the thiourea groups which may indicate covalent binding between PEG-folate and SiC nanoparticles.
O stretching vibration from carbonyl functions of folic acid, while the 1107 cm−1 peak was associated with C–O stretching vibration from ether bonds of PEG.40–42 This peak can also be attributed, to a lesser extent, to stretching vibration of thiocarbonyl functions,43 which are generally localized close to 1100 cm−1. The presence of ether bonds from PEG was also confirmed by the C 1s level XPS spectrum of PEG-folate (Fig. 5A). The two lowest energy peaks (284.99 and 286.61 eV) can be attributed to C–C and C–O bonds, respectively. In particular, the 286.61 eV peak was very intense and could be used to characterize the presence of ether bonds on folate-modified SiC nanoparticles.44 This peak was also observed on C 1s level XPS spectrum of folate-modified SiC nanoparticles at 286.56 eV (Fig. 5C). Its intensity reached 48% of the total signal measured for C 1s level, compared to only 26% for APTES-2 modified SiC nanoparticles (Fig. 5B), confirming the success of PEG-folate grafting. Finally, the peak observed around 287.9 eV (287.99 eV for PEG-folate and 287.94 eV for folate-modified SiC nanoparticles) is characteristic of amide bonds and also indicates the presence of PEG-folate on SiC nanoparticles. PEG-folate also showed strong absorption in the UV-Vis region, due to folic acid (Fig. 6a). APTES-2 modified SiC nanoparticles exhibited a continuous scattering background in the UV-Vis range (Fig. 6c). This signal was subtracted from the spectrum of folate-modified nanoparticles (Fig. 6b, inset), after which a band at 285 nm was clearly obtained for folate-modified nanoparticles, corresponding to that of folic acid (Fig. 6a).45,46 ToF-SIMS analyses of pure PEG-folate and folate-modified SiC nanoparticles are summarized in Table 5. Concerning PEG-folate, the fragments with m/z equal to 162.04 and 176.04 are of particular interest, since they can easily be attributed to the pteridine cycle of folic acid. In addition, fragments at 44.04 and 58.03 can be attributed respectively to ethylene oxide sub-units of PEG-diamine and aminoethyl tails of PEG-diamine. These peaks were also present for folate-modified SiC nanoparticles. In addition, ToF-SIMS detected fragments containing sulfur, and notably a fragment with m/z = 71.99, which can be attributed to the thiourea groups which may indicate covalent binding between PEG-folate and SiC nanoparticles.
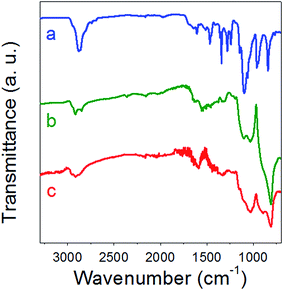 |
| | Fig. 4 Infrared transmission spectra of PEG-folate (a), folate-modified (b) and APTES-2 modified SiC nanoparticles (c). | |
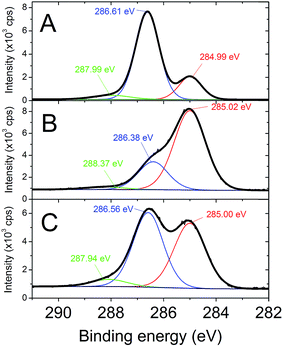 |
| | Fig. 5 C 1s level XPS spectra of PEG-folate (A), APTES-2 modified SiC nanoparticles (B) and folate-modified SiC nanoparticles (C). | |
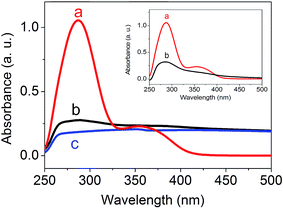 |
| | Fig. 6 UV-visible absorption spectra of PEG-folate (a), folate-modified SiC nanoparticles (b) and APTES-2 modified SiC nanoparticles (c). Inset: UV-Vis absorption spectra of PEG-folate (a) and folate-modified SiC nanoparticles after subtraction of scattering signal coming from APTES-2 modified SiC nanoparticles (b). | |
Table 5 Main positive and negative fragments for pure PEG-folate and folate-modified SiC nanoparticles, determined with ToF SIMS analysis
| m/z |
PEG-folate |
Folate modified SiC |
Fragment formula |
Potential origin |
| 44.04 |
Present |
Present |
C2H4O+ |
Ethylene oxide sub-unit from PEG |
| 58.03 |
Present |
Present |
C2H4NO+ |
Aminoethyl tail from PEG-diamine |
| 87.05 |
Present |
Present |
C2H7NO2+ |
|
| 162.04 |
Present |
Present |
C6H4N5O− |
Pteridine from folic acid |
| 176.04 |
Present |
Present |
C7H6N5O− |
Pteridine from folic acid |
| 295.13 |
Present |
Present |
C22H16O+ |
|
| 295.14 |
Present |
Present |
C19H19O3+ |
|
| 71.99 |
Absent |
Present |
CSN2+/C2H2NS+ |
Thiourea |
| 138.95 |
Absent |
Present |
SiH5SNO2+ |
|
| 139.95 |
Absent |
Present |
S2N3O2H2+ |
|
Labeling results
After incubation with SiC nanoparticles and fixation onto glass slides, cells were observed with a multiphoton microscope. Nile Red was used to stain cells and help to localize them. With a 790 nm excitation, Nile Red emits a TPEF signal at 607 nm and SiC nanoparticles emit strong SHG at 395 nm. To evaluate labeling efficiency, 3T3-L1 cells were used as healthy cells and HuH7 cells as cancer cells. HuH7 cells are known to interact strongly with folic acid and folate derivatives,47 and can therefore be used as a cancer model with positive response to folate-modified probes for diagnosis or therapy. The SHG signal coming from SiC nanoparticles and the TPEF signal coming from Nile Red dye were superimposed on microscopy images (Fig. 7). On the one hand, many folate-modified SiC nanoparticles were identified in and around cancer HuH7 cells observed as blue-purple SHG spots (Fig. 7A). On the other hand, only very few SHG spots were observed on healthy cells (Fig. 7B). To quantify the labeling specificity of the folate-modified nanoparticles, 3 negative controls were used: folate-modified SiC nanoparticles on healthy cells, PEG-modified SiC nanoparticles on cancer cells, and a competition assay (folate-modified SiC nanoparticles on cancer cells in presence of free-folic acid in the culture medium) as previously shown in Table 1. Then, counts were made using about 10 different image fields for each assay; percentage SHG-emitting area on cells was measured on the corresponding images. This methodology discriminated highly from poorly labeled cells. In contrast, simple labeled/unlabeled quantification did not distinguish between poorly and highly labeled cells. Indeed, even negative controls can present a few SHG spots, due to non-specific interaction between cells and nanoparticles. The average labeling percentage for HuH7 cells was about 48% whilst healthy 3T3-L1 cells presented a significantly lower rate of about 10% (p < 0.0001, Student's test), as shown in Fig. 8. The specificity of the labeling and the impact of folic acid were also evaluated with a competition assay and PEGylated SiC nanoparticles. These two additional negative controls provided quite similar results, with 13% and 15% labeling, respectively, significantly lower (p < 0.0001) than the labeling percentage of folate-modified SiC nanoparticles on HuH7 cells. These results indicate the high efficiency of these folate-modified SiC nanoparticles for cancer-cell-specific labeling. Furthermore, no effect of the nanoparticles was observed on healthy cell proliferation, suggesting that SiC nanoparticles have low cytotoxicity (see ESI, Fig. S6†). Finally, we compared our results to the other studies related to SHG-emitting nanoparticles for bio-imaging found in the literature. To our knowledge, there are still only very few papers dealing with the use of SHG-emitting nanoparticles for bio-imaging and therapeutic applications, as summarized in Table S1 in ESI.† SiC exhibits one of the highest nonlinear coefficients of all SHG-emitting materials. Combined with low cytotoxicity and a surface that is easy to modify with silane chemistry, SiC nanoparticles are promising candidates for specific cell labeling that could be applied in histological diagnosis of cancer based on patient biopsy.
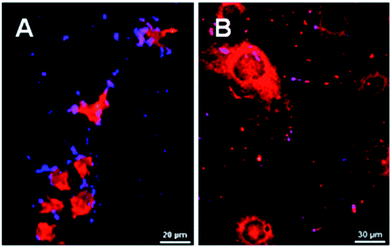 |
| | Fig. 7 Multiphoton images of HuH7 cancer cells (A) and 3T3-L1 healthy cells (B) after incubation with folate-modified SiC nanoparticles. Blue-purple spots correspond to SHG signal measured at 395 nm and red spots correspond to TPEF signal measured at 607 nm. Excitation wavelength is 790 nm. | |
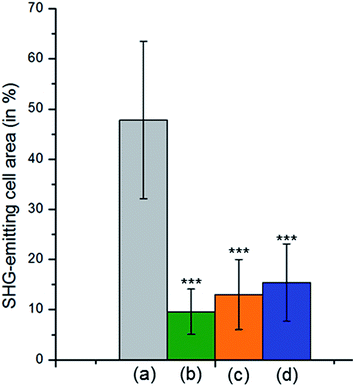 |
| | Fig. 8 Evaluation of SHG-emitting cell area for HuH7 cells with folate-modified SiC nanoparticles (a), 3T3-L1 cells with folate-modified SiC nanoparticles (b), competition assay for HuH7 cells with folate-modified SiC nanoparticles (c) and HuH7 cells with PEG-modified SiC nanoparticles (d), Student's t test: ***p < 0.0001. | |
Conclusions
In this paper, SHG-emitting SiC nanoparticles were biofunctionalized for cancer imaging purposes. The isothiocyanate-based chemistry allowed simple coupling between amino-modified SiC nanoparticles and folic acid. The success of the different functionalization steps was shown by zeta potential measurement, colorimetric titration, infrared and UV-visible absorption spectroscopy, XPS and ToF-SIMS. Finally, the cancer-specific labeling efficiency of folate-modified SiC nanoparticles was demonstrated by measurement of the SHG-emitting cell area. Compared to other NLO nanoprobes, SiC nanoparticles offer the advantage of being a biocompatible material. Combined with a strong SHG signal that can be excited in the near-infrared region and the cancer-labeling specificity demonstrated in this study, PEG-folate-modified SiC nanoparticles can be seriously considered as effective cancer-specific labels for multiphoton imaging of biopsy samples.
Acknowledgements
This work was supported by LABEX iMUST (ANR-10-LABX-0064) of Lyon University, as part of the "Investissements d'Avenir" program (ANR-11-IDEX-0007) of the French National Research Agency (ANR). The European Union INTERREG V France-Suisse program (NANOFIMT project) is also acknowledged for financial support. V. M. and L. B. acknowledge PHC Germaine de Staël 2015 for the funding of experimental campaigns. V. K. and L. B. acknowledge financial support from the Swiss SEFRI (project C15.0041, Multi Harmonic Nanoparticles).
References
- L. Fass, Mol. Oncol., 2008, 2, 115–152 CrossRef PubMed.
- U. Resch-Genger, M. Grabolle, S. Cavaliere-Jaricot, R. Nitschke and T. Nann, Nat. Methods, 2008, 5, 763–775 CrossRef CAS PubMed.
- J. Lin, F. Lu, W. Zheng, S. Xu, D. Tai, H. Yu and Z. Huang, J. Biomed. Opt., 2011, 16, 116024 Search PubMed.
- W. Hu, G. Zhao, C. Wang, J. Zhang and L. Fu, PLoS One, 2012, 7, 37962 Search PubMed.
- N. J. Durr, T. Larson, D. K. Smith, B. A. Korgel, K. Sokolov and A. Ben-Yakar, Nano Lett., 2007, 7, 941–945 CrossRef CAS PubMed.
- G. Peleg, A. Lewis, M. Linial and L. M. Loew, Proc. Natl. Acad. Sci. U. S. A., 1999, 96, 6700–6704 CrossRef CAS.
- Y. Nakayama, P. J. Pauzauskie, A. Radenovic, R. M. Onorato, R. J. Saykally, J. Liphardt and P. Yang, Nature, 2007, 447, 1098–1102 CrossRef CAS PubMed.
- A. V. Kachynski, A. N. Kuzmin, M. Nyk, I. Roy and P. N. Prasad, J. Phys. Chem. C, 2008, 112, 10721–10724 CAS.
- P. Pantazis, J. Maloney, D. Wu and S. E. Fraser, Proc. Natl. Acad. Sci. U. S. A., 2010, 107, 14535–14540 CrossRef CAS PubMed.
- C. L. Hsieh, R. Grange, Y. Pu and D. Psaltis, Opt. Express, 2009, 17, 2880–2891 CrossRef CAS PubMed.
- D. Staedler, T. Magouroux, R. Hadji, C. Joulaud, J. Extermann, S. Schwung, S. Passemard, C. Kasparian, G. Clarke, M. Gerrmann, R. Le Dantec, Y. Mugnier, D. Rytz, D. Ciepielewski, C. Galez, S. Gerber-Lemaire, L. Juillerat-Jeanneret, L. Bonacina and J. P. Wolf, ACS Nano, 2012, 6, 2542–2549 CrossRef CAS PubMed.
- L. Bonacina, Mol. Pharm., 2013, 10, 783–792 CrossRef CAS PubMed.
- C. L. Hsieh, R. Grange, Y. Pu and D. Psaltis, Biomaterials, 2010, 31, 2272–2277 CrossRef CAS PubMed.
- R. Ladj, T. Magouroux, M. Eissa, M. Dubled, Y. Mugnier, R. Le Dantec, C. Galez, J. P. Valour, H. Fessi and A. Elaissari, Colloids Surf., A, 2013, 439, 131–137 CrossRef CAS.
- L. J. Richter, A. Steinbrück, M. Zilk, A. Sergeyev, T. Pertsch, A. Tünnermann and R. Grange, Nanoscale, 2014, 6, 5200–5207 RSC.
- W. P. Dempsey, S. E. Fraser and P. Pantazis, BioEssays, 2012, 34, 351–360 CrossRef CAS PubMed.
- Y. Pu, R. Grange, C. L. Hsieh and D. Psaltis, Phys. Rev. Lett., 2010, 104, 207402 CrossRef PubMed.
- E. Kim, A. Steinbrück, M. T. Buscaglia, V. Buscaglia, T. Pertsch and R. Grange, ACS Nano, 2013, 7, 5343–5349 CrossRef CAS PubMed.
- S. Passemard, D. Staedler, G. Sonego, T. Magouroux, G. S. Schneiter, L. Juillerat-Jeanneret, L. Bonacina and S. Gerber-Lemaire, J. Nanopart. Res., 2015, 17, 414 CrossRef.
- A. Rogov, I. Tishchenko, C. Joulaud, A. Pastushenko, Y. Ryabchikov, A. Kyrychenko, D. Mishchuk, A. Kahrin, V. Timoshenko, Y. Mugnier, R. Le Dantec, A. Geloen, J. P. Wolf, V. Lysenko and L. Bonacina, Proc. SPIE, 2016, 9722, 972213 CrossRef.
- Y. Zakharko, T. Nychyporuk, L. Bonacina, M. Lemiti and V. Lysenko, Nanotechnology, 2013, 24, 55703 CrossRef CAS PubMed.
- S. Barillet, M. L. Jugan, M. Laye, Y. Leconte, N. Herlin-Boime, C. Reynaud and M. Carrière, Toxicol. Lett., 2010, 198, 324–330 CrossRef CAS PubMed.
- J. Pourchez, D. Boudard, V. Forest, N. Boumahdi, M. Tomatis, B. Fubini, B. Guilhot, M. Cottier and P. Grosseau, J. Nanopart. Res., 2014, 14, 1143 CrossRef.
- J. Botsoa, V. Lysenko, A. Géloën, O. Marty, J. M. Bluet and G. Guillot, Appl. Phys. Lett., 2008, 92, 173902 CrossRef.
- M. Bazzar, M. Ghaemy and R. Alizadeh, Polym. Degrad. Stabil., 2012, 97, 1690–1703 CrossRef CAS.
- A. Oliveros, C. L. Frewin, S. J. Schoell, M. Hoeb, M. Stutzmann, I. D. Sharp and S. E. Saddow, J. Mater. Res., 2012, 28, 78–86 CrossRef.
- M. Iijima and H. Kamiya, J. Phys. Chem. C, 2008, 112, 11786–11790 CAS.
- A. Kassiba, W. Bednarski, A. Pud, N. Errien, L. Laskowski, M. Tabellout, S. Kodjikian, K. Fatyeyeva, N. Ogurtsov and Y. Noskov, J. Phys. Chem. C, 2007, 111, 11544–11551 CAS.
- P. Mavinakuli, S. Wei, Q. Wang, A. B. Karki, S. Dhage, Z. Wang, D. P. Young and Z. Guo, J. Phys. Chem. C, 2010, 114, 3874–3882 CAS.
- W. R. Zipfel, R. M. Williams and W. W. Webb, Nat. Biotechnol., 2003, 21, 1369–1377 CrossRef CAS PubMed.
- C. Schmidt, J. Riporto, A. Uldry, A. Rogov, Y. Mugnier, R. Le Dantec, J.-P. Wolf and L. Bonacina, Sci. Rep., 2016, 6, 25415 CrossRef CAS PubMed.
- A. Rogov, M. Irondelle, F. Ramos Gomes, J. Bode, D. Staedler, S. Passemard, S. Courvoisier, Y. Yamamoto, F. Waharte, D. Ciepielewski, P. Rideau, S. Gerber-Lemaire, F. Alves, J. Salamero, L. Bonacina and J.-P. Wolf, ACS Photonics, 2015, 2, 1416–1422 CrossRef CAS.
- N. Parker, M. J. Turk, E. Westrick, J. D. Lewis, P. S. Low and C. P. Leamon, Anal. Biochem., 2005, 338, 284–293 CrossRef CAS PubMed.
- R. J. Lee and S. Philip, J. Biol. Chem., 1994, 269, 3198–3204 CAS.
- G. Coussot, E. Nicol, A. Commeyras, I. Desvignes, R. Pascal and O. Vandenabeele-Trambouze, Polym. Int., 2009, 58, 511–518 CrossRef CAS.
- S. A. Alekseev, V. N. Zaitsev, J. Botsoa and D. Barbier, Chem. Mater., 2007, 255, 2189–2194 CrossRef.
- J. He, X. Xu, J. S. Corneille and D. W. Goodman, Surf. Sci., 1992, 279, 119–126 CrossRef CAS.
- H. Min, P.-L. Girard-Lauriault, T. Gross, A. Lippitz, P. Dietrich and W. E. S. Unger, Anal. Bioanal. Chem., 2012, 403, 613–623 CrossRef CAS PubMed.
- A. P. Dementjev, A. De Graaf, M. C. M. Van De Sanden and K. I. Maslakov, Diamond Relat. Mater., 2000, 9, 1904–1907 CrossRef CAS.
- L. F. de Oliveira, K. Bouchmella, K. d. A. Gonçalves, J. Bettini, J. Kobarg and M. B. Cardoso, Langmuir, 2016, 32, 3217–3225 CrossRef CAS PubMed.
- K. Kaaki, K. Hervé-Aubert, M. Chiper, A. Shkilnyy, M. Soucé, R. Benoit, A. Paillard, P. Dubois, M. L. Saboungi and I. Chourpa, Langmuir, 2012, 28, 1496–1505 CrossRef CAS PubMed.
- Y. Zhang, N. Kohler and M. Zhang, Biomaterials, 2002, 23, 1553–1561 CrossRef CAS PubMed.
- C. Rao and R. Venkataraghavan, Spectrochim. Acta, 1962, 18, 541–547 CrossRef CAS.
- M. Frasconi, R. Marotta, L. Markey, K. Flavin, V. Spampinato, G. Ceccone, L. Echegoyen, E. M. Scanlan and S. Giordani, Chem.–Eur. J., 2015, 21, 19071–19080 CrossRef CAS PubMed.
- T. J. Chen, T. H. Cheng, Y. C. Hung, K. T. Lin, G. C. Liu and Y. M. Wang, J. Biomed. Mater. Res., Part A, 2008, 87, 165–175 CrossRef PubMed.
- O. Aronov, A. T. Horowitz, A. Gabizon and D. Gibson, Bioconjugate Chem., 2003, 14, 563–574 CrossRef CAS PubMed.
- R. Zhao, M. Hanscom and I. D. Goldman, Biochim. Biophys. Acta, Biomembr., 2005, 1715, 57–64 CrossRef CAS PubMed.
Footnote |
| † Electronic supplementary information (ESI) available: Detailed procedure for colorimetric amine titration, toxicity assay, XPS and ToF-SIMS analyses. Transmission electron microscopy (TEM) image, X-ray diffractogram and SHG emission spectra of KOH-treated SiC nanoparticles. Full infrared spectra of Fig. 1. N 1s level XPS spectrum of APTES-2 modified SiC nanoparticles. 1H NMR spectrum of PEG-folate. Multiphoton images of HuH7 cancer cells with negative controls. Cell proliferation of 3T3-L1 healthy cells in presence of various SiC nanoparticle concentrations. Comparison of SHG-emitting nanoparticles used for bio-imaging and therapy in the literature. See DOI: 10.1039/c7ra03961a |
|
| This journal is © The Royal Society of Chemistry 2017 |
Click here to see how this site uses Cookies. View our privacy policy here.  Open Access Article
 c,
G. Cecconed,
A. Jaffal
 a,
C. Schmidtb,
S. Alekseev
 e,
V. Lysenkof,
J. P. Wolfb,
L. Bonacinab,
E. Souteyranda,
Y. Chevolota and
V. Monnier
 *a
*a

![[double bond, length as m-dash]](https://www.rsc.org/images/entities/char_e001.gif) O stretching vibration at 1645 cm−1 and N–H bending vibration at 1605 cm−1, coming from amide groups, can be observed in both Fig. 3a and c. Additionally, in Fig. 3c, the characteristic peaks coming from PEG (Fig. 3b) can also be identified, such as C–H stretching at 2880 cm−1, C–H bending at 1460 cm−1 and 1342 cm−1 and C–O stretching at 1107 cm−1. These peaks confirmed the successful grafting of folic acid on PEG-diamine. Furthermore, on the 1H NMR spectrum of PEG-folate (Fig. S4†), typical protons of folic acid were also observed (400 MHz, D2O, δ in ppm): 3.5–3.66 ppm (m, 276H), 3.72 ppm (t, 2H), 4.74 ppm (s, 1H), 6.76 ppm (t, 1.3H), 7.61 ppm (t, 1.3H) and 8.71 ppm (d, 0.6H).
O stretching vibration at 1645 cm−1 and N–H bending vibration at 1605 cm−1, coming from amide groups, can be observed in both Fig. 3a and c. Additionally, in Fig. 3c, the characteristic peaks coming from PEG (Fig. 3b) can also be identified, such as C–H stretching at 2880 cm−1, C–H bending at 1460 cm−1 and 1342 cm−1 and C–O stretching at 1107 cm−1. These peaks confirmed the successful grafting of folic acid on PEG-diamine. Furthermore, on the 1H NMR spectrum of PEG-folate (Fig. S4†), typical protons of folic acid were also observed (400 MHz, D2O, δ in ppm): 3.5–3.66 ppm (m, 276H), 3.72 ppm (t, 2H), 4.74 ppm (s, 1H), 6.76 ppm (t, 1.3H), 7.61 ppm (t, 1.3H) and 8.71 ppm (d, 0.6H).
![[double bond, length as m-dash]](https://www.rsc.org/images/entities/char_e001.gif) O stretching vibration from carbonyl functions of folic acid, while the 1107 cm−1 peak was associated with C–O stretching vibration from ether bonds of PEG.40–42 This peak can also be attributed, to a lesser extent, to stretching vibration of thiocarbonyl functions,43 which are generally localized close to 1100 cm−1. The presence of ether bonds from PEG was also confirmed by the C 1s level XPS spectrum of PEG-folate (Fig. 5A). The two lowest energy peaks (284.99 and 286.61 eV) can be attributed to C–C and C–O bonds, respectively. In particular, the 286.61 eV peak was very intense and could be used to characterize the presence of ether bonds on folate-modified SiC nanoparticles.44 This peak was also observed on C 1s level XPS spectrum of folate-modified SiC nanoparticles at 286.56 eV (Fig. 5C). Its intensity reached 48% of the total signal measured for C 1s level, compared to only 26% for APTES-2 modified SiC nanoparticles (Fig. 5B), confirming the success of PEG-folate grafting. Finally, the peak observed around 287.9 eV (287.99 eV for PEG-folate and 287.94 eV for folate-modified SiC nanoparticles) is characteristic of amide bonds and also indicates the presence of PEG-folate on SiC nanoparticles. PEG-folate also showed strong absorption in the UV-Vis region, due to folic acid (Fig. 6a). APTES-2 modified SiC nanoparticles exhibited a continuous scattering background in the UV-Vis range (Fig. 6c). This signal was subtracted from the spectrum of folate-modified nanoparticles (Fig. 6b, inset), after which a band at 285 nm was clearly obtained for folate-modified nanoparticles, corresponding to that of folic acid (Fig. 6a).45,46 ToF-SIMS analyses of pure PEG-folate and folate-modified SiC nanoparticles are summarized in Table 5. Concerning PEG-folate, the fragments with m/z equal to 162.04 and 176.04 are of particular interest, since they can easily be attributed to the pteridine cycle of folic acid. In addition, fragments at 44.04 and 58.03 can be attributed respectively to ethylene oxide sub-units of PEG-diamine and aminoethyl tails of PEG-diamine. These peaks were also present for folate-modified SiC nanoparticles. In addition, ToF-SIMS detected fragments containing sulfur, and notably a fragment with m/z = 71.99, which can be attributed to the thiourea groups which may indicate covalent binding between PEG-folate and SiC nanoparticles.
O stretching vibration from carbonyl functions of folic acid, while the 1107 cm−1 peak was associated with C–O stretching vibration from ether bonds of PEG.40–42 This peak can also be attributed, to a lesser extent, to stretching vibration of thiocarbonyl functions,43 which are generally localized close to 1100 cm−1. The presence of ether bonds from PEG was also confirmed by the C 1s level XPS spectrum of PEG-folate (Fig. 5A). The two lowest energy peaks (284.99 and 286.61 eV) can be attributed to C–C and C–O bonds, respectively. In particular, the 286.61 eV peak was very intense and could be used to characterize the presence of ether bonds on folate-modified SiC nanoparticles.44 This peak was also observed on C 1s level XPS spectrum of folate-modified SiC nanoparticles at 286.56 eV (Fig. 5C). Its intensity reached 48% of the total signal measured for C 1s level, compared to only 26% for APTES-2 modified SiC nanoparticles (Fig. 5B), confirming the success of PEG-folate grafting. Finally, the peak observed around 287.9 eV (287.99 eV for PEG-folate and 287.94 eV for folate-modified SiC nanoparticles) is characteristic of amide bonds and also indicates the presence of PEG-folate on SiC nanoparticles. PEG-folate also showed strong absorption in the UV-Vis region, due to folic acid (Fig. 6a). APTES-2 modified SiC nanoparticles exhibited a continuous scattering background in the UV-Vis range (Fig. 6c). This signal was subtracted from the spectrum of folate-modified nanoparticles (Fig. 6b, inset), after which a band at 285 nm was clearly obtained for folate-modified nanoparticles, corresponding to that of folic acid (Fig. 6a).45,46 ToF-SIMS analyses of pure PEG-folate and folate-modified SiC nanoparticles are summarized in Table 5. Concerning PEG-folate, the fragments with m/z equal to 162.04 and 176.04 are of particular interest, since they can easily be attributed to the pteridine cycle of folic acid. In addition, fragments at 44.04 and 58.03 can be attributed respectively to ethylene oxide sub-units of PEG-diamine and aminoethyl tails of PEG-diamine. These peaks were also present for folate-modified SiC nanoparticles. In addition, ToF-SIMS detected fragments containing sulfur, and notably a fragment with m/z = 71.99, which can be attributed to the thiourea groups which may indicate covalent binding between PEG-folate and SiC nanoparticles.


