 Open Access Article
Creative Commons Attribution 3.0 Unported Licence
One-pot synthesis of an AgBr/ZnO hierarchical structure with enhanced photocatalytic capacity
Shengnan Liua,
Min Zhengb,
Rui Chena and
Zuoshan Wang *a
*a
aCollege of Chemistry, Chemical Engineering and Materials Science, Soochow University, Soochow, 215123, China. E-mail: zuoshanwang@suda.edu.cn; Fax: +86-0512-85187680; Tel: +86-0512-85187680
bCollege of Textile and Clothing Engineering, Soochow University, Soochow, 215123, China
First published on 16th June 2017
Abstract
Hydrangea-like silver bromide/zinc oxide (AgBr/ZnO) photocatalysts were first synthesized using a one-pot, wet chemical method, and were composed of a ZnO hierarchical structure and AgBr nanoparticles (NPs). The as-synthesized AgBr/ZnO composites were characterized using X-ray diffraction (XRD), scanning electron microscopy (SEM), transmission electron microscopy (TEM) and energy dispersive spectrometry (EDS) mapping analysis. The experimental results suggested that the AgBr NPs were uniformly decorated on the surface of the self-assembled ZnO hierarchical structure. It was found that poly vinyl pyrrolidone (PVP) and triethanolamine (TEOA) played important roles in the formation of the AgBr/ZnO hydrangea-like structure. The photocatalytic performance of AgBr/ZnO composites was then investigated using the degradation of rhodamine B under visible light irradiation. AgBr/ZnO composites exhibited better photocatalytic properties than pristine ZnO and AgBr, and the composite with 30% AgBr showed the best photocatalytic activity. The enhanced catalytic properties were attributed to the synergistic effects of the hierarchical hydrangea like structures, AgBr/ZnO heterojunction and metallic silver generated during the photocatalytic process. Therefore, the hydrangea-like AgBr/ZnO could act as a potential photocatalyst for environmental treatment and energy conversion.
1. Introduction
In recent years, photocatalytic degradation of contaminants or microorganisms has received worldwide interest because this method can convert solar energy to chemical energy without pollution.1 Under the action of photocatalysts, dyes can be decomposed into water (H2O), carbon dioxide and nontoxic organic matter with a simple structure.2–4 Among the diverse catalysts, semiconductor materials possess the potentially green and cost-effective approach to address difficult problems regarding photodegradation.5,6Zinc oxide (ZnO) is an important semiconductor and has found wide applications, as luminescent materials,7 in electrical and photoelectronic devices,8,9 in chemical sensors10 and in the photocatalysis field.11 It has been well established that ZnO shows good photocatalytic activity for the degradation of organic pollutants because of its particular electronic structure, diversiform morphologies, easy fabrication and low cost.12 Nonetheless, the application of ZnO as a photocatalyst suffers several obvious drawbacks: firstly, ZnO can just respond to the ultraviolet (UV) part of sunlight for its wide optical bandgap of about 3.37 eV and as is known, UV light just accounts for 5–7% of the solar spectrum. To expand its light responsive range, it is necessary to study the modified ZnO. Secondly, the rapid recombination rate of photogenerated electron–hole pairs cannot be ignored. To improve its inferior photon response, coupling ZnO with a narrow band gap material to form a heterostructure is a good option.13–17
Silver bromide (AgBr) is a visible light sensitive material with band gap of about 2.64 eV and has been used to improve the spectral response range of ZnO.18–20 For example, Lu et al. synthesized a rod-like AgBr/ZnO composite using a hydrothermal method and the composite showed enhanced photocatalytic activity compared to pure ZnO or AgBr particles.18 Shi et al. employed a deposition–precipitation method to obtain a rod-like AgBr/ZnO heterostructure, which had favorable photocatalytic activity for the degradation of rhodamine B (RhB).19 Wu et al. synthesized AgBr/ZnO nanowires using a two-stage process consisting a solvothermal route followed by chemical precipitation.20 The photocatalytic studies revealed that the composites could improve the photocatalytic activity compared to pure ZnO. The previously mentioned preparation techniques either had multi-step processes or a high reaction temperature and long processing time, which more or less led to increased cost. For practical applications, a simplified preparation of AgBr/ZnO hybrid is desired. However, the impact of the morphological structure of catalysts cannot be ignored in the process of photocatalysis. Recently, various morphologies of AgBr/ZnO materials have been prepared, such as rod-like morphology,18 hexagonal structures21 and a shuttle-like shape.22 The advantages of three-dimensional hierarchically assembled nanoplatelets or nanoparticles (NPs) include not only the high surface area for effective loading, but also the structural stability and dispersity compared to one-dimensional nanowires and zero-dimensional NP structures.23
In considering the previously mentioned aspects, hydrangea like AgBr/ZnO composites with hierarchical structure have been synthesized using a one-pot wet chemical method for the first time. They consisted of dense ZnO nanorods (NRs) covered by AgBr NRs. Furthermore, the typical AgBr/ZnO composites showed a higher photocatalytic property when degrading RhB under visible light irradiation, compared to a similar degradation using pure AgBr and ZnO. In addition, a possible degradation mechanism is suggested. It is believed that the proposed method could provide ideas for the preparation of new semiconductor composites.
2. Experimental section
2.1 Materials
In our study, all the chemicals were analytical grade supplied by Sinopharm Chemicals and used without any other purification.2.2 Synthesis of samples
The hydrangea like AgBr/ZnO nanocomposites were prepared using a wet chemical method. Firstly, 0.1 g of PVP (MW = 58 000) was dissolved in 40 mL of deionized water with vigorous stirring in a 250 mL beaker. Next, 1.49 g of zinc nitrate hexahydrate (Zn(NO3)2·6H2O) was added to the mixture. Then, 30 mL of silver nitrate (AgNO3) and 30 mL of potassium bromide (KBr) aqueous solutions were added dropwise into the mixture at the same time under continuous stirring. The concentrations of AgNO3 and KBr were kept consistent in each of the four groups which were 16.7 mM, 33.4 mM, 50.1 mM, and 66.8 mM and the corresponding products were denoted as AZ-1, AZ-2, AZ-3, AZ-4, respectively. That meant that the mole fractions of AgBr to ZnO were 10%, 20%, 30% and 40%. Afterwards, 32.5 mL of triethanolamine (TEOA; 2.91 M) was added dropwise into the suspension. Finally, a water bath heating treatment was carried out at 90 °C for 3 h and then cooled down naturally to an ambient temperature afterwards. The samples obtained were centrifuged and the precipitates were cleaned repeatedly with deionized water and absolute alcohol. The precipitates were dried in a vacuum oven at 60 °C for 8 h. The pure ZnO and AgBr were obtained under the same conditions.2.3 Characterization of the samples
With the use of Cu-Kα radiation, X-ray diffraction (XRD) patterns were obtained to identify the crystalline phase of the resultant products. A Hitachi S4800 scanning electron microscope (SEM) was used to obtain the SEM images and the elemental analysis of the products was performed using energy dispersive spectrometry mapping analysis (EDX). Further structural characterization was conducted using a Hitachi H600A transmission electron microscope (TEM) and high-resolution transmission electron microscopy (HRTEM). The specific surface areas of the samples were obtained from nitrogen (N2) adsorption–desorption isotherms using a Micromeritics TriStar 3020 system. The ultraviolet-visible (UV-vis) diffuse reflectance spectra were revealed using a Shimadzu UV-3600 UV-vis-near infrared spectrophotometer. The photoluminescence (PL) spectra were obtained using a Varian Cary Eclipse fluorescence spectrometer with an excitation wavelength of 247 nm. X-ray photoelectron spectrometry (XPS) was performed using Thermo Fisher Scientific ESCALAB 250 and the results obtained were applied to evaluate the elemental composition of the samples.2.4 Photocatalytic properties
The photocatalytic properties of products were estimated by degrading RhB. The experiments were implemented in a 100 mL reactor with a 500 W xenon lamp as the visible light source. In the course of the test, a total of 0.1 g of the sample was blended with 100 mL of RhB aqueous solution (10 mg L−1). Before the illumination, the suspensions were kept in darkness for 30 min to attain the absorption equilibrium state. Once the irradiation started, 4 mL of the mixture was removed with a syringe for the every 20 min. Next, the UV-vis spectrophotometer was used to analyse the products. According to the formula η = C/C0, in which C0 indicates the concentration of the original RhB solution and the C is the concentration of RhB solution at a different reaction time. Therefore, the degradation curves and rates of the RhB solution were obtained. The stability of the catalyst was also investigated using circulation experiments.2.5 Trapping experiment of the active species
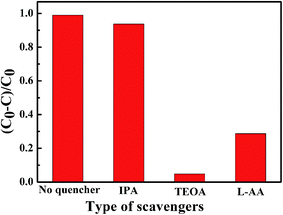
TEOA (5 mM), isopropanol (IPA) and ascorbic acid (L-AA) were added to the RhB solution as scavengers of h+, ˙OH and ˙O2−, respectively. Then the concentration of RhB was measured after illumination for 100 min. The degradation percentages of RhB solution were calculated using the formula (C0 − C)/C0.3. Results and discussion
3.1 Structure and morphology
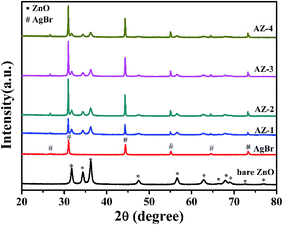
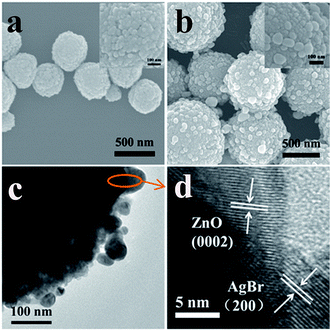
Fig. 1 shows the XRD patterns of the products. For pure ZnO, all the diffraction peaks can be well indexed by the wurtzite hexagonal crystalline phase (JCPDS no. 36-1451). The diffraction peaks of AgBr match well with cubic structure AgBr (JCPDS no. 79-0148). When ZnO was decorated with AgBr NPs, the XRD patterns for the composites displayed diffraction peaks which agreed well with those of AgBr and ZnO. It can be noted that the intensity of the diffraction peaks of ZnO is gradually decreased and the intensity of the diffraction peaks corresponding to AgBr strengthen with the increase of AgBr content on the surface. Furthermore, there is no other impurity diffraction peaks, such as Ag0. This indicates that the AgBr does not decompose into other substances, when the compound photocatalyst is prepared.Fig. 2a and b display SEM images of pure ZnO and AgBr/ZnO samples, respectively. As shown in Fig. 2a, pure ZnO has a spherical shape with a diameter of about 300–800 nm. A magnified SEM image of pure ZnO is given in the inset of Fig. 2a. It can be seen that they are assembled of small NPs with sizes ranging from about 20 nm to 50 nm. The SEM image of the AgBr/ZnO composite (Fig. 2b) indicates the existence of AgBr NPs bonded to the surface of ZnO, forming a hierarchical hydrangea like structure similar to pure ZnO. However, the surface of the AgBr/ZnO composites can be rougher than that of ZnO because of the attachment of the AgBr NPs. Based on the magnified SEM image (Fig. 2b, inset), it can be estimated that the AgBr NPs are ∼60 nm in diameter, and from the SEM images, it is clearly observed that the hierarchical hydrangea like structure has good dispersibility.
To further structurally characterize the products, TEM measurements were performed. Fig. 2c shows typical TEM images of the AgBr/ZnO heterojunction, which is consistent with the SEM results (Fig. 2b). Fig. 2d shows the HRTEM image of the AgBr/ZnO composite selected from the Fig. 2c. It has interplanar distances of 0.261 nm, corresponding to the (0002) plane of a wurtzite hexagonal ZnO, and 0.289 nm which agrees well with the (200) plane of the crystalline AgBr with a cubic structure. Apparently, the (0002) facet of ZnO was connected with the (200) facet of AgBr at a particular angle, indicating the formation of heterojunctions.
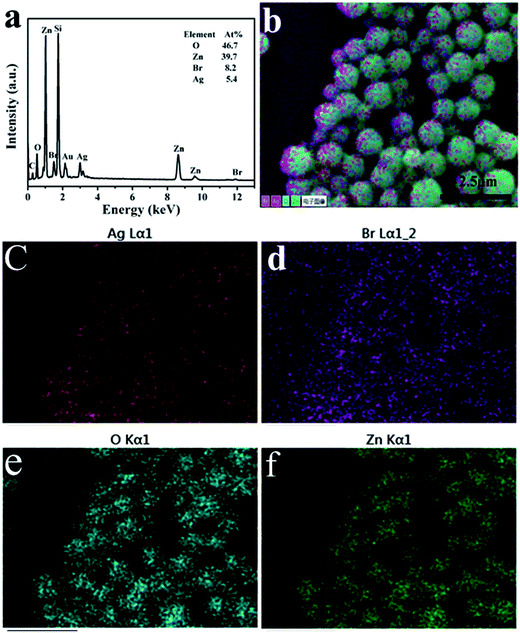
The EDX spectrum for the AZ-3 sample is shown in Fig. 3a. The peaks are ascribed to Ag, Br, O, and Zn elements. Furthermore, EDX mapping was applied to examine the distribution of the elements in the AZ-3 sample, as illustrated in Fig. 3b–f. It was observed that the AgBr NPs were homogeneously attached on the surface of ZnO.
The specific surface area and pore distribution of samples were studied using a N2 adsorption–desorption isotherm test. As shown in Fig. 4a, both pure ZnO and AZ-3 exhibit type IV-like isotherms with hysteresis loops. The Brunauer–Emmett–Teller (BET) surface areas of pure ZnO and AZ-3 were determined to be 14.40 m2 g−1 and 14.30 m2 g−1, respectively, which were higher than those of traditional ZnO materials which were approximately 4–5 m2 g−1.24 The increased surface areas can provide more active sites to improve the photocatalytic efficiency. The pore size distribution of the samples was also obtained. As shown in Fig. 4b, both ZnO and AZ-3 have similar pore distribution with major pores which range in size from 8 to 30 nm and minor ones of 2 nm. The formation of the porous structure of ZnO or AgBr/ZnO can be attributed to the agglomeration interspace among the NPs.
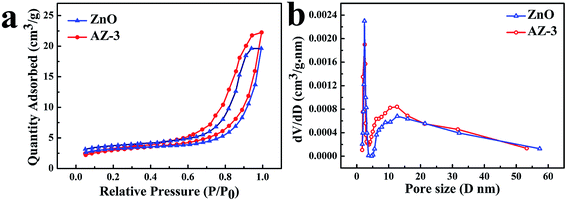 | ||
| Fig. 4 (a) N2 adsorption–desorption isotherms and (b) corresponding pore size distributions of pure ZnO and AZ-3. | ||
3.2 The mechanism analysis of AgBr/ZnO hierarchical structure
Based on the experimental results, a possible route of formation of the AgBr/ZnO heterojunction is proposed, as shown in Fig. 5. The reaction steps in aqueous solution can be summarized as follows:| Ag+ + Br− → AgBr | (1) |
| Zn2+ + TEOA → [ZnTEOA]2+ | (2) |
| [ZnTEOA]2+ + H2O → Zn(OH)2 + HTEOA+ | (3) |
| Zn(OH)2 + TEOA → [Zn(OH)2TEOA] | (4) |
| [Zn(OH)2TEOA] + H2O → [Zn(OH)4]2− + HTEOA+ | (5) |
| [Zn(OH)4]2− → ZnO + H2O + 2OH− | (6) |
At first, colloidal AgBr NPs are rapidly formed after the mixing between AgNO3 and KBr aqueous solutions [Fig. 5A and eqn (1)]. In this process, PVP plays the role of steric stabilizer or capping agent: and the nitrogen atoms of the PVP can coordinate with the Ag ions of AgBr to form a complex, and thereby prevent the NPs from conglomerating.25 Descriptions of this phenomenon can also be found in previous reports.26–28 It should be noted that colloidal AgBr NPs do not serve as cores during the formation process although they are formed first. This could be attributed to the steric hindrance effect of PVP, which has a high MW and long carbon chain compared to TEOA.29 When the ZnO NPs surround the AgBr NPs, the steric hindrance effect shields the AgBr NPs from further nucleation. Therefore, AgBr NPs wrapped with PVP are crowded outside the ZnO self-assembled spheres.
With the introduction of TEOA, Zn2+ will be coordinated by TEOA via N to form a [ZnTEOA]2+ complex [eqn (2)]. As the temperature increases, lots of hydroxyl ions are formed by the hydrolysis of TEOA and then the complex is gradually hydrolyzed into [Zn(OH)4]2− [eqn (3)–(5)]. As shown in Fig. 5B, colloidal AgBr NPs exist stably with [Zn(OH)4]2− ionic groups. Next, ZnO NPs can be obtained by the dehydration of [Zn(OH)4]2− by heat treatment [Eq. (6)]. The formation of ZnO could break the previously metastable state of the AgBr colloid and induce AgBr NPs to precipitate on the surface of ZnO NPs (Fig. 5C). Subsequently, they come closer to each other (Fig. 5D) and then the hydroxyl groups of the TEOA rims absorbed on the ZnO NPs can interact with each other, which results in a linkage or bridging of the neighboring ZnO NPs. These NPs gradually grow and fit together in this way. Finally, the clusters assemble together into a hydrangea like aggregation (Fig. 5E). The proposed formation mechanism of AgBr/ZnO hierarchical structure shown by the TEM results in Fig. 5.
The effects of PVP (and TEOA) concentrations on the morphologies of the as-prepared products were also studied. Fig. 6a–d shows the influence of PVP concentrations on the morphologies of AZ-3. When the PVP contents varied from 0.05 g to 0.5 g, all the products exhibited similar hydrangea like structures, suggesting that the PVP content has hardly any influence on the morphologies of AZ-3. However, the morphologies of AZ-3 are strongly dependent on the TEOA concentration. As shown in Fig. 6e, when the concentration was 1.5 M, the surface of the products was porous. As the concentration increased up to 2.91 M (Fig. 6b) and 4.5 M (Fig. 6f), the pore size of the surface decreased to some extent. When the concentration was 6 M (Fig. 6g), some interesting things happened. It can be seen that the overall dimension of the spheres was reduced and the surface was much more porous. This phenomenon is reasonable as it is well known that ZnO is an amphoteric oxide, which can be dissolved in an acid or alkali environment. When the concentration of TEOA reached 6 M, the concentration of OH− and the alkalinity of the solution were high. Thus, the ZnO NPs were dissolved to a certain extent.
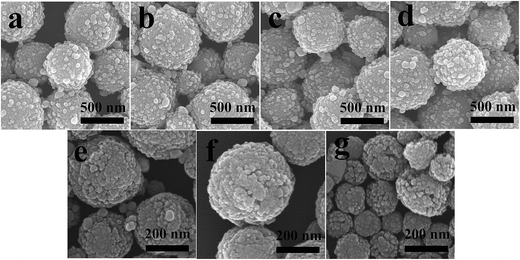 | ||
| Fig. 6 SEM images of AZ-3 samples prepared with different amounts of PVP: (a) 0.05 g, (b) 0.1 g, (c) 0.3 g, (d) 0.5 g and different concentrations of TEOA: (e) 1.5 M, (b) 2.91 M, (f) 4.5 M, (g) 6 M. | ||
3.3 Optical properties
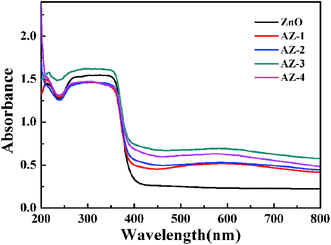
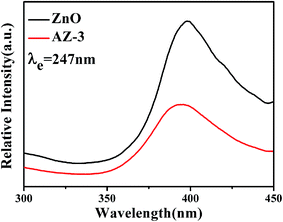
Under the light illumination, the UV-vis spectrum of the sample gives reasonable information about the degree of electron–hole pairs produced. The UV-vis absorption spectra of the synthetic photocatalysts are given in Fig. 7. As Fig. 7 shows, the absorption band of pristine ZnO is shorter than 400 nm, and the absorption bands of AgBr/ZnO samples resemble that of pure ZnO. Nevertheless, in the visible region, nanocomposites exhibit a broader and higher absorption, indicating that there is efficient absorption of the solar photons.The PL spectrum is an efficient method to explore the recombination behaviors of the photogenerated carriers of a material.19 Fig. 8 shows the PL spectrum of pure ZnO and AZ-3 with an excitation wavelength of 247 nm. With the AgBr attached on the surface of ZnO (AZ-3), the emission intensity significantly decreases, which indicates the hybridization of ZnO by AgBr can effectively inhibit the recombination of the photogenerated charge carriers and this is conducive to the photocatalytic reaction.
3.4 Photocatalytic activities
RhB was selected as a target contaminant to evaluate the photocatalytic performance of the AgBr/ZnO heterostructure. The results are displayed in Fig. 9a. It should be noted that visible light illumination in the absence of any photocatalyst or dark conditions with catalysts does not lead to the photolysis of RhB. Furthermore, after irradiation for 40 min, the amount of RhB decomposition was approximately 1.3%, 10.0%, 12.8%, 76.1%, 78.2%, 95.3% and 72.1% for blank sample, ZnO, AgBr, AZ-1, AZ-2, AZ-3 and AZ-4, respectively. It was observed that ZnO shows poor degradation capability. However, the combination of ZnO and AgBr contributed to apparent enhancement of RhB photodegradation and the AZ-3 product exhibited the best photocatalytic activity. The improved visible light response of the heterojunction could be because of the synergy of ZnO and AgBr. However, the higher amount of AgBr in AgBr/ZnO nanocomposite will lead to a reduced photocatalytic ability (AZ-4), which may be ascribed to the aggregation of the excess AgBr particles on the nanocomposites, which reduces the active sites and therefore the separation efficiency of the charge carrier decreases. In conclusion, the optimum amount of AgBr in the composites is 30%. Temporal evolution about the degradation of RhB over AZ-3 is displayed in Fig. 9b. The concentration of RhB shows a sharp decrease in the first 20 minutes, as indicated by the decrease in the intensity of absorption peaks.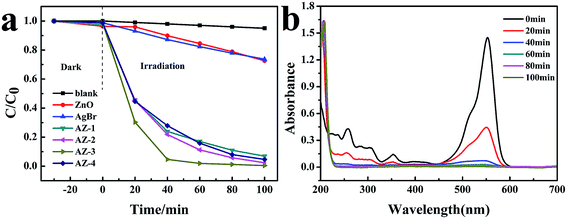 | ||
| Fig. 9 (a) RhB concentration changes with time for different samples (b) temporal evolution of the absorbance curve in the degradation of RhB using the AZ-3 product. | ||
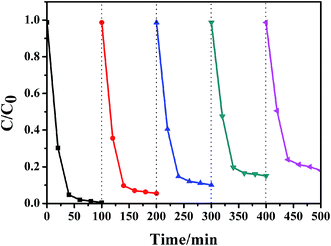
Repeated use of photocatalysts is of significance for practical applications, in particular for the substances with light-sensitive and unstable elements, such as AgBr,35 silver iodide36 and so on. The results of the photostability test of AZ-3 sample for RhB degradation were confirmed by five repeated experiments under the same conditions. As shown in Fig. 10, the AZ-3 sample removes about 99.59% of RhB in the 1st cycle. In the 5th cycle, removal of about 82% RhB occurs within 100 min of reaction. As is well known, the occurrence of metal Ag with a localized surface plasmon response effect during the photocatalysis process can enhance the photocatalytic activity. However, aggregation of the excess Ag particles on the nanocomposites reduces the active sites and leads to a reduced photocatalytic ability. Furthermore, considering the possible loss of catalysts during centrifugation, it is reasonable that about 82% removal of RhB occurs at the 5th cycle.
Fig. 11A shows the XRD patterns of the AZ-3 composite before and after the repeated experiment. It can be seen that there is no peak of metallic Ag in the fresh catalyst (Fig. 11a). However, Fig. 11b indicates a new peak at 38.12°, which belongs to the diffractions of the (111) plane of metallic Ag.30 This represents the photoreduction of AgBr in the composite during irradiation. Fig. 11B shows the SEM image of the AZ-3 composite after repeated experiment and as can be seen there is no obviously change in the hydrangea like nanostructures. This indicates that the newly generated Ag also exists in the form of NPs.
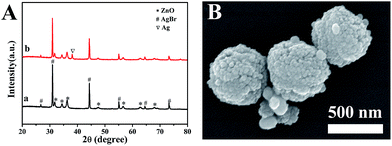 | ||
| Fig. 11 (A) XRD patterns of the AZ-3 composite before photocatalytic testing (a) and after repeated experiments (b), (B) SEM image of the AZ-3 composite after repeated reactions. | ||
The XPS survey was used to detect the distribution of the elements on the samples' surface and the results are shown in Fig. 12. The XPS spectrogram (Fig. 12A) indicates that AZ-3 contains Ag, Br, Zn, and O, which agrees with the XRD results. In addition, the C 1s peak was also detected, which may be ascribed to an occasional hydrocarbon from the equipment.
In Fig. 12B(a), peaks at 367.22 and 373.12 eV are allocated to Ag 3d5/2 and Ag 3d3/2, respectively, which belong to Ag+.31 In Fig. 12B(b), the Ag 3d5/2 peak is further separated into two different parts at 367.1 and 367.7 eV. Similarly, the Ag 3d3/2 peak is also separated into two different parts at 373.1 and 373.6 eV. The peaks at 367.7 and 373.6 eV can be classified as element Ag0, and the peaks at 367.1 and 373.1 eV may be categorized as the Ag+ of AgBr.32–34
All the evidence suggests the formation of metallic Ag on the sample surface during the photocatalytic test. In fact, this situation can be expected when visible light illuminates the samples. In that case, AgBr can capture a photon which is immediately followed by the generation of carriers. The photoinduced electrons can react with interstitial Ag+ ions to generate element Ag0.35 In Fig. 12C, the peaks at 1044.62 and 1021.52 eV are classified to Zn 2p, which confirms the existence of Zn2+.
As is well known, the XPS spectra are obtained by measuring the number of electrons that escape from the top 0 to 10 nm of the material being analyzed. In consideration of the diameter of AgBr NPs (∼60 nm), some errors occur in the XPS element content analysis because of this. Therefore, an additional experiment was conducted. Firstly, 0.2 g of AZ-3 was dissolved in 30 mL of deionized water in a 100 mL beaker with vigorous stirring. Secondly, 0.22 g of sodium thiosulfate pentahydrate (Na2S2O3·5H2O) was added to remove AgBr NPs (AgBr + 2Na2S2O3 = NaBr + Na3[Ag(S2O3)2]). Then the mixture was left, under continuous stirring at room temperature, for 10 h. Thirdly, the white product obtained was centrifuged to obtain the ZnO precipitate and this was cleaned repeatedly with deionized water and absolute alcohol. Then, the ZnO precipitate was dried in a vacuum oven at 60 °C for 8 h. The ZnO product weighed 0.1277 g and a mathematical calculation showed that the mole fraction of AgBr to ZnO was 23.75% instead of 30%. This suggests that not all of colloidal AgBr NPs precipitate on the surface of the ZnO NPs. The loss of colloidal AgBr NPs during centrifugation is the existing phenomenon. Therefore, the 30% is the additional quantity, rather than actual complex quantity.
The role the reactive species played in the degradation of RhB over AZ-3 was explored and the results are shown in Fig. 13. In the experiment, IPA, TEOA and L-AA were selected as scavengers of ˙OH, h+ and ˙O2−, respectively. It was found that the degradation rates of RhB were reduced from 99% to 93.8%, 4.8% and 28.7% in presence of IPA, TEOA and L-AA, respectively. Therefore, it is concluded that the influence of h+ and ˙O2− in the photocatalytic degradation is considerable and ˙OH is not the primary active species.
3.5 Possible photocatalytic mechanism
Based on the previous analysis, a mechanism for the improved photoactivity was hypothesized (Fig. 14). The conduction band (CB) bottom and valence band (VB) top of AgBr are located at −3.7 and −5.95 eV, respectively, and the CB bottom and VB top of ZnO are located at −4.3 and −7.5 eV, respectively.21 During the photocatalytic process, Ag is generated on the surface of compound because of the decomposition of AgBr. This kind of phenomenon has been proved from the XPS measurements. When the visible light energy irradiates the samples, electron–hole pairs can be formed on the AgBr. However, the photogenerated electrons on the CB levels of AgBr transfer towards the CB of ZnO. Furthermore, the VB energy of the ZnO is more positive compared to that of AgBr. Consequently, the holes stay on the VB of AgBr.19 However, the electrons in AgBr CB are trapped by Ag because of the formation of the Schottky barrier at the metallic Ag and AgBr interface. Based on the analysis discussed previously, the carriers are divided efficiently and the lifetime of the electron–hole pairs is extended. Finally, the carriers effectively move to the surface of the composite and can be involved in the degradation process. Therefore, the photocatalytic ability of the composite is greatly improved compared to that of pure AgBr or ZnO.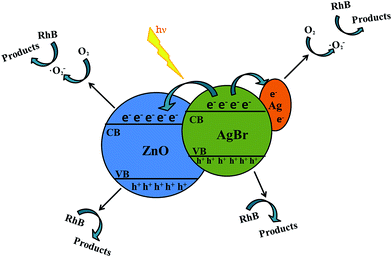 | ||
| Fig. 14 Possible scheme for charge-carrier transfer process in a visible light irradiated AgBr/ZnO system. | ||
4. Conclusions
In this paper, the hydrangea-like AgBr/ZnO hierarchical structure has been fabricated via a one-pot, wet chemical method. Electron microscope images indicated that the composites were 300–800 nm in diameter and consisted of small ZnO NPs with sizes ranging from 20 nm to 50 nm. In addition, AgBr NPs of about 60 nm in diameter were uniformly decorated on the surface of ZnO. PVP and TEOA have a noticeable function in the formation of the hydrangea like morphology of the samples. Furthermore, the AgBr/ZnO heterojunction exhibits better photocatalytic properties for the photodegradation of RhB under visible light irradiation than those of pristine ZnO and AgBr, and the AZ-3 product shows the best photocatalytic performance. The enhanced photocatalytic properties of AgBr/ZnO were attributed to the following factors: (1) the formation of a heterojunction between AgBr and ZnO NPs promotes the separation of photoinduced carriers. (2) Metallic Ag generated during the photocatalytic process serves as an electron sink to capture the photoinduced electrons. (3) The hierarchical structure assembled from the NPs can provide more active sites because of their increased specific surface area. It was found that h+ and ˙O2− have a primary impact in the photocatalytic degradation. This work may provide a new strategy for preparing novel hierarchical composites.Acknowledgements
This work was supported by a key project for Industry-Academia-Research in Jiangsu Province (BY2016043-01), the Enterprise Cooperation Projects (P110900316) and the Testing and Analysis Center Soochow University.References
- X. Li, D. Wang, G. Cheng, Q. Luo, J. An and Y. Wang, Appl. Catal., B, 2008, 81, 267–273 CrossRef CAS.
- D. Wang, H. Sun, Q. Luo, X. Yang and R. Yin, J. Mater. Sci., 2012, 156–157, 323–330 Search PubMed.
- Y. Dong, K. He, L. Yin and A. Zhang, Nanotechnology, 2007, 18, 733–737 Search PubMed.
- Y. Liu, L. Fang, H. Lu, Y. Li, C. Hua and H. Yu, Appl. Catal., B, 2012, 115–116, 245–252 CrossRef CAS.
- D. Wang, Y. Duan, Q. Luo, X. Li, J. An, L. Bao and L. Shi, J. Mater. Chem., 2012, 22, 4847–4854 RSC.
- M. A. Henderson, Surf. Sci. Rep., 2011, 66, 185–297 CrossRef CAS.
- P. Felbier, J. Yang, J. Theis, R. W. Liptak, A. Wagner, A. Lorke, G. Bacher and U. Kortshagen, Adv. Funct. Mater., 2014, 24, 1988–1993 CrossRef CAS.
- Q. Zhang, C. S. Dandeneau, X. Zhou and G. Cao, Adv. Mater., 2009, 21, 4087–4108 CrossRef CAS.
- J. Yoo, C. H. Lee, Y. J. Doh, H. S. Jung and G. C. Yi, Appl. Phys. Lett., 2009, 94, 223117 CrossRef.
- V. Galstyan, E. Comini, C. Baratto, G. Faglia and G. Sberveglieri, Ceram. Int., 2015, 41, 14239–14244 CrossRef CAS.
- S. Le, T. Jiang, Y. Li, Q. Zhao, Y. Li, W. Fang and M. Gong, Appl. Catal., B, 2017, 200, 601–610 CrossRef CAS.
- E. S. Jang, J. H. Won, S. J. Hwang and J. H. Choy, Adv. Mater., 2006, 18, 3309–3312 CrossRef CAS.
- Z. Han, L. Ren, Z. Cui, C. Chen, H. Pan and J. Chen, Appl. Catal., B, 2012, 126, 298–305 CrossRef CAS.
- M. Samadi, H. A. Shivaee, M. Zanetti, A. Pourjavadi and A. Moshfegh, J. Mol. Catal. A: Chem., 2012, 359, 42–48 CrossRef CAS.
- K. Vignesh, A. Suganthi, M. Rajarajan and S. A. Sara, Powder Technol., 2012, 224, 331–337 CrossRef CAS.
- J. Nayak, S. N. Sahu, J. Kasuya and S. Nozaki, Metallization of polymers, American Chemical Society, 1990, pp. 7215–7218 Search PubMed.
- K. Detering, A. Hancock, M. Reade and W. Silvester, Mater. Lett., 2014, 130, 5–8 CrossRef.
- J. Lu, J. Zhu, Z. Wang, J. Cao and X. Zhou, Ceram. Int., 2014, 40, 1489–1494 CrossRef CAS.
- L. Shi, L. Liang, J. Ma and J. Sun, Superlattices Microstruct., 2013, 62, 128 CrossRef CAS.
- C. Wu, L. Shen, Y. Zhang and Q. Huang, Mater. Lett., 2012, 66, 83 CrossRef CAS.
- A. L. Meng, Y. Y. Qiu, L. N. Zhang, X. Xu and Z. J. Li, Sci. China: Chem., 2012, 55, 2128–2133 CrossRef CAS.
- J. M. Song, J. Zhang, J. J. Ni, H. L. Niu, C. J. Mao, S. Y. Zhang and Y. H. Shen, CrystEngComm, 2014, 16, 2652–2659 RSC.
- W. L. Ong, S. Natarajan, B. Kloostrab and G. W. Ho, Nanoscale, 2013, 5, 5568–5575 RSC.
- X. F. Zhou, Z. L. Hu, Y. Q. Fan, S. Chen, W. P. Ding Weiping and N. P. Xu, J. Phys. Chem. C, 2008, 112, 11722 CAS.
- M. Jukić, I. Sviben, Z. Zorić and S. Milardović, Croat. Chem. Acta, 2012, 85, 269–276 CrossRef.
- E. G. C. Neiva, M. F. Bergamini, M. M. Oliveira, L. H. Marcolino and A. J. G. Zarbin, Sens. Actuators, B, 2014, 196, 574–581 CrossRef CAS.
- H. L. Liu, P. Hou, W. X. Zhang and J. H. Wu, Colloids Surf., A, 2010, 356, 21–27 CrossRef CAS.
- X. Shi, X. Chen, X. Chen, S. Zhou, S. Lou, Y. Wang and L. Yuan, Chem. Eng. J., 2013, 222, 120–127 CrossRef CAS.
- D. Li and S. Komarneniw, J. Am. Ceram. Soc., 2006, 89, 1510–1517 CrossRef CAS.
- B. Krishnakumar, B. Subash and M. Swaminathan, Sep. Purif. Technol., 2012, 85, 35–44 CrossRef CAS.
- J. Cao, B. Luo, H. Lin and S. Chen, J. Mol. Catal. A: Chem., 2011, 344, 138–144 CrossRef CAS.
- B. Subash, B. Krishnakumar, M. Swaminathan and M. Shanthi, Spectrochim. Acta, Part A, 2013, 105, 314–319 CrossRef CAS PubMed.
- X. Li, D. Tang, F. Tang, Y. Zhu, C. He, M. Liu, C. Lin and Y. Liu, Mater. Res. Bull., 2014, 56, 125–133 CrossRef CAS.
- L. Liu, S. Lin, J. Hu, Y. Liang and W. Cui, Appl. Surf. Sci., 2015, 330, 94–103 CrossRef CAS.
- H. Wang, D. Peng, T. Chen, Y. Chang and S. Dong, Ceram. Int., 2015, 42, 4406–4412 CrossRef.
- Z. Wan and G. Zhang, J. Mater. Chem. A, 2015, 3, 16737–16745 CAS.
| This journal is © The Royal Society of Chemistry 2017 |

