 Open Access Article
Investigation of [Emim][OAc] as a mild pretreatment solvent for enhancing the sulfonation efficiency of alkali lignin
Zhili Zhanga,
Rendang Yang *a,
Wenhua Gaoa and
Xianping Yaob
aState Key Laboratory of Pulp & Paper Engineering, South China University of Technology, Guangzhou 510640, PR China. E-mail: rendangyang@163.com; Fax: +86 020 87110084; Tel: +86 020 87110084
bHangzhou Research Institute of Chemical Technology Co. Ltd., Hangzhou 310000, PR China. E-mail: hhsyxp@163.com
First published on 15th June 2017
Abstract
The chemical recalcitrance and complex structure of lignin macromolecules make them difficult to meet the needs of real production processes and limit their high-value utilization. Hence, an efficient and economic method to break the recalcitrance under mild conditions is meaningful and purposeful. In this study, 1-ethyl-3-methylimidazolium acetate ([Emim][OAc]) was employed to pretreat alkali lignin (AL). Then the dissolving properties and behaviors of AL in [Emim][OAc] were investigated. In addition, the apparent standard Gibbs energy change (ΔG°), the standard apparent entropy change (ΔS°), and the apparent standard enthalpy energy change (ΔH°) of lignin in [Emim][OAc] were estimated by using the experimental solubility data. The regenerated lignin (RL) from [Emim][OAc] was also analyzed by Fourier transform infrared spectroscopy (FT-IR), Scanning Electron Microscopy (SEM), GPC, TG analysis and 31P-NMR spectroscopy. Importantly, the water solubility and sulfonated degree of RL were increased by 14.6% and 33.6%, respectively. Such results imply that [Emim][OAc] pretreatment could improve the sulfonation efficiency and make the development of lignin-based products a real possibility.
1. Introduction
Lignin, the second most abundant renewable resource after cellulose, has attracted increasing attention in recent decades due to its being biodegradable, renewable, and environmentally friendly.1,2 Worldwide production of lignin from chemical pulping solutions is approximately 26 million tons/year.3 The native lignin molecule contains many functional groups such as carbonyl group, methoxy group, phenolic hydroxy group, alcoholic hydroxy group, ether bond and conjugated double bond,4 which suggests it has the potential to be used to prepare various kinds of functional materials. Unfortunately, due to its complicated primary structure, poor solubility, low reactivity and high resistance, only a relatively small portion of lignin isolated from lignocellulosic biomass is already used commercially as oil well drilling additives, concrete additives, agricultural chemicals and industrial binders.5 Recently, in order to maximize its full value, great academic interest has been devoted to developing lignin-based products to explore the high value-added utilization of lignin resources.6,7 The most common and simplest way to improve the properties and value of lignin is chemical modification (such as hydrolysis, pyrolysis, graft copolymerization, amination, alkylation, sulfonation, oxidation, etc.).8,9 Among these, sulfonation modification is the most efficient method.10,11 However, during the process of sulfonation modification, due to the reticular and condensed 3D structures of lignin, only the surface hydroxyl groups or ether functions was replaced by SO3H groups. Large number of sulfonate groups could not enter aliphatic side chain within lignin molecule, which results in high energy inputs, low yields and generate large number of organic waste. As a matter of fact, in order to break the recalcitrance of linkages in lignin, various processing techniques adopting harsh acidic or alkaline conditions12 and/or organic solvents such as tetrahydrofuran,13 propylene oxide,14 methanol.15 Obviously, these processes are generally less than ideal and economical, as a result of lack of environmental compatibility.16 Therefore a significant challenge remains on the achievement of an environmentally friendly, efficient, and cost effective method to break the linkages, thus to make the most of functional groups within lignin molecule.Ionic liquids (ILs) are a class of substances composed of cations and anions that exist in the liquid state at or below 100 °C.17 Nowadays, ILs has been vigorously investigated as a substitute of traditional solvent owing to its distinct performance such as highly conductivity, wide electrochemical window, neglectable vapor tension, special solubility and can been designed. ILs with sufficiently strong coordinative ability have been mainly used as solvents for natural polymers including lignin,18 cellulose,19 starch and their derivatives.20 ILs are most commonly used to treat biomass, including 1-alkyl-3-methylimidazolium-chloride ionic liquids [Rmim]+ X− (R = allyl, butyl, and ethyl; X = chlorine, bromine and iodine), 1-alkyl-3-methylimidazolium-acid ionic liquids [Rmim]+ X− (R = butyl and ethyl; X = acetate and hydrogen sulfate), 1-butyl-3-methylimidazolium tetrafluoroborate ([Bmim][BF4]) or 1-butyl-3-methylimidazolium methyl sulfate acetate ([Bmim][MeSO4]).18 The high melting point and high viscosity of chloride ionic liquids, relative to 1-alkyl-3-methylimidazolium-acid ionic liquids, greatly limits efficiency and thus limits applications.21 Carboxyl ionic liquids such as [Emim][OAc] is prime candidates for this application because its high hydrogen bond basicity, low viscosity and can been commercialize.22,23 There are many researches about the dissolution behaviors of lignin in ILs. So far, however, little research has been reported on ILs could be used as mild pretreatment solvent for enhancing the sulfonated efficiency of alkali lignin.
Herein, [Emim][OAc] with lower viscosity and strong hydrogen bond basicity was used to pretreat lignin, meanwhile, could to break the reticular linkages in lignin. In this work, the dissolution and regeneration method was employed to pretreat lignin. And the aim of this work is to obtain an efficient and mild method to break the recalcitrance of lignin macromolecule, thus to improve the chemical reactivity of lignin molecule. To begins with, we investigated the solubility of native alkali lignin (AL) in [Emim][OAc] and its influence factors, including moisture content of lignin, dissolving time and temperature. The apparent standard Gibbs energy change (ΔG°), the standard apparent entropy change (ΔS°), and the apparent standard enthalpy energy change (ΔH°) of lignin in [Emim][OAc] solution were estimated by using the experimental solubility data. The results of FT-IR implied that [Emim][OAc] could considered as a physical solvent for lignin. The results of 31P-NMR analysis of RL demonstrated that [Emim][OAc] treatment can produce significant increases in hydroxyl groups. Furthermore, the water solubility and sulfonated degree of RL were increased by 14.6% and 33.6%, respectively. In general, the [Emim][OAc] pretreatment could provide a more green and efficient means to exploit the lignin than conventional methods. To the best of our knowledge, this is the first report on the [Emim][OAc] was used as a mild pretreatment reagent to enhance the sulfonated efficiency of alkali lignin.
2. Experimental
2.1. Materials and methods
Eucalyptus chips were obtained from Huatai Paper Co. Ltd., China. The dried chips were cut into small pieces (2–3 cm). The main chemical components of the chips were measured by the TAPPI standards: cellulose (45.41% ± 2.17% (w/w)), hemicellulose (19.09% ± 1.91% (w/w)), and Klason lignin (23.24% ± 1.02% (w/w)). The acid-precipitating method was used to isolate the dissolved lignin from the black liquor. The alkaline lignin with a diameter of about 100–200 μm was collected by filtration, followed by washing with distilled water, and then freeze-dried for 24 h. Black liquor utilised for this study was produced by alkali sulfite pulping process. Briefly, the conditions are as follows: Na2SO3 = 14 wt%, NaOH = 3.5 wt%, Na2SO3/NaOH = 4/1, liquor/raw material = 5/1, temperature = 180 °C, cooking time = 120 min. [Emim][OAc] was purchased from Shanghai Chengjie Chemical Co., China. Other reagents were of analytical grade and used without further purification.2.2. The dissolution and regeneration of lignin
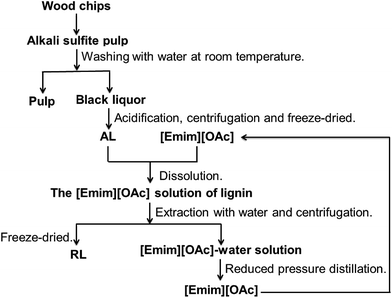
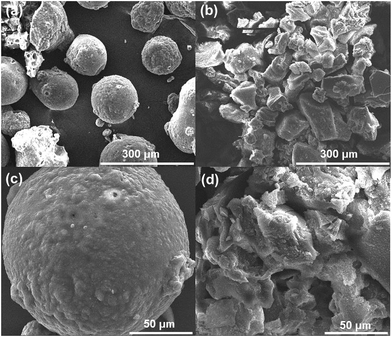
Fig. 1 illustrates the successive dissolution and regeneration of lignin from [Emim][OAc]. A certain amount of lignin and 10 mL of [Emim][OAc] were added to a 50 mL glass flask. The system was stirred at the specified temperature under nitrogen until it became a stable suspension. The process of regeneration was: weighed lignin samples was added to the [Emim][OAc] and stirred at a certain temperature until completely dissolved. Then, 100 mL deionized water was added to terminate the dissolution. The system was stirred for 15 min to extract the lignin. The RL was obtained by centrifuged at 8000 rpm for 15 min, followed by thorough washing with deionized water. To avoid aggregation of lignin in the drying process, the sample was obtained by freeze-drying.182.3. Characterization
The FT-IR spectras of lignin were conducted on a VERTEX 70 (Bruker, German) in the range of 500–4000 cm−1 at resolution of 0.5 cm−1. The GPC analyses were performed using GPC-MALLS (DAWN HELEOS, Wyatt, USA) system consisting of a 50 MW GaAs laser. The wavelength of the laser was 658 nm. Lignin samples were acetylated to improve the solubility in tetrahydrofuran solution before analyses. First, 100 mg lignin was added to the 5 mL pyridine–acetic anhydride mixture (1![[thin space (1/6-em)]](https://www.rsc.org/images/entities/char_2009.gif) :
:![[thin space (1/6-em)]](https://www.rsc.org/images/entities/char_2009.gif) 1, v/v) and kept in a sealed container under nitrogen. Next, the container was protected from sunlight for 2 days at 25 °C. The acetylated lignin was obtained after 100 mL ether was added. The acetylated lignin was collected by filtration, followed by washing with distilled water, and then vacuum drying at 35 °C. Finally, the dried samples were diluted with HPLC grade tetrahydrofuran to 5.0 mg mL−1. Then the molecular weight of lignin including the weight-average molecular weight (Mw), the number-average molecular weight (Mn), were determined by gelatin chromatograph (GPC). The morphology of the surfaces of lignin was observed by a scanning electron microscopy (SEM, Bruker, German) at 10 kV, using the following steps. A freeze dried sample was spread on a circular base and covered with a thin layer of gold (∼2 nm) by sputtering to promote conductivity before SEM observation. To further characterize the structural changes, lignin before and after dissolution was investigated by 31P-NMR spectroscopy. The Bruker Advance III 400 MHz spectrometer operating at a frequency of 100.6 MHz was employing to record the 31P-NMR spectras of samples. Approximately, 40 mg lignin and 400 μL deuterated pyridine were added to a 2 mL colorimetric tube and the weight of lignin was recorded. 250 μL CDCl3 was added until the lignin dissolved fully. 80 mg mL−1 CDCl3-deuterated pyridine (1.6
1, v/v) and kept in a sealed container under nitrogen. Next, the container was protected from sunlight for 2 days at 25 °C. The acetylated lignin was obtained after 100 mL ether was added. The acetylated lignin was collected by filtration, followed by washing with distilled water, and then vacuum drying at 35 °C. Finally, the dried samples were diluted with HPLC grade tetrahydrofuran to 5.0 mg mL−1. Then the molecular weight of lignin including the weight-average molecular weight (Mw), the number-average molecular weight (Mn), were determined by gelatin chromatograph (GPC). The morphology of the surfaces of lignin was observed by a scanning electron microscopy (SEM, Bruker, German) at 10 kV, using the following steps. A freeze dried sample was spread on a circular base and covered with a thin layer of gold (∼2 nm) by sputtering to promote conductivity before SEM observation. To further characterize the structural changes, lignin before and after dissolution was investigated by 31P-NMR spectroscopy. The Bruker Advance III 400 MHz spectrometer operating at a frequency of 100.6 MHz was employing to record the 31P-NMR spectras of samples. Approximately, 40 mg lignin and 400 μL deuterated pyridine were added to a 2 mL colorimetric tube and the weight of lignin was recorded. 250 μL CDCl3 was added until the lignin dissolved fully. 80 mg mL−1 CDCl3-deuterated pyridine (1.6![[thin space (1/6-em)]](https://www.rsc.org/images/entities/char_2009.gif) :
:![[thin space (1/6-em)]](https://www.rsc.org/images/entities/char_2009.gif) 2, v/v), 11 mg mL−1 CDCl3-deuterated pyridine (1.6
2, v/v), 11 mg mL−1 CDCl3-deuterated pyridine (1.6![[thin space (1/6-em)]](https://www.rsc.org/images/entities/char_2009.gif) :
:![[thin space (1/6-em)]](https://www.rsc.org/images/entities/char_2009.gif) 1, v/v) and 100 μL organ phosphorus reagents were added.25 The thermal stability of the dried lignin was examined with thermogravimetric analysis (Q500, USA). Briefly, 15 mg lignin were treated to 700 °C at a heating rate of 20 °C min−1 under nitrogen. The nitrogen flow rate was 30 mL min−1.
1, v/v) and 100 μL organ phosphorus reagents were added.25 The thermal stability of the dried lignin was examined with thermogravimetric analysis (Q500, USA). Briefly, 15 mg lignin were treated to 700 °C at a heating rate of 20 °C min−1 under nitrogen. The nitrogen flow rate was 30 mL min−1.
2.4. Sulfonation reaction
Sulfonated degrees were significantly affected by conditions. In this study, sulfonation of lignin before and after ILs pretreatment is carried out under the experimental conditions, as mentioned in the Amel's and Ouyang's researchs.10,24 The sulfonation degree of sulfonated AL and sulfonated RL were tested by conductometric titration method.253. Results and discussion
3.1. Lignin dissolution
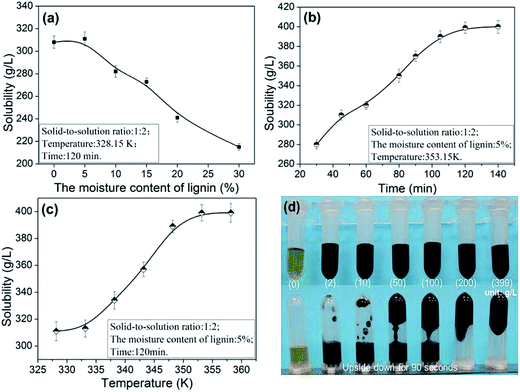 | ||
| Fig. 2 Effects of moisture content (a), time (b), temperature (c) on the lignin solubility in [Emim][OAc] and the photographs of solution with different concentration of lignin (d). | ||
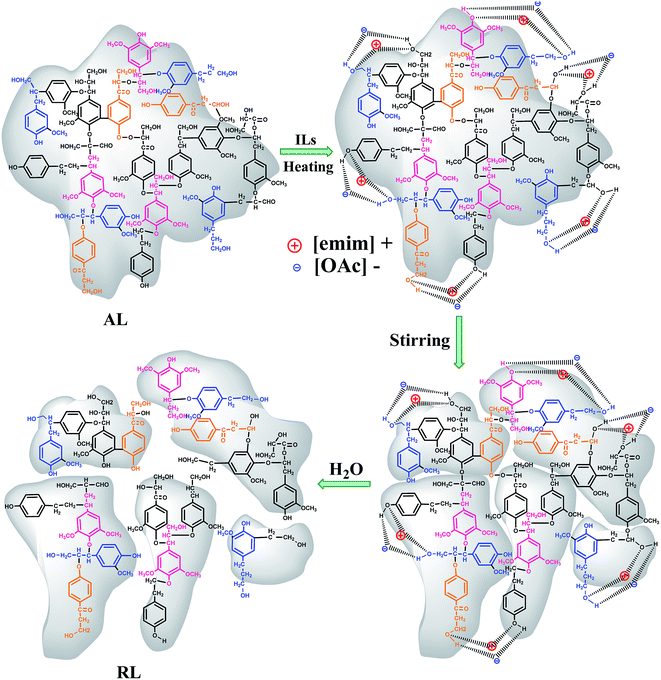
As proposed by Tian et al. and Lateef et al., the possible dissolution mechanism of lignin in ILs involves the OH groups of lignin.27,28 Lateef et al. reported in their work that ILs could interact with terminal OH groups of lignin, subsequently disrupting the internal network within the lignin molecule, resulting in the dissolution of lignin. The anion and cation of ILs played key roles in lignin dissolution. As shown in the Fig. 3, the oxygen atoms in OH groups of lignin serve as electron donor, while the hydrogen atoms act as an electron acceptor. And the [Emim]+ in [Emim][OAc] solvents could be seen as electron acceptor center and [OAc]− as electron-donor center. When ionic liquid and terminal OH groups of lignin were located close enough and to form interaction, the internal network within the lignin molecule were breaked, and, finally, the lignin dissolves.28 In similar circumstances, the oxygen in moisture is also considered to be as electron donor. The hydrogen atoms were regarded as an electron acceptor. When the moisture content of lignin was higher, due to the competitions among the lignin atoms and water, the dissolving ability was reduced greatly. As can been seen from the Fig. 2a, when the moisture content was increased from 5 to 30%, the solubility of lignin decreased from 311.1 to 215.5 g L−1. In addition, the dissolution speed is significantly influenced by the viscosity of the ionic liquids.29 The possible reason was that small amounts of moisture in lignin reduced the viscosity of [Emim][OAc]. It would be advantageous for two centers could be located close enough, thus to improve the dissolving ability of ionic liquid. When the moisture content was 5%, the solubility reached maximum values of 311.1 g L−1.
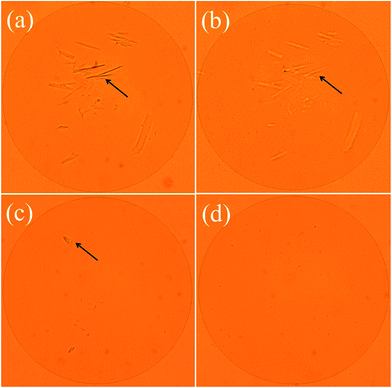
The effect of time on the solubility of lignin was showed in Fig. 2b. When the time was increased, the solubility increased substantially. The dissolution rate goes up rapidly at the beginning as the time increased. And when the time was 120 min, the solubility reaches 399.0 g L−1. As shown in the Fig. 2c, when the temperature was increased from 328.15 to 353.15 K, the solubility of lignin increased from to 399.0 g L−1, and was stable at about 358.15 K. In sum, the optimal conditions of dissolution were as follows: moisture content of lignin was 5%, 353.15 K and 120 min, for which a higher solubility (399.0 g L−1) of lignin in [Emim][OAc] was obtained. The content of lignin significantly affects the viscosity of solution. As can be seen from Fig. 2d, with the increasing of lignin content, the solution became increasingly thick, and the mobility gradually decreased. When the solubility reached 399 g L−1, the stability of solution can be maintained for about 90 seconds at room temperature. In order to confirm that the lignin samples was completely dissolved in ionic liquid, the changes of lignin during the dissolution process were monitored by the polarizing microscope. And the dissolution behaviors of lignin in [Emim][OAc] were shown in the Fig. 4. In the initial dissolution process, lignin with fiber structure could be seen clearly under the polarizing microscope (Fig. 4a, arrow). Because the recalcitrance and stable structure of lignin, complete dissolution was difficult to achieve within a short time. When the dissolving time was increased to 20 min, most lignin was dissolved and only a small handful of samples were present, as shown in the Fig. 4b. Moreover, the complete dissolution of lignin was obtained at 120 min, and the eyeshot became yellow (Fig. 4d).
[∂ln![[thin space (1/6-em)]](https://www.rsc.org/images/entities/char_2009.gif) χ/∂(1/T − 1/Thm)]P = −ΔH°/R χ/∂(1/T − 1/Thm)]P = −ΔH°/R
| (1) |
In eqn (1), ΔH°/R represents the apparent standard enthalpy energy change, χ is the solute solubility in mole fraction, and harmonic mean of the experimental temperatures (Thm) could be calculated according to the following equation:
 | (2) |
In eqn (2), n represents the number of temperatures, thus, we can calculate the value of Thm as follows:
The apparent standard Gibbs energy change (ΔG°) at Thm could be calculated by:
| ΔG° = −R × Thm × K | (3) |
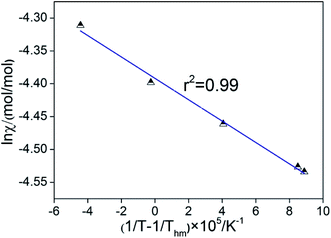
As proposed by Krug et al., one plot is made with (1/T − 1/Thm) as ordinate and ln![[thin space (1/6-em)]](https://www.rsc.org/images/entities/char_2009.gif) χ as abscissas, as shown in Fig. 5. It is very obvious that the linear relations between (1/T − 1/Thm) and ln
χ as abscissas, as shown in Fig. 5. It is very obvious that the linear relations between (1/T − 1/Thm) and ln![[thin space (1/6-em)]](https://www.rsc.org/images/entities/char_2009.gif) χ are obtained and the value of linear correlation coefficient (r2) for the solution process was higher than 0.99, which indicates that the van't Hoff equation is useful to figure out the enthalpies of solution.32 The values of K can be calculated from the intercept of the line as shown in Table 1.
χ are obtained and the value of linear correlation coefficient (r2) for the solution process was higher than 0.99, which indicates that the van't Hoff equation is useful to figure out the enthalpies of solution.32 The values of K can be calculated from the intercept of the line as shown in Table 1.
| r2 | K | Thm/K | ΔG°/(kJ mol−1) | ΔH°/(kJ mol−1) | ΔS°/(J mol−1 K−1) |
|---|---|---|---|---|---|
| 0.9921 | −1628.02 | 338.00 | 12.34 | 15.34 | 3.55 |
The standard apparent entropy change (ΔS°) could be calculated according to the following equation:
| ΔS° = (ΔH° − ΔG°)/Thm | (4) |
The solution process apparently is not spontaneous and endothermic could be inferred from the value of ΔG°. Furthermore, the value of ΔS° and ΔH° were positive, which also indicated that the solution process is endothermic and entropy increment.
3.2. Lignin characterization
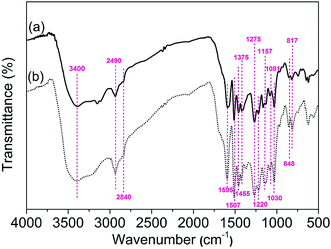
![[double bond, length as m-dash]](https://www.rsc.org/images/entities/char_e001.gif) O stretching vibration. The peak at 1507 cm−1, which corresponds to benzene skeleton vibration. Meanwhile, the peaks at 1375 cm−1 and 1275 cm−1, which indicated that lignin contains Syringyl and Guaiacyl units.33,34 Other bands at 855 and 817 cm−1 represent lone aryl CH wags and two-adjacent aryl CH wags, respectively. The band at 2840 cm−1 and 1030 cm−1 could be attributed to the symmetric CH3 stretch of the methoxyl group and the C–O stretch for the O–CH3 and C–OH, respectively.35 A comparison of the samples revealed that minor chemical changes occurred during dissolving process.36
O stretching vibration. The peak at 1507 cm−1, which corresponds to benzene skeleton vibration. Meanwhile, the peaks at 1375 cm−1 and 1275 cm−1, which indicated that lignin contains Syringyl and Guaiacyl units.33,34 Other bands at 855 and 817 cm−1 represent lone aryl CH wags and two-adjacent aryl CH wags, respectively. The band at 2840 cm−1 and 1030 cm−1 could be attributed to the symmetric CH3 stretch of the methoxyl group and the C–O stretch for the O–CH3 and C–OH, respectively.35 A comparison of the samples revealed that minor chemical changes occurred during dissolving process.36
| Sample ID | Mn (g mol−1) | Mw (g mol−1) |
|---|---|---|
| a Mn = number-average molecular weight; Mw = weight-average molecular weight. | ||
| AL | 2769 | 4753 |
| RL | 1796 | 2931 |
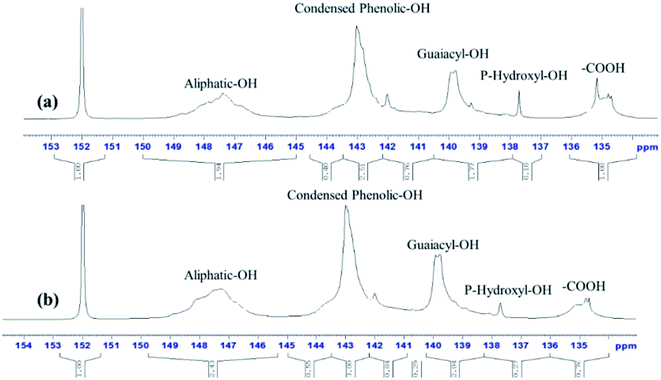 | ||
| Fig. 7 31P-NMR spectras of AL (a) and RL (b); the [Emim][OAc] pretreatment was conducted at a moisture content of lignin was 5% for 120 min at 353.15 K. | ||
| Samples ID | Aliphatic OH | Condensed phenolic OH | Guaiacyl and demethylate –OH | p-Hydroxy-phenyl OH | Carboxylic OH |
|---|---|---|---|---|---|
| AL | 1.95 | 1.32 | 1.59 | 0.18 | 1.08 |
| RL | 2.48 | 1.51 | 2.0 | 0.27 | 0.76 |
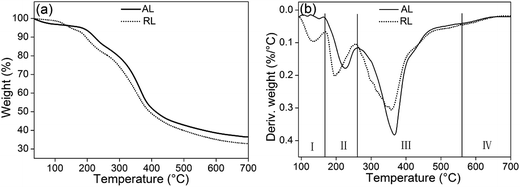 | ||
| Fig. 9 TGA (a) and DTG (b) curves of AL and RL; the [Emim][OAc] pretreatment was conducted at a moisture content of lignin was 5% for 120 min at 353.15 K. | ||
Thermal characteristics of lignin before and after ionic liquids treatment was presented in Table 4. The TGA and DTG analysis results indicate that the thermostability of RL was slightly lower the lignin. The difference in the stability of the two lignins could be due to the difference in their noncovalent interactions, such as hydrogen bonding as well as in the detailed physical structures.45
| Samples ID | Range of Tmax (°C) | Temperature at maximum rate of wt loss (°C) | Residue (%) |
|---|---|---|---|
| AL | 240–570 | 364.93 | 36.49 |
| RL | 220–550 | 358.26 | 32.87 |
3.3. Properties of the sulfonated lignin
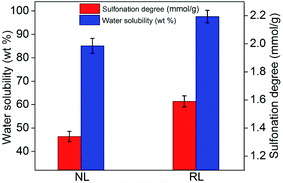
Favorable water solubility and sufficient number of sulfonic groups is important for expanding the fields of lignin application. This can be achieved through sulfonation or hypomethylation. The sulfonation reaction mechanism can be generalized: the –SO3H groups enter the aliphatic side chain of lignin molecule and the hydroxyl or ether functions at the α-carbon of the phenyl propane unit was replaced by these –SO3H groups. For hypomethylation, during the process of reaction, sulfite reacting with formaldehyde to produce –CH2SO3H groups, which bonded to the aromatic nuclei of the lignin molecule.47 Besides that, because of excess of sulfite, –SO3H groups could be introduced into aliphatic side chain of the lignin molecule. As can been seen from the reaction mechanism, having a sufficient number of hydroxyl groups or ether functions is critical for sulfonation or hypomethylation reaction. Sulfonated degrees can be determined by water solubility, the molar weight distribution as well as the hydrophilic character. Fig. 11 shows the properties of the sulfonated lignin before and after [Emim][OAc] treatment. The water solubility of sulfonated RL was 97.5 wt%, which increased about 14.6% compared to that of sulfonated AL. The sulfonated degree of RL was 1.79 mmol g−1, which also increased nearly 33.6% compared to that of sulfonated AL. The improvement in water solubility and sulfonated degree demonstrated that [Emim][OAc] can break the linkages in lignin molecule, improve the sulfonation efficiency, and expand the fields of lignin application.4. Conclusion
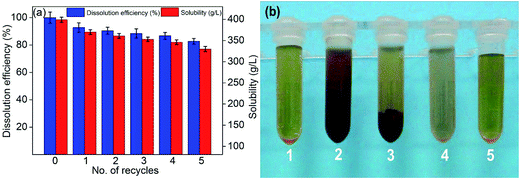
In this study, [Emim][OAc] was elected as novel pretreatment solvent for enhancing the sulfonated efficiency of alkali lignin. The pretreatment process not only is simple and rapid but also has no requirement of any pretreatment. The FT-IR and 13P-NMR analysis of RL indicated [Emim][OAc] was a good direct solution without any derivatization. Furthermore, the lower molecular weight was obtained when lignin is regenerated from ionic liquid and this will beneficial to realize the degradation and transformation of lignin. In addition, the [Emim][OAc] were easily recovered through reduced pressure distillation and the dissolution efficiencies maintained ∼92% after 1 cycle and ∼82% after 5 cycles. Importantly, when the [Emim][OAc] pretreatment was conducted at a moisture content of lignin was 5% for 120 min at 353.15 K, high sulfonated efficiency was achieved. The water solubility and sulfonated degree of RL were increased by 14.6% and 33.6%, respectively. Considering the low-cost and environmentally friendly of [Emim][OAc], this method could provides a simple and green method to realize the high-value utilization of biomass.Acknowledgements
The authors are grateful for the financial support afforded by 111 Plan and Guangdong Provincial Science & Technology Plan Projects (No. 2015B020241001); The State Key Laboratory of Pulp and Paper Engineering (No. 2015ZD04); Open Foundation of Zhejiang Provincial Key Lab. for Chem. & Bio. Processing Technology of Farm Products and Zhejiang Provincial Collaborative Innovation Center of Agricultural Biological Resources Biochemical Manufacturing (No. 2016KF0201).Notes and references
- W. Liu, R. Zhou, D. Zhou, G. Ding, J. M. Soah, C. Y. Yue and X. Lu, Carbon, 2015, 83, 188–197 CrossRef CAS.
- J. Zhang, Y. Chen and M. A. Brook, ACS Sustainable Chem. Eng., 2014, 2, 1983–1991 CrossRef CAS.
- H. F. Mark, Encyclopedia of polymer science and technology, concise, John Wiley & Sons, 2013 Search PubMed.
- X. Guo, S. Zhang and X. Shan, J. Hazard. Mater., 2008, 151, 134–142 CrossRef CAS PubMed.
- R. J. A. Gosselink, M. B. Snijder, A. Kranenbarg, E. R. P. Keijsers, E. De Jong and L. Stigsson, Ind. Crops Prod., 2004, 20, 191–203 CrossRef CAS.
- J. Zakzeski, P. C. A. Bruijnincx, A. L. Jongerius and B. M. Weckhuysen, Chem. Rev., 2010, 110, 3552–3599 CrossRef CAS PubMed.
- L. D. C. Sousa, M. Jin, S. P. S. Chundawat, V. V. Bokade, X. Tang, A. Azarpira, F. Lu, U. Avci, J. F. Humpula and N. Uppugundla, Energy Environ. Sci., 2016, 9, 1215–1223 Search PubMed.
- S. Wu and H. Zhan, Cellul. Chem. Technol., 2001, 35, 253–262 Search PubMed.
- M. V. Alonso, M. Oliet, F. Rodriguez, J. Garcia, M. A. Gilarranz and J. J. Rodriguez, Bioresour. Technol., 2005, 96, 1013–1018 CrossRef CAS PubMed.
- X. Ouyang, L. Ke, X. Qiu, Y. Guo and Y. Pang, J. Dispersion Sci. Technol., 2010, 30, 1–6 CrossRef.
- Y. Matsushita and S. Yasuda, Bioresour. Technol., 2005, 96, 465–470 CrossRef CAS PubMed.
- D. Ciolacu, A. M. Oprea, N. Anghel, G. Cazacu and M. Cazacu, Mater. Sci. Eng., C, 2012, 32, 452–463 CrossRef CAS.
- Y. Li, M. Wu, B. Wang, Y. Wu, M. Ma and X. Zhang, ACS Sustainable Chem. Eng., 2016, 4, 5523–5532 CrossRef CAS.
- Y. Uraki, T. Imura, T. Kishimoto and M. Ubukata, Carbohydr. Polym., 2004, 58, 123–130 CrossRef CAS.
- H. Yamamoto, M. Amaike, H. Saitoh and Y. Sano, Mater. Sci. Eng., C, 1999, 7, 143–147 CrossRef.
- S. Wu and D. S. Argyropoulos, J. Pulp Pap. Sci., 2003, 29, 235–240 CAS.
- C. M. Gordon, Appl. Catal., A, 2001, 222, 101–117 CrossRef CAS.
- Y. Sun, J. Xu, F. Xu, R. Sun and G. L. Jones, RSC Adv., 2013, 4, 2743–2755 RSC.
- S. Zhu, Y. Wu, Q. Chen, Z. Yu, C. Wang, S. Jin, Y. Ding and G. Wu, Green Chem., 2006, 8, 325–327 RSC.
- Q. Liu, M. H. A. Janssen, F. Van Rantwijk and R. A. Sheldon, Green Chem., 2005, 7, 39–42 RSC.
- E. Turner, C. C. Pye and R. D. Singer, J. Phys. Chem. A, 2003, 107, 2277–2288 CrossRef CAS.
- P. Bonhote, A. Dias, N. Papageorgiou, K. Kalyanasundaram and M. Gratzel, Inorg. Chem., 1996, 35, 1168–1178 CrossRef CAS PubMed.
- F. Hermanutz, F. Gahr, E. Uerdingen, F. Meister and B. Kosan, Macromol. Symp., 2008, 262, 23–27 CrossRef CAS.
- A. Kamoun, A. Jelidi and M. Chaabouni, Cem. Concr. Res., 2003, 33, 995–1003 CrossRef CAS.
- O. Straněl and T. Sebok, Cem. Concr. Res., 1997, 27, 185–191 CrossRef.
- Z. Pang, J. Chen, C. Dong and G. Yang, RSC Adv., 2014, 4, 29897–29900 RSC.
- K. Tian, S. Qi, Y. Cheng, X. Chen and Z. Hu, J. Chromatogr. A, 2005, 1078, 181–187 CrossRef CAS PubMed.
- H. Lateef, S. M. Grimes, P. Kewcharoenwong and B. J. Feinberg, J. Chem. Technol. Biotechnol., 2009, 84, 1818–1827 CrossRef CAS.
- Y. Fukaya, A. Sugimoto and H. Ohno, Biomacromolecules, 2006, 7, 3295–3297 CrossRef CAS PubMed.
- R. R. Krug, W. G. Hunter and R. A. Grieger, J. Phys. Chem., 1976, 80, 2335–2341 CrossRef CAS.
- R. R. Krug, W. G. Hunter and R. A. Grieger, J. Phys. Chem., 1976, 80, 2341–2351 CrossRef CAS.
- E. I. Alevizou and E. C. Voutsas, J. Phys. Chem., 2013, 62, 69–78 CAS.
- D. D. Laskar, J. Zeng, L. Yan, S. Chen and B. Yang, Ind. Crops Prod., 2013, 50, 391–399 CrossRef CAS.
- A. Tejado, C. Pena, J. Labidi, J. M. Echeverria and I. Mondragon, Bioresour. Technol., 2007, 98, 1655–1663 CrossRef CAS PubMed.
- R. K. Sharma, J. B. Wooten, V. L. Baliga, X. Lin, W. G. Chan and M. R. Hajaligol, Fuel, 2004, 83, 1469–1482 CrossRef CAS.
- Z. Zhang, J. Chen, Z. Pang, L. A. Lucia, F. Li and G. Yang, Bioresources, 2015, 10, 6565–6575 CAS.
- J. Ko, Y. Shimizu, K. Ikeda, S. Kim, C. Park and S. Matsui, Bioresour. Technol., 2009, 100, 1622–1627 CrossRef CAS PubMed.
- K.-E. L. Eriksson, R. Blanchette and P. Ander, Microbial and enzymatic degradation of wood and wood components, Springer Science & Business Media, 2012 Search PubMed.
- B. B. Hallac, P. Sannigrahi, Y. Pu, M. J. Ray, R. J. Murphy and A. J. Ragauskas, J. Agric. Food Chem., 2009, 57, 1275–1281 CrossRef CAS PubMed.
- R. E. Hage, N. Brosse, L. Chrusciel, C. Sanchez, P. Sannigrahi and A. J. Ragauskas, Polym. Degrad. Stab., 2009, 94, 1632–1638 CrossRef.
- A. Granata and D. S. Argyropoulos, J. Agric. Food Chem., 1995, 43, 1538–1544 CrossRef CAS.
- T. Malutan, R. Nicu and V. I. Popa, Bioresources, 2007, 3, 13–20 Search PubMed.
- R. Samuel, Y. Pu, B. Raman and A. J. Ragauskas, Appl. Biochem. Biotechnol., 2009, 162, 62–74 CrossRef PubMed.
- V. Fierro, V. Tornefernandez and A. Celzard, Microporous Mesoporous Mater., 2006, 92, 243–250 CrossRef CAS.
- S. Kubo and J. F. Kadla, Biomacromolecules, 2005, 6, 2815–2821 CrossRef CAS PubMed.
- T. Rashid, C. F. Kait, I. Regupathi and T. Murugesan, Ind. Crops Prod., 2016, 84, 284–293 CrossRef CAS.
- C. Heitner, R. P. Beatson and D. Atack, J. Wood Chem. Technol., 2007, 2, 169–185 CrossRef.
| This journal is © The Royal Society of Chemistry 2017 |

