
 Open Access Article
 This Open Access Article is licensed under a
 Creative Commons Attribution 3.0 Unported Licence
Selective and colorimetric detection of Ba2+ ions in aqueous solutions using 11-mercaptoundecylphosphonic acid functionalized gold nanoparticles†
Blanca A. García Grajedaa,
Samuel G. Soto Acostaa,
Sergio A. Aguilab,
Héctor Peinado Guevaraa,
Marta E. Díaz-Garcíac,
Adriana Cruz Enríquez *a and
José J. Campos-Gaxiola*a
*a and
José J. Campos-Gaxiola*a
aFacultad de Ingeniería Mochis, Universidad Autónoma de Sinaloa, Fuente de Poseidón y Prol. A. Flores S/N, C.P. 81223, C.U. Los Mochis, Sinaloa, México. E-mail: gaxiolajose@uas.edu.mx; cruzadriana@uas.edu.mx; Fax: +52 668 8127641; Tel: +52 668 8127641
bCentro de Nanociencias y Nanotecnología, Universidad Nacional Autónoma de México (CNyN-UNAM), km. 107 Carretera Tijuana-Ensenada, Apartado Postal 14, C.P. 22800, Ensenada, Baja California, México
cDepartment of Physical and Analytical Chemistry, University of Oviedo, Julián Clavería no. 8 primera planta, C.P. 33006, Oviedo, Spain
First published on 21st June 2017
Abstract
In this paper we describe a simple colorimetric method for the sensitive and selective detection of Ba2+ ions, using 11-mercaptoundecylphosphonic acid functionalized gold nanoparticles (AuNPs–MPA) in aqueous solution. With increasing concentration, Ba2+ ions induced aggregation of AuNPs–MPA, causing a change in color of the colloidal solution from pink to blue. The detection result was monitored using the naked eye and UV-Vis spectroscopy. The maximum absorption was located at 625 nm. The stability of AuNPs–MPA and detection of Ba2+ by AuNPs–MPA was investigated at different pH values (pH = 3, 4, 5, 6, 7, 8, 9, 10, 11, 12). Results indicated that AuNPs–MPA at pH 6 were the optimal choice for detecting Ba2+ ions. The detection limit for Ba2+ was found to be 43.27 μmol L−1 (R2 = 0.9901) within a range of 20–120 μmol L−1. In addition, the selectivity of this method was investigated using other metal ions. The AuNPs–MPA was selective for Ba2+ compared with other metal ions (Li+, Na+, K+, Mg2+, Ca2+, Sr2+, Ba2+, Mn2+, Fe2+, Co2+, Ni2+, Cu2+, Zn2+, Cd2+, Hg2+, Sb3+, Bi3+) leading to a remarkable color change. Moreover, the developed cost-effective probe has been successfully applied to real drinking and tap water samples which demonstrated the potential for field applications.
1. Introduction
Heavy metal pollution in aquatic systems and soil has become a serious threat to human health and the environment.1 Barium (Ba) is considered as a heavy metal and is widely used in a variety of industrial processes, such as electroplating, the glass industry, the petroleum industry, alloying and fixing pigments, and in corrosion protection films. To date pollution of water by Ba2+ ions is still the most common.2,3 Barium compounds are also used in paint, bricks, ceramics, glass and rubber.4 Ba2+ contaminates soil and water, and violently reacts with the latter to form salts. All barium salts, especially the water and acid-soluble compounds are highly toxic (for example, barium sulphide).5,6 High concentrations of Ba in water used for irrigation have toxic effects on plant life.7,8 The soluble form of Ba can be accumulated by plants; this may result in toxicity for other organisms because accumulated Ba can be transferred to animals.7,9 The selective and sensitive barium is important because, in low doses, barium acts as a muscle stimulant, while in higher doses it affects the nervous system, causing cardiac irregularities, increased or decreased blood pressure, tremors, weakness, anxiety, dyspnea, changes in heart rhythm or paralysis and possibly death.9 At present, water pollution by Ba2+ ions are still very common. In this context, several methods have been used for detection of heavy metal ions, including Ba2+; such as, fluorescent chemosensors,10,11 inductively coupled plasma mass spectrometry (ICP-MS),12 voltammetry13 and spectrophotometry,14 proving much more sensitivity and reliability than colorimetric methods and other procedures. However, these methods require expensive instruments, tedious sample preparation, more time for analysis and these are not suitable for on-site assays. Therefore, the development of simple and rapid colorimetric method, a lower cost and less response time, that can be used in metal ions assays in environmental samples is necessary.In recent years, gold nanoparticles (AuNPs) have been amply studied, and used in a wide range of applications including: optical sensors, electronics, surface-enhanced Raman spectroscopy and colorimetric probes. Colorimetric sensors based on gold nanoparticles (AuNPs) are of particular interest because they are simple and convenient; no sophisticated instruments are required and the chemical interaction can easily be monitored by color changes. Therefore, AuNPs are widely used for analyte detection. For example, AuNPs are red in color; however, AuNPs aggregates generated by different metal ions show changes to other colors such as yellow, purple or blue.15–20
AuNPs display strong surface plasmon resonance (SPR) absorption properties,21,22 which are extremely sensitive to size, shape and interparticle plasmon coupling on analyte-induced aggregation of AuNPs. These results in a color change from red to blue that may be observed by the naked eye.23,24
Colorimetric assays have been widely used to detect molecules such as oligonucleotides,25 proteins,26 small molecules27 and metal ions.28–30 These assays are simple, rapid and, most importantly, cost effective. On the other hand, Ba2+ ion detection by the colorimetric method using specially functionalized gold and silver nanoparticles has been scarcely reported.3,31,32 To date, there are no reports detecting metals ions using phosphonic groups, more specifically 11-mercaptoundecylphosphonic acid (MPA) functionalized gold nanoparticles. One of the advantages of using this ligand (MPA) is that it provides a wide range on pH sensitivity due to their dibasic nature, providing excellent stability in aqueous solutions under extremes pH.33
In this work, 11-mercaptoundecylphosphonic acid (MPA)-functionalized gold nanoparticles (AuNPs–MPA) were synthesized and used as a colorimetric sensor to detect Ba2+. The MPA was attached to the surface of AuNPs using the thiol group via the Au–S bond;34–36 then, AuNPs–MPA were used for metal ion detection. Other metal ions such as Li+, Na+, K+, Mg2+, Ca2+, Sr2+, Ba2+, Mn2+, Fe2+, Co2+, Ni2+, Cu2+, Zn2+, Cd2+, Hg2+, Sb3+, Bi3+ were tested for metal ion selectivity. Only the Ba2+ ion caused aggregation of AuNPs–MPA.
2. Experimental section
2.1 Materials
Hydrogen tetrachloroauric(III) trihydrate (HAuCl4·3H2O), trisodium citrate, 11-mercaptoundecylphosphonic acid (MPA), NaOH, polyvinyl alcohol, LiCl, NaCl, KCl, MgCl2, CaCl2, SrCl2, BaCl2, MnCl2, FeCl2, CoCl2, NiCl2, CuCl2, ZnCl2, CdCl2, HgCl2, SbCl3, BiCl3, were obtained from Sigma-Aldrich. All reagents were of analytical grade and distilled water was used in all experiments.2.2 Methods
UV-Vis spectra were recorded on a Shimadzu 1800 UV-Vis spectrophotometer at room temperature. IR data were obtained on an Alpha-Bruker Fourier-Transform Infrared Spectrometer. TEM images were obtained from a JEM-2010 transmission electron microscope.2.3 Gold nanoparticle (AuNPs–MPA) preparation
AuNPs were produced by reduction of HAuCl4·3H2O with trisodium citrate in aqueous solution.29,33,34 Briefly, HAuCl4·3H2O (100 mg, 0.25 mmol) was dissolved in 200 mL water and the solution was heated (temperature ≤ 80 °C) while stirring. A trisodium citrate (40 mmol L−1) solution was rapidly added with intense stirring. After the color had changed from pale yellow to wine red, an aqueous solution of 11-mercaptoundecylphosphonic acid (81.7 mg, 0.3 mmol), containing an equivalent amount (0.0022 mg, 0.3 mmol) of sodium hydroxide, was added to the colloidal gold suspension. The solution was stirred for 1 h and then diluted to 250 mL with distilled water. In order the remove excess trisodium citrate and MPA, the colloidal suspension was dialyzed in an aqueous medium. Unwanted large aggregated particles were removed from the suspension by filtration through a 0.45 μm nylon filter. Finally, AuNPs–MPA were collected and stored at room temperature for later use. UV-Vis spectra were obtained at 530 nm to AuNPs–MPA.2.4 Colorimetric detection of Ba2+
To test the sensitivity of AuNPs–MPA, one mL aliquots of solution containing AuNPs–MPA were taken to prepare 10 mL aqueous solution samples, using PVA 1% as a stabilizing agent, then increasing concentrations of Ba2+ (20–300 μmol L−1) were added using the stock solution. The pH was adjusted to 3–12 using acetic acid/sodium acetate (0.1 M), as buffer. We investigated the selectivity of AuNPs–MPA for Ba2+ with other metal ions: Li+, Na+, K+, Mg2+, Ca2+, Sr2+, Ba2+, Mn2+, Fe2+, Co2+, Ni2+, Cu2+, Zn2+, Cd2+, Hg2+, Sb3+, Bi3+ under the same conditions.Subsequently, 1.0 mL samples of solution containing AuNPs–MPA were separately mixed with the different metal ions (100 μmol L−1). The mixtures were prepared at room temperature and then transferred separately into 1.5 mL quartz. Their SPR absorption bands were recorded by UV-Vis spectrophotometer.
2.5 Colorimetric detection of Ba2+ in real samples
Drinking water and tap water were collected in Los Mochis, Sinaloa, Mexico and filtered through a 0.45 μmol L−1 membrane. A 0.0001 mol L−1 standard solution of Ba2+ was prepared. A series of dispersions was prepared using 1.0 mL of AuNPs–MPA and 20–300 μmol L−1 of Ba2+. The pH was adjusted to 6 using acetic acid/sodium acetate (0.1 M) as buffer. Subsequently, SPR absorption bands were recorded by UV-Vis spectrophotometer.3. Results and discussion
3.1 Characterization of AuNPs–MPA
AuNPs were prepared by reducing HAuCl4, with citrate as reducing agent. MPA adsorbed on the gold nanoparticles by thiol groups. Fig. 1 shows the optical absorption spectra of colloidal gold before and after modification with MPA. The surface plasmon band exhibits a slight red shift from 527 nm to 530 nm associated with MPA modification. This small red shift is due to the increase in refractive index of the medium that surrounds the nanoparticles.37 Maximum absorption of the AuNPs surface plasmon resonance (SPR) was located at 530 nm, determined by UV-Vis spectrophotometer. TEM images showed well-monodispersed AuNPs–MPA with a size ranging from 14 to 30 nm, average size of 20.8 nm (Fig. 2). | ||
Fig. 1 UV-Vis spectra of ( ) AuNPs–citrate and ( ) AuNPs–citrate and ( ) AuNPs–MPA. ) AuNPs–MPA. | ||
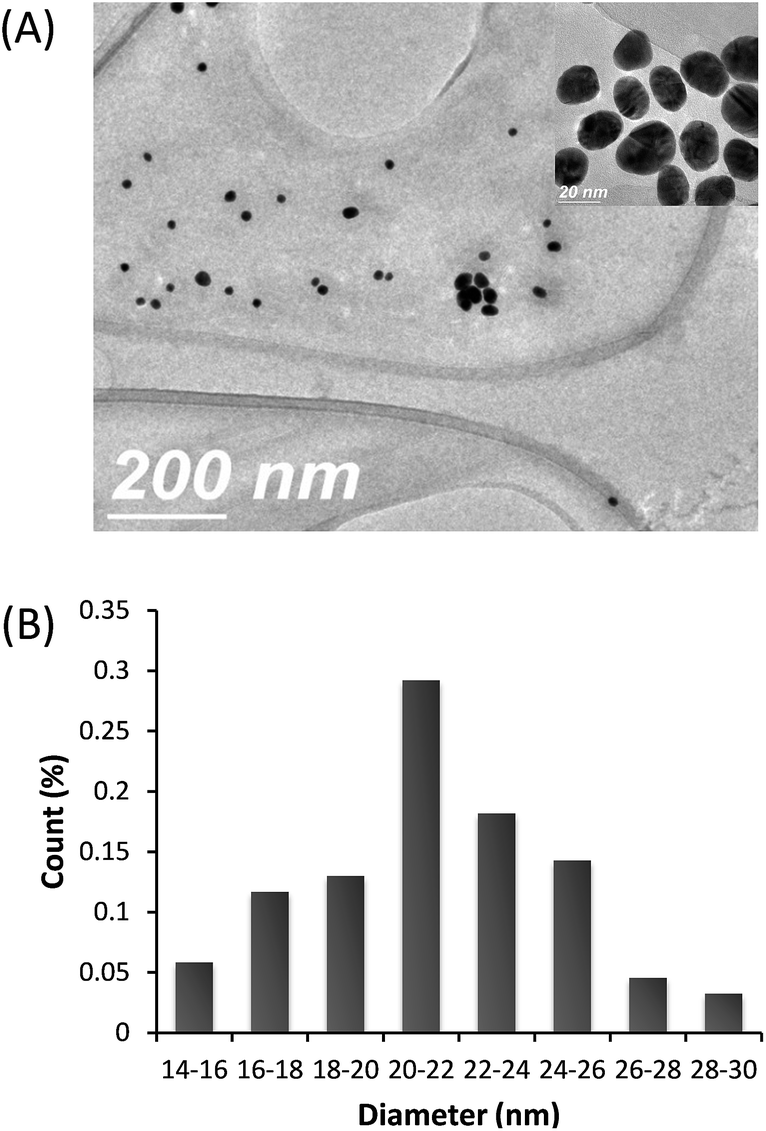 | ||
| Fig. 2 (A) Typical TEM image of the AuNPs–MPA (scale bar: 200 nm and 20 nm) (B) histogram of AuNPs–MPA particle size distribution. | ||
The AuNPs–MPA were also characterized using infrared spectroscopy. IR spectra of MPA and AuNPs–MPA are compared in Fig. 3. Note that the characteristic –SH stretching absorption peaks at 2400–2250 cm−1 corresponding to MPA have disappeared in the AuNPs–MPA IR spectrum, suggesting that MPA is coordinated with the gold atoms on the surface of AuNPs through the Au–S bond.
 | ||
| Fig. 3 FT-IR spectra of (A) MPA and (B) AuNPs–MPA. | ||
The MPA IR bands are assigned as follows: 2920–2850 cm−1 for symmetric (νs) and antisymmetric (νas) C–H stretching, respectively, at 1465 and 1402 cm−1 for the scissoring mode (δ), at 1225 cm−1 P![[double bond, length as m-dash]](https://www.rsc.org/images/entities/char_e001.gif) O (ν), 1077 and 1006 cm−1 (νs and νas of PO3), at 950 and 930 cm−1 (ν, P–OH), at 785 and 715 cm−1 are IR bands assigned to CH2 out of the plane (oop) and the P–C, respectively. All these bands are consistent with previous studies of phosphonic acids.33,38,39
O (ν), 1077 and 1006 cm−1 (νs and νas of PO3), at 950 and 930 cm−1 (ν, P–OH), at 785 and 715 cm−1 are IR bands assigned to CH2 out of the plane (oop) and the P–C, respectively. All these bands are consistent with previous studies of phosphonic acids.33,38,39
A broad band of the IR of AuNPs–MPA which appears at 3427 cm−1 corresponds to OH groups of the citrate and P–OH of MPA groups. The intensity of the PO band at frequency ∼1220 cm−1 is clearly diminished, and a new band appears at a lower wavenumber (1160 cm−1), associated with phosphonate groups; in addition, the small peaks at 980 and 945 cm−1 assigned to P–OH group moieties, concluding that these groups are deprotonated.33,39 Two vibrational bands at 1590 and 1402 cm−1 are assigned to the symmetric (νs) and antisymmetric (νas) stretching of COO− groups of citrate.40,41 Data from complementary techniques such as XPS and NMR suitable for study the binding sites of phosphonic and thiol ligands to AuNPs, compare favorably with our results.42–44
3.2 Interactions of AuNPs–MPA with various metal ions
The interactions of the AuNPs–MPA with various metal ions was monitored by UV-Vis spectrophotometer and also by color change visualized with the naked eye.To evaluate the selectivity of AuNPs–MPA, various metal ions were used: Li+, Na+, K+, Mg2+, Ca2+, Sr2+, Ba2+, Mn2+, Fe2+, Co2+, Ni2+, Cu2+, Zn2+, Cd2+, Hg2+, Sb3+ and Bi3+ (100 μmol L−1) under the same conditions (pH 6). Fig. 4 shows that only Ba2+ causes a shift in the plasmon absorption peak from 530 nm to 625 nm. This red shift was observed as a color change from pink to blue.
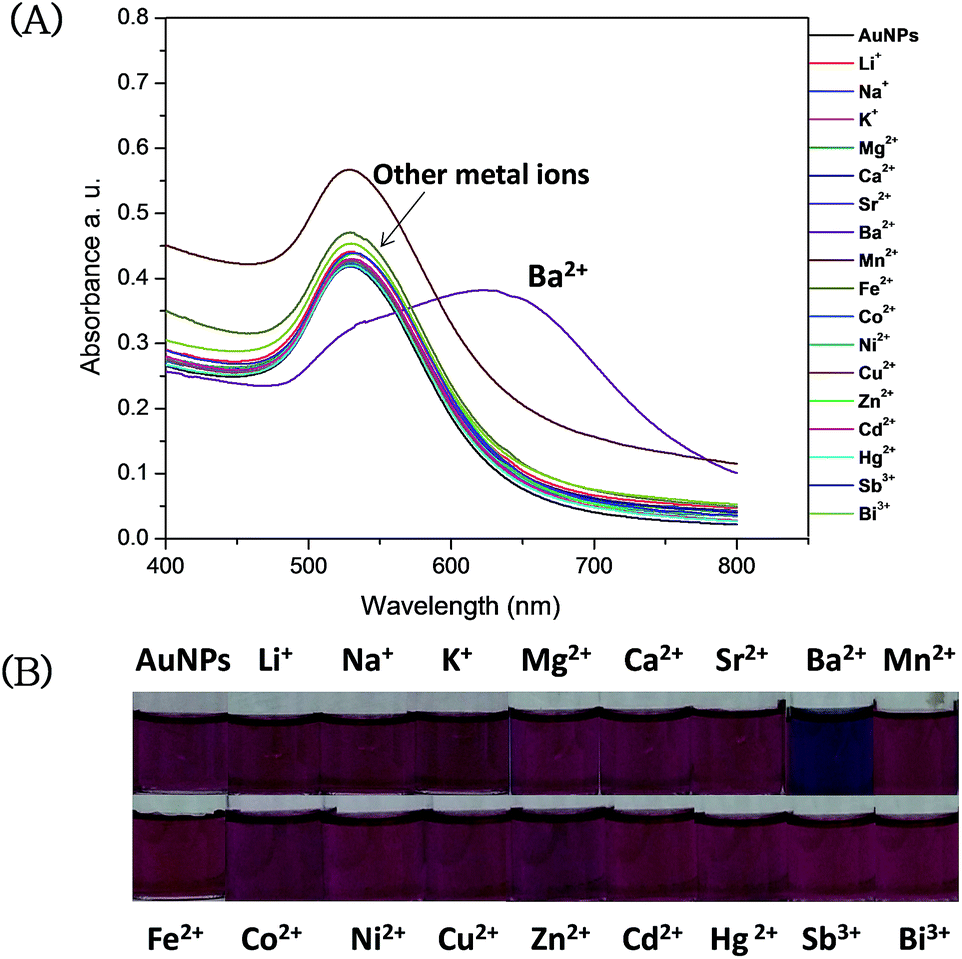 | ||
| Fig. 4 (A) UV-Vis spectra of AuNPs–MPA in presence of different metal ions (100 μmol L−1). (B) Images of AuNPs–MPA in presence of various metal ions (100 μmol L−1). | ||
The A625/A530 data of AuNPs–MPA show excellent selectivity of Ba2+ over other metal ions (Fig. 5 and S1†). Ba2+ induced remarkable aggregation of the AuNPs–MPA, and other metal ions did not influence the absorption spectrum of AuNPs–MPA indicating that no aggregation occurred. These results could be evidence for the aggregation of AuNPs–MPA by Ba2+ seen in the TEM images shown in Fig. 6. Thus, the selectivity of AuNPs–MPA for the detection of Ba2+ might be suitable for the detection of Ba2+ in environmental samples.
 | ||
| Fig. 5 Absorbance ratio (A625/A530) of AuNPs–MPA in the presence of 100 μmol L−1 Ba2+ and other metals ions. | ||
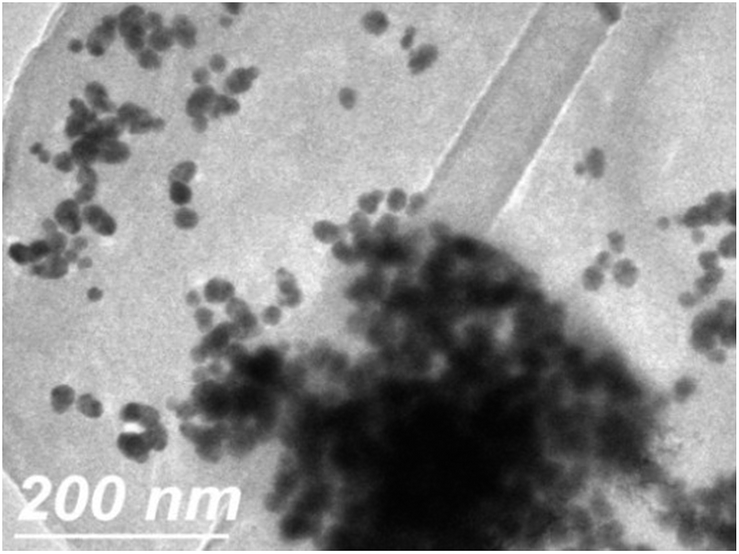 | ||
| Fig. 6 TEM image of AuNPs–MPA in the presence of Ba2+ (100 μM). | ||
The sensing mechanism was explained in terms of the Lewis acid–base theory that Ba2+ might coordinate with oxygen-donating chelates and could form a stable Ba2+ citrate and phosphonate complex. To gain a clearer understanding of the interaction between AuNPs–MPA and Ba2+, we used IR spectroscopy. The vibrational bands for AuNPs–MPA that were observed in the IR spectrum were: at 2920–2850 cm−1 C–H stretching; at 1160 cm−1 phosphonate groups; at 1553 and 1392 cm−1 COO− from the citrate compound. These appear with a lower wavenumber in the vibrational bands obtained for AuNPs–MPA + Ba2+ (see Fig. S2 in ESI†). These shifts show that AuNPs–MPA and citrate interact with Ba2+ in aqueous solution.45–47
As shown in Fig. 7, aggregation of AuNPs–MPA in the presence of Ba2+ is due to the binding of Ba2+ ions through bonds formed between phosphonic and COO− groups that can be captured by Ba2+, producing a substantial shift in the plasmon band to a longer wavelength and the mentioned color change from pink to blue.
 | ||
| Fig. 7 Illustrative description of (A) functionalized of AuNPs–MPA and (B) Ba2+ induced aggregation of AuNPs–MPA. | ||
In addition, to investigate the metal–ligand interaction of citrate ions with Ba2+, Ba2+ was added to unfunctionalized AuNPs (AuNPs–citrate). This did not influence the surface plasmon band shown by the UV-Vis results (see Fig. S3 in ESI†). The color of the dispersions remained pink, implying that citrate ions did not interact with Ba2+; therefore, functionalization of AuNPs is necessary to detect Ba2+.
On the other hand, to study the sensitivity (detectable minimum concentration of Ba2+) and the linear range in more detail, different concentrations of the standard solution of barium in a range of 20–120 μmol L−1 were taken, using the same volume of AuNPs–MPA at pH 6, and analyzed by UV-Vis spectrophotometry.
Fig. 8 shows a red shift in wavelength and a broadening of the SPR peaks of AuNPs–MPA. Simultaneously, the intensity of the SPR signal decreased at 530 nm and a new band appeared at around 625 nm with increasing concentration of barium, as a result of the induced aggregation of AuNPs–MPA. The color of the AuNPs–MPA is proportional to the amount of barium added to the samples, changing from pink to blue, and is accompanied by a bathochromic shift in the UV-Vis spectra. A linear relationship of Ba2+ was obtained from the absorbance ratio (A625/A530) and concentration of Ba2+ in the 0–120 μmol L−1 range, with a correlation coefficient (R2) of 0.9901, as shown in Fig. 9. The limit of detection (LOD) for Ba2+ was found at 43.27 μmol L−1.
 | ||
| Fig. 8 (A) UV-Vis spectra of AuNPs–MPA after the addition of different concentrations of Ba2+, (B) photographic image of AuNPs–MPA of detection. | ||
 | ||
| Fig. 9 The linearity curve of the ratio of A625/A530 versus Ba2+ concentration. | ||
3.3 Influence of pH on the stability of AuNPs–MPA and aggregation induced by Ba2+
The pH value of the system also plays an important part in the sensing system. The stability of AuNPs–MPA at different pH values was investigated. The pH was adjusted from 3–12 using an acetic acid/sodium acetate (0.1 M) buffer solution. Fig. 10 (blue line) shows that the absorbance ratio (A625/A530) of AuNPs–MPA increased at pH 3; thus, under very acidic conditions the absorbance ratio (A625/A530) is slightly higher than without Ba2+. This may be explained because phosphonate groups, as mentioned above (Fig. 2), are deprotonated species, and protonation of these groups induces the formation of intermolecular hydrogen bonds between phosphonic groups. This causes the AuNPs–MPA to aggregate by interparticle plasmon coupling, which is unsuitable for monitoring Ba2+ ions under these conditions (see Fig. S4 in ESI†).33,48 In the pH range between 4 and 12, the absorbance ratio (A625/A530) was constant, indicating that AuNPs–MPA at these values were stable. The influence of pH on the Ba2+-induced aggregation of AuNPs–MPA (Fig. 10, red line) shows a high absorbance ratio (A625/A530) at the pH range 4–10; an even higher aggregation was observed at pH 6.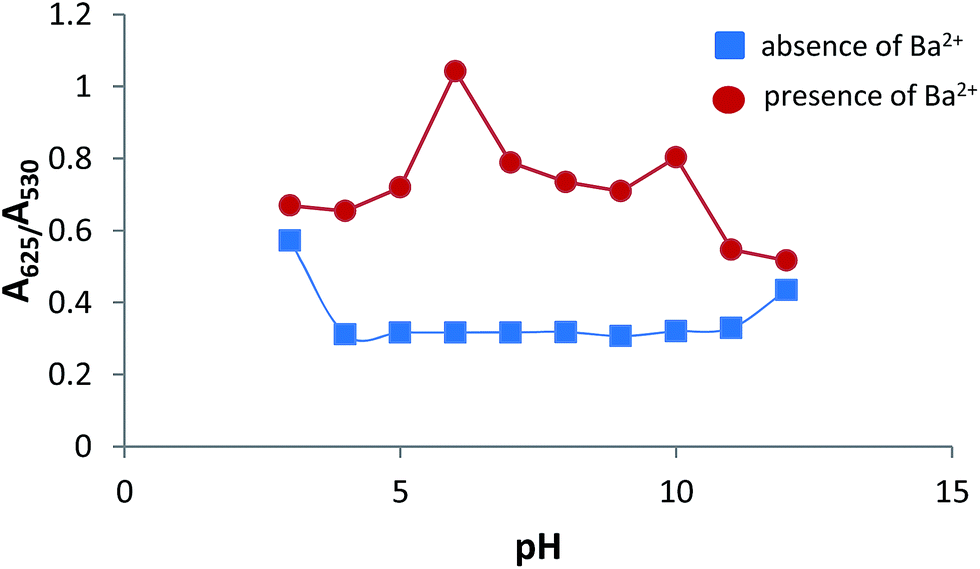 | ||
| Fig. 10 Influence of pH on absorbance ratio (A625/A530) of AuNPs–MPA in the absence and presence of Ba2+ (100 μmol L−1). | ||
At pH > 10, the A625/A530 decreased because of the formation of colloidal BaOH2 in the alkaline environment of the solutions. It is worth to mention the fact that the ionic strength of the medium may result in the AuNPs–MPA aggregation.49–51 In order to avoid such influence, a 0.1 M ionic strength was kept constant using the acetic acid/sodium acetate 0.1 M thoroughly. All assays were performed at room temperature in order to avoid changes in the hydrodynamic dimensions of the MPA–AuNPs and their aggregation.52,53
3.4 Effect of reaction time
The influence of reaction time upon the interaction between AuNPs–MPA and Ba2+ was investigated and the results are recorded in Fig. 11. It was observed that after the addition of 100 μM Ba2+ to the AuNPs–MPA solution, the absorption ratio (A625/A530) for the reaction time increased gradually from 1 to 10 minutes and was then consistent from 10 to 20 minutes. This indicated that aggregation of the AuNPs solution was nearly complete at the 10 minutes reaction time. Thus it was determined that 10 minutes was the optimum reaction time and all further colorimetric measurements were performed for 10 minutes.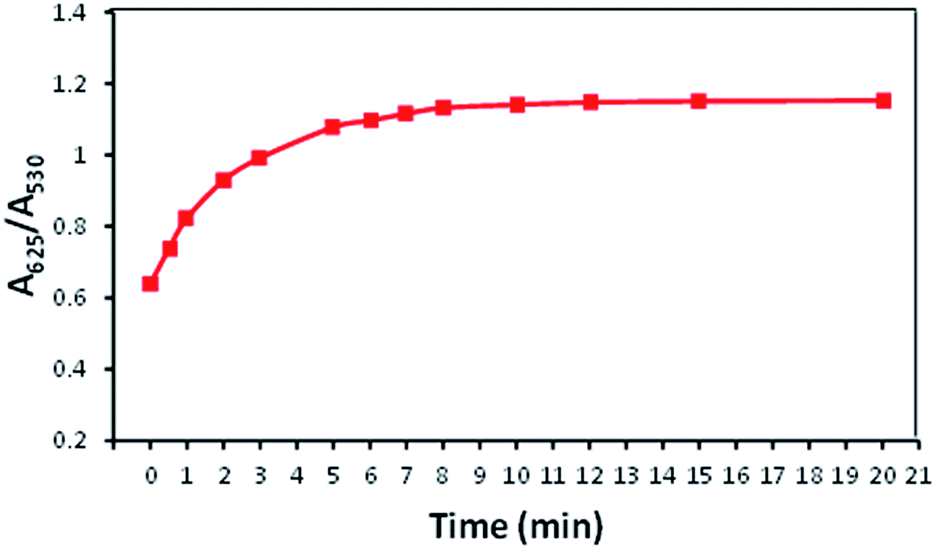 | ||
| Fig. 11 Effect of reaction time on the absorption ratio (A625/A530) of AuNPs–MPA solution containing 100 μM Ba2+. | ||
A sensor providing a fast response will be beneficial to the on-site and real time detection of Ba2+. Therefore, the aggregation reaction kinetics of this assay with different concentrations of Ba2+ were investigated. As shown in Fig. S5,† in the concentration range (80–150 μM), the A625/A530 increased with the increase in the incubation time and kept constant after 10 min. When the concentration of Ba2+ was 100 μM, the absorbance ratio increased very rapidly within 1 min and then reached equilibrium with time. To make the recognition reaction complete, the A625/A530 was measured after incubation for 10 min. Therefore, 10 min time course was introduced to record the coordination reaction in the sensing system.
3.5 Analysis of Ba2+ ions in real water samples
To confirm the practical application of this method, we collected two different water samples (drinking water and tap water), and filtered them through a 0.45 μM membrane. Ba2+ ions were not detected in drinking water samples or in tap water, according with the UV-Vis results (see Fig. S6 in ESI†). We then prepared a series of samples by spiking the drinking and tap water with a standard solution of Ba2+ in a range of 20–300 μM. Results of the detection of Ba2+ in these samples are shown in Fig. 12. | ||
| Fig. 12 UV-Vis absorption spectra of (A) drinking water and (B) tap water with different concentrations of Ba2+ (20–300 μmol L−1), separately for both samples. | ||
The SPR bands of AuNPs–MPA are observed at different concentrations (20–300 μmol L−1) of Ba2+. The intensity of absorbance of AuNPs–MPA decreased with increasing concentrations of Ba2+, accompanied by a colour change of the colloidal dispersions from pink to blue for the drinking water, and from pink to purple for the tap water samples (see Fig. S7 ESI†).
The minimum detectable concentration of Ba2+ was found at 56.94 μM (R2 = 0.9577) and 176.78 μM (R2 = 0.9738) in drinking water and tap water, respectively (see Fig. S8 in ESI†).
These results demonstrate that this method is applicable for the detection of Ba2+ in both water samples. Higher sensitivity was observed for samples of drinking water, perhaps because these samples have less impurity.
4. Conclusions
In this work, we developed a colorimetric system of AuNPs–MPA that can be used to detect Ba2+ ions. In the presence of high concentration of potential interfering ions. Ba2+ was the only metal that induced aggregation of AuNPs–MPA, also showing a color change of colloidal solutions from pink to blue, accompanied by a plasmon absorption band shift from 530 nm to 625 nm. The colorimetric system is a method that allows monitoring Ba2+ ions at concentrations as low as 43.27 μmol L−1 at low cost and rapidly (the detection time within 10 min). This method was successfully applied to detect of Ba2+ in drinking and tap water samples. Furthermore, we believe that this approach has great potential for the routine detection of Ba2+ in environmental samples.Acknowledgements
The authors gratefully acknowledge access to the analytical facilities (Transmission Electronic Microscopy Laboratory) at the Centro de Nanociencias y Nanotecnología, Universidad Nacional Autónoma de México (CNyN-UNAM). B. A. G. G. thanks the support from Consejo Nacional de Ciencia y Tecnología (CONACYT) in the form of a graduate scholarship (261564). This work was supported by Secretaría de Educación Pública México (UAS-CA-281). The authors are indebted to Prof. Francisco Ruiz Medina and Ph.D. María Isabel Pérez Montfort of Centro de Nanociencias y Nanotecnología, Universidad Nacional Autónoma de México (CNyN-UNAM) for analytical support and his valuable contributions to this work.References
- (a) J. O. Nriagu and J. M. Pacyna, Nature, 1988, 333, 134–139 CrossRef CAS PubMed; (b) O. Kristofova, L. Trnkova, V. Adam, J. Zehnalek, J. Hubalek, P. Babula and R. Kizek, Sensors, 2010, 10, 5308–5328 CrossRef PubMed.
- J. Kravchenko, T. H. Darrah, R. K. Miller, H. K. Lyerly and A. Vengosh, Environ. Geochem. Health, 2014, 36, 797–814 CrossRef CAS PubMed.
- R. P. Modi, V. N. Mehta and S. K. Kailasa, Sens. Actuators, B, 2014, 195, 562–571 CrossRef CAS.
- S. Martin and W. Griswold, Environ. Sci. Technol., 2009, 15, 1–6 Search PubMed.
- R. Suwa, K. Jayachandran, N. T. Nguyen, K. Fujita and H. Saneoka, Arch. Environ. Contam. Toxicol., 2008, 55, 397–403 CrossRef CAS PubMed.
- Canadian Council of Ministers of the environment-CCME, Barium Canadian soil quality guidelines for the protection of environmental and human health, Canadian environmental quality guidelines, 1999 Search PubMed.
- W. de Oliveira, M. F. Batista de Carvalho, E. de Almeida, A. A. Menegário, R. Naves Domingos, A. L. Brossi-Garcia, V. F. doNascimento Filho and R. Erthal Santelli, Talanta, 2012, 100, 425–431 CrossRef CAS PubMed.
- M. Llugany, C. Poschenrieder and J. Barcelo, Arch. Environ. Contam. Toxicol., 2000, 39, 440–444 CrossRef CAS PubMed.
- (a) G. Machata, Handbook on Toxicity of Inorganic Compounds, ed. H. G. Seiler and H. Sigel, Marcel Dekker Inc, New York, 1988, p. 97 Search PubMed; (b) P. Patnaik, Handbook of Inorganic Chemical Compounds, McGraw-Hill, New York, 2003, p. 77 Search PubMed; (c) B. Kukiattrakoon, C. Hengtrakool and U. J. Kedjarune-Leggat, Dental Science, 2010, 5, 189–200 CrossRef.
- (a) M. Licchelli, A. O. Biroli and A. Poggi, Org. Lett., 2006, 8, 915–918 CrossRef CAS PubMed; (b) P. N. Basa, A. Bhowmick, M. M. Schulz and A. G. Sykes, J. Org. Chem., 2011, 76, 7866–7871 CrossRef CAS PubMed.
- (a) Z. Jian-Min, Z. Qian-Shou and C. Chun-Feng, J. Org. Chem., 2010, 75, 5092–5098 CrossRef PubMed; (b) D. Yun, E. Cho, S. D. Dindulkar and S. Jung, Macromol. Mater. Eng., 2016, 301, 805–811 CrossRef CAS.
- (a) A. Shailini, P. Barrie, B. Graeme, H. Kimberly and R. Malcolm, Anal. Chim. Acta, 2009, 653, 191–199 CrossRef PubMed; (b) G. Huelga-Suarez, M. Moldovan, A. Garcia-Valiente, E. Garcia-Vazquez and J. I. Garcia Alonso, Anal. Chem., 2012, 84, 127–133 CrossRef CAS PubMed; (c) G. Huelga-Suarez, B. Fernández, M. Moldovan and J. I. Garcia Alonso, Anal. Bioanal. Chem., 2013, 405, 2901–2909 CrossRef CAS PubMed.
- S. V. Chikineva, V. P. Kovaleva and N. V. Gladyshev, J. Anal. Chem., 2001, 56, 449–452 CrossRef.
- P. Hooshang and F. Abbas, Anal. Sci., 2000, 16, 575–577 CrossRef.
- (a) A. Majzik, L. Füllöp, E. Csapó, D. Sebök, T. Martinek, F. Bogár, B. Penke and I. Dékány, Colloids Surf., B, 2010, 81, 235–241 CrossRef CAS PubMed; (b) E. Priyadarshini and N. Pradhan, Sens. Actuators, B, 2017, 238, 888–902 CrossRef CAS.
- A. Szalai, A. Sipos, E. Csapó, L. Tóth, M. Csete and I. Dékány, Plasmonics, 2013, 8, 53–62 CrossRef CAS.
- M. S. Han, A. K. R. Lytton-Jean, B. K. Oh, J. Heo and C. A. Mirkin, Angew. Chem., 2006, 45, 1807–1810 CrossRef CAS PubMed.
- T. Lou, Z. Chen, Y. Wang and L. Chen, ACS Appl. Mater. Interfaces, 2011, 3, 1568–1573 CAS.
- L. J. Miao, J. W. Xin, Z. Y. Shen, Y. J. Zhang, H. Y. Wang and A. G. Wu, Sens. Actuators, B, 2013, 176, 906–912 CrossRef CAS.
- F. Zhang, L. Zeng, Y. Zhang, H. Wang and A. Wu, Nanoscale, 2011, 3, 2150–2154 RSC.
- M. S. Yavuz, G. C. Jensen, D. P. Penaloza, T. A. P. Seery, S. A. Pendergraph, J. F. Rusling and G. A. Sotzing, Langmuir, 2009, 25, 13120–13124 CrossRef CAS PubMed.
- I. Abdulhalim, M. Zourob and A. Lakhtakia, Electromagnetism, 2008, 28, 214–242 CrossRef.
- T. Lou, L. Chen, Z. Chen, Y. Wang, L. Chen and J. Li, ACS Appl. Mater. Interfaces, 2011, 3, 4215–4220 CAS.
- J. Du, L. Jiang, Q. Shao, X. Liu, R. S. Marks, J. Ma and X. Chen, Small, 2013, 9, 1467–1481 CrossRef CAS PubMed.
- H. Li and L. Rothberg, Proc. Natl. Acad. Sci. U. S. A., 2004, 101, 14036–14039 CrossRef CAS PubMed.
- C. S. Tsai, T. B. Yu and C. T. Chen, Chem. Commun., 2005, 4273–4275 RSC.
- Z. Sun, Z. Cui and H. Li, Sens. Actuators, B, 2013, 183, 297–302 CrossRef CAS.
- Y. M. Sung and S. P. Wu, Sens. Actuators, B, 2014, 201, 86–91 CrossRef CAS.
- M. C. Daniel and D. Astruc, Chem. Rev., 2004, 104, 293–346 CrossRef CAS PubMed.
- S. P. Wu, Y. P. Chen and Y. M. Sung, Analyst, 2011, 136, 1887–1891 RSC.
- (a) Z. Jia, W. Yong, X. Xiaowen and Y. Xiurong, Analyst, 2011, 136, 3865–3868 RSC; (b) B. Lian-Yang, Z. Yu-Ping, C. Na, C. Jun, Z. Xia-Mao and H. Lin-Feng, Micro Nano Lett., 2011, 6, 337–341 CrossRef; (c) K. Shrivas, P. Maji and K. Dewangan, Spectrochim. Acta, Part A, 2017, 173, 630–636 CrossRef CAS PubMed.
- (a) H. Li, L. Zhang, Y. Yao, C. Han and S. Jin, Supramol. Chem., 2010, 22, 544–547 CrossRef CAS; (b) X. Wu, W. Tang, C. Hou, C. Zhang and N. Zhu, Microchim. Acta, 2014, 181, 991–998 CrossRef CAS.
- F. Zhang, Y. Zhou, Y. Chen, Z. Shi, Y. Tang and T. Lu, J. Colloid Interface Sci., 2010, 351, 421–426 CrossRef CAS PubMed.
- I. Ojea-Jiménez and J. M. Campanera, J. Phys. Chem. C, 2012, 116, 23682–23691 Search PubMed.
- J. Kimling, M. Maier, B. Okenve, V. Kotaidis, H. Ballot and A. Plech, J. Phys. Chem. B, 2006, 110, 15700–15707 CrossRef CAS PubMed.
- S. C. D'Andre and A. Y. Fadeev, Langmuir, 2003, 19, 7904–7910 CrossRef.
- E. S. Gawalt, G. Lu, S. L. Bernasek and J. Schwartz, Langmuir, 1999, 15, 8929–8933 CrossRef CAS.
- W. E. Ford, F. Abraham, F. Scholz, G. Nelles, G. Sandford and F. Von Wrochem, J. Phys. Chem. C, 2017, 121, 1690–1703 CAS.
- S. A. Paniagua, P. J. Hotchkiss, S. C. Jones, S. R. Marder, A. Mudalige, F. S. Marrikar, J. E. Pemberton and N. R. Armstrong, J. Phys. Chem. C, 2008, 112, 7809–7817 CAS.
- M. Matzapetakis, N. Karligiano, A. Bino, M. Dakanali, C. P. Raptopouluo, V. Tangoulis, A. Terzis, J. Giapintzakis and A. Salifogluo, Inorg. Chem., 2000, 39, 4044–4051 CrossRef CAS PubMed.
- (a) S. Aryal, B. K. C. Remant, N. Dharmaraj, N. Bhattarai, C. H. Kim and H. Y. Kim, Spectrochim. Acta, Part A, 2006, 63, 160–163 CrossRef PubMed; (b) V. Lupusoru, D. A. Pricpo, M. Andries and D. Creanga, J. Mol. Struct., 2016, 1126, 192–199 CrossRef.
- P. Fiurasek and L. Reven, Langmuir, 2007, 23, 2857–2866 CrossRef CAS PubMed.
- S. D. Techane, L. J. Gamble and D. G. Castner, J. Phys. Chem., 2011, 115, 9432–9441 CAS.
- M. R. Ivanov and A. J. Haes, Anal. Chem., 2012, 84, 1320–1326 CrossRef CAS PubMed.
- Y. Guo, Z. Wang, H. Shao and X. Jiang, Carbon, 2013, 52, 583–589 CrossRef CAS.
- W. W. Yang, Y. Y. Di, Y. X. Kong, Y. F. Zhu and Z. C. Tan, J. Chem. Eng. Data, 2009, 54, 2038–2044 CrossRef CAS.
- (a) K. Latham, K. F. White, K. B. Szpakolski, C. J. Rix and J. M. White, Inorg. Chim. Acta, 2009, 362, 1872–1886 CrossRef CAS; (b) D. Saha, T. Maity, R. Sen and S. Koner, Polyhedron, 2012, 43, 63–70 CrossRef CAS; (c) Z. P. Wang, B. Hu, X. H. Qi, N. N. Shen and X. Y. Huang, Dalton Trans., 2016, 45, 8745–8752 RSC.
- D. Su, X. Yang, Q. Xia, F. Chai, C. Wang and F. Qu, RSC Adv., 2013, 3, 24618–24624 RSC.
- X. Han, J. Goebl, Z. Lu and Y. Yin, Langmuir, 2011, 27, 5282–5289 CrossRef CAS PubMed.
- R. Pamies, J. G. Hernández Cifre, V. Fernández Espín, M. Collado-González, F. G. Díaz Baños and J. García de la Torre, J. Nanopart. Res., 2014, 16, 2376 CrossRef.
- M. A. Escudero Francos, R. Badíal Laíño and M. E. Díaz-García, Microchim. Acta, 2015, 182, 1591–1598 CrossRef.
- M. V. Zyuzin, T. Honold, S. Carregal-Romero, K. Kantner, M. Karg and W. J. Parak, Small, 2016, 12, 1723–1731 CrossRef CAS PubMed.
- S. Volden, A. L. Kjøniksen, K. Zhu, J. Genzer, B. Nyström and V. R. Glomm, ACS Nano, 2010, 4, 1187–1201 CrossRef CAS PubMed.
Footnote |
| † Electronic supplementary information (ESI) available: Fig. S1–S8 [(S1) Absorbance ratio (A625/A530) of AuNPs–MPA in the presence of metal ions. Blue bars represent the addition of single metal ion (100 μM); red bars represent the mixture of Ba2+ (100 μM) with another metal ion (100 μM). (S2) IR spectra functionalized AuNPs–MPA and AuNPs–MPA detecting Ba2+ ions, (S3) UV-Vis spectra of AuNPs–citrate and AuNPs–citrate–Ba2+, (S4) TEM image of AuNPs–MPA evaluated at pH 3, (S5) effect of reaction time on the absorption ratio A625/A530 for AuNPs–MPA system in the presence of various concentrations of Ba2+ (S6) UV-Vis spectra of AuNPs–MPA detecting Ba2+ ions in drinking water and tap water, (S7) colorimetric response of drinking water and tap water, (S8) the linearity curve of the ratio of A625/A530 versus Ba2+ concentration drinking water and tap water]. See DOI: 10.1039/c7ra03861e |
| This journal is © The Royal Society of Chemistry 2017 |