 Open Access Article
Creative Commons Attribution 3.0 Unported Licence
Preparation and characterization of click-driven N-vinylcarbazole-based anion exchange membranes with improved water uptake for fuel cells†
Abhishek N. Mondal,
Yubin He,
Liang Ge,
Liang Wu,
Kamana Emmanuel,
Md. Masem Hossain and
Tongwen Xu *
*
CAS Key Laboratory of Soft Matter Chemistry, Collaborative Innovation Center of Chemistry for Energy Materials, School of Chemistry and Material Science, University of Science and Technology of China, Hefei 230026, PR China. E-mail: twxu@ustc.edu.cn; Fax: +86-551-63602171; Tel: +86-551-63601587
First published on 7th June 2017
Abstract
A novel side-chain-type anion exchange membrane (AEM) is synthesized using thiol-ene click chemistry and the Menshutkin reaction. The prepared membranes are fully characterized and successfully mitigate the trade-off between conductivity and water uptake. Side-chain-type polymer electrolyte membranes with moderate hydroxide conductivity and improved water uptake are obtained. The thiol-ene click reaction is employed for the synthesis of active monomer 9-(2-((3-(triethoxysilyl)propyl)thio)ethyl)-9H-carbazole (TESPTEC). Using the Menshutkin reaction, TESPTEC is introduced into the brominated poly(2,6-dimethyl-1,4-phenylene oxide) (BPPO) backbone. The NVC-50 membrane shows a maximum hydroxide conductivity of 19.84 ± 1.81 mS cm−1 at 20 °C, and 54.69 ± 2.91 mS cm−1 at 60 °C. However, at 20 °C, the water uptake of the membrane NVC-50 is only about 18.36 wt%. After 12 days of alkaline treatment, the NVC-50 membrane shows better alkaline stability than the conventional QPPO membrane.
Introduction
Fuel cells are recognized as effective energy transformation devices that can easily produce electricity from the chemical energy stored inside fuels.1 Fuel cell technology is considered a potential solution to efficiently overcome the rising demand for energy worldwide, while also having a positive impact on the environment.2–4 Attractive features, such as a high energy density and low temperature operation, are additional advantages of proton exchange membrane fuel cells (PEMFCs).2,3 PEMFCs are promising for application to portable energy conversion devices and vehicles.1,4 Presently, Nafion membrane (with its comb-shaped perfluorinated sulfonic acid-containing architecture) is widely used in PEMFC applications as a superior proton exchange membrane (PEM).5 High conductivity, reasonable water uptake, excellent mechanical properties, and outstanding chemical stability make Nafion membrane a promising choice for good PEMFC performance and sustainability.5,6 However, in an acidic PEMFC environment, few noble metals (particularly platinum) can perform as stable and efficient catalysts for reactions occurring inside the electrode.1,7 Therefore, the major obstacle to the widespread application of PEMFCs turns out to be the scarcity and cost of the catalysts.7 Metal catalysts belonging to non-Pt groups are effective and stable under PEMFC conditions and, therefore, can serve as a solution to existing cost-related problems.8,9 However, aromatic backbone-based proton conducting chemically stable membranes are attracting attention as PEMFC candidates instead of Nafion.1Anion exchange membrane fuel cells (AEMFCs) has been proposed as a potential alternative to PEMFCs due to attractive inherent features that are absent in PEMFCs, such as the ability to use non-precious metal catalysts instead of platinum at high pH for oxygen reduction, water management, faster fuel oxidation, and low cost. These benefits have resulted in AEMFCs receiving the majority of research interest.10–14 Moreover, electrochemical devices that use AEMs can significantly prevent the leakage of eroding fuels and carbonate precipitation.15,16 Recently, much effort has been devoted towards AEMFC technology, with most focus on the fabrication of superior AEMs with high hydroxide conductivity.17–19 However, the main challenges restricting the further development of AEMFC technology are alkaline stability and poor hydroxide conductivity. Improving the stability of both cationic head groups and the main polymer backbone is key to making AEMs durable. AEMs with rigid poly(phenylene oxide),20,21 polysulfone,22–24 and poly(ether ketone)25 backbones and phosphonium,23 quaternary ammonium (QA),26 and imidazolium27 type head groups are common. Nevertheless, traditional AEMs have shown inferior qualities in terms of water uptake and conductivity. Therefore, hydroxide conductivity and the swelling ratio dilemma have become the major technical challenges in AEMFCs development.
In the last decade, numerous strategies have been employed to overcome conductivity related issues, which can be classified into two broad categories: (i) polymer architecture with tailor-made nanophase segregation and (ii) new materials with improved anion-conducting capabilities.28 A superior anion-exchange membrane must have high hydroxide conductivity (not less than 100 mS cm−1), chemical stability, alkaline resistance, and dimensional stability to be appropriate for use in practical AEMFC applications.29 Typically, AEMs should have high charge density, as hydroxide ions possess less mobility than the protons. Therefore, to enhance the charge densities inside AEMs, high ion exchange capacity (IEC) values are necessary. However, increasing the IEC (associated with high water uptake) interferes with the dimensional durability of the membrane.17 This trade-off has compelled us to develop a new strategy to provide suitable AEMs with high conductivities and reasonably low water uptake. Accordingly, we have mainly focused on thiol-ene click-based monomers because the click reaction versatile and the monomers can be easily incorporated into the polymer backbone to achieve the desired results.
After its introduction in 2001, click chemistry has continued to be appealing in synthetic research areas because of its tolerance of a large variety of functional groups, fast reaction kinetics, and ability to proceed at ambient temperature.30–34,38 Additionally, photo-driven click reactions afford novel materials with a comprehensive range of tunable properties. Click reactions can even produce different block copolymers,35 hyperbranched polymers,36 and dendrimers.37 Among the different types of click reaction, photo-driven thiol-ene click chemistry is appealing in a broad range of synthetic chemistry because hydrogen–sulfur bonds are responsive to a variety of click reaction types.38,39 The basic reaction mechanism operating during UV-assisted click reactions is shown in Scheme 1(A).
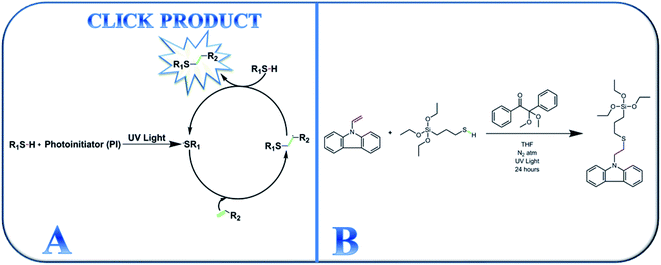 | ||
| Scheme 1 (A) Schematic representation of the thiol-ene click chemistry mechanism and (B) synthesis of the active thiol-ene click-mediated monomer (TESPTEC). | ||
In this study, we report the photomediated thiol-ene click reaction of N-vinylcarbazole (NVC) and (3-mercaptopropyl)triethoxysilane (MPTES), in the presence of photoinitiator 2,2-dimethoxy-2-phenylacetophenone, for the preparation of active monomer 9-(2-((3-(triethoxysilyl)propyl)thio)ethyl)-9H-carbazole (TESPTEC). MPTES was selected as the silica source because the silica-based network inside the membrane can efficiently reduce water uptake.40 In the next step, aided by the Menshutkin reaction, TESPTEC was introduced into brominated poly(2,6-dimethyl-1,4-phenylene oxide) and converted into a thin film. The novelty of this work lies in the AEM architectures, in which the membranes possess low water uptake. Furthermore, the conductivity obtained using the prepared AEMs was satisfactory for use in fuel cells. The TESPTEC loading amount inside the membrane structure was varied, and its influence on membrane integral properties, such as conductivity, water uptake, and IEC, was systematically explored.
Experimental section
Materials
Brominated poly(2,6-dimethyl-1,4-phenylene oxide) (BPPO), comprising 52% benzyl bromination and 48% aryl bromination, was obtained from Tianwei Membrane Co., Ltd. (Shandong, China). The commercial BPPO membrane was purified according to a reported method.41 N-Vinylcarbazole (NVC) with 98% purity was supplied by Aladdin Chemical (Shanghai, China). 2,2-Dimethoxy-2-phenylacetophenone (DMPA) and (3-mercaptopropyl)triethoxysilane (MPTES) were obtained from Energy Chemical Co., Ltd. (Shanghai, China). Additional reagents, such as N-methyl-2-pyrrolidone (NMP), tetrahydrofuran (THF), and sodium hydroxide, were purchased from Sinopham Chemical Reagent Co., Ltd. (Shanghai, China). Reagents in this work were of analytical grade and used without further purification. Deionized (DI) water was used throughout the experiments.Synthesis of TESPTEC
The synthetic route for preparing thiol-ene click-mediated monomer TESPTEC is shown in Scheme 1(B). In a nitrogen-filled glove box, NVC (0.5 g, 26 mmol) and MPTES (0.62 g, 26 mmol) were added to a 10 mL dry round bottom flask. Dry THF (3 mL) was then carefully added and the mixture was vigorously stirred until the reactants had completely dissolved. Next, a stock solution of photoinitiator DMPA (0.019 g, 0.078 mmol) in THF (2 mL) was added swiftly to the solution. To initiate the thiol-ene click reaction, the reaction mixture was removed from the glove box and cured under UV light for 24 h at 25 °C. During the reaction, the solution changed from transparent white to pale yellow, as shown in Fig. S1 (ESI†). After 24 h, the solvent was removed in vacuo and the desired product, TESPTEC, was afforded as a pale yellow liquid (1.0572 g, 95% yield with respect to NVC). 1H NMR, 29Si NMR, mass and FTIR spectra were measured to confirm the product chemical structure. 1H NMR (CDCl3, 400 MHz): δ 8.08 (d, 2H), 7.40 (m, 4H), 7.20 (m, 2H), 4.45 (t, 2H), 3.79 (q, 6H), 2.88 (t, 2H), 2.55 (t, 2H), 1.70 (m, 2H), 1.21 (t, 9H), 0.70 (t, 2H) ppm; 29Si NMR (CDCl3): δ −45.9 (s) ppm; HR-MS (ESI) calculated for C23H33O3NSSi [M + Na]+: 454.184; found: 454.183.General procedure for the synthesis of TESPTEC-based AEMs
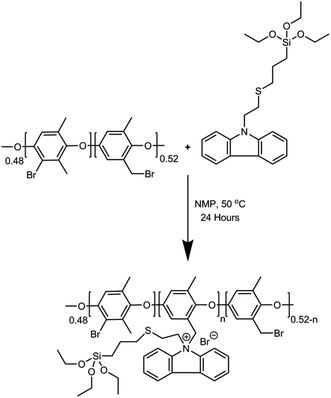
TESPTEC-based AEMs were prepared via multiple steps, which involved a solution casting technique, as shown in Scheme 2. A detailed typical membrane preparation is described below. First, BPPO (1 g) was carefully dissolved in NMP (10 mL) at room temperature in a 25 mL round bottom flask. Separately, a suitable quantity of TESPTEC was dissolved in NMP (1.5 mL). This TESPTEC stock solution was then added slowly to the stirred BPPO solution. Immediately after the addition, the reaction temperature was raised to 50 °C and stirring was continued for 24 h. The reaction mixture was then poured into cold water and the synthesized polymer was obtained by filtration. The prepared polymer was cautiously washed several times with diethyl ether, followed by drying under vacuum for 24 h. Finally, the vacuum-dried polymer was redissolved in NMP to form an 8% (w/v) solution, which was then cast on a clean glass plate and dried at 80 °C for 24 h to obtain a transparent thin film. The fabricated membranes were denoted as NVC-X, where X is the loading weight percentage of TESPTEC inside the BPPO backbone, ranging from 10–50 wt%, as shown in Table 1. The as-prepared brominated membranes were converted to the corresponding OH− form by immersion in aqueous NaOH (1 M) solution at room temperature for 24 h. Afterward, the membranes were removed and washed carefully with DI water to remove any trace amounts of NaOH. For comparison, we used QPPO quaternized poly(2,6-dimethyl-1,4-phenylene oxide) membrane, as reported in our previous study.57| Membrane code | BPPO (wt%) | TESPTEC of BPPO (wt%) | WR (wt%) | LSR (%) | IECTheo (mmol g−1) | IECExp (mmol g−1) | Conductivity (mS cm−1) at 20 °C |
|---|---|---|---|---|---|---|---|
| NVC-10 | 8% | 10% | 5.69 ± 0.74 | 2.4 | 0.20 | 0.11 ± 0.01 | 5.73 ± 0.75 |
| NVC-20 | 8% | 20% | 8.59 ± 1.38 | 2.5 | 0.37 | 0.25 ± 0.01 | 6.11 ± 0.77 |
| NVC-30 | 8% | 30% | 10.28 ± 0.50 | 3.6 | 0.52 | 0.40 ± 0.02 | 8.71 ± 0.96 |
| NVC-40 | 8% | 40% | 13.08 ± 1.40 | 4.3 | 0.65 | 0.52 ± 0.01 | 13.39 ± 1.44 |
| NVC-50 | 8% | 50% | 18.36 ± 0.75 | 5.6 | 0.76 | 0.61 ± 0.01 | 19.84 ± 1.81 |
Membrane characterization
X-ray photoelectron spectroscopy (XPS) was performed using an ESCALAB 250 instrument fortified with a monochromated Al Kα source (pass energy, 30 eV) to confirm the surface elemental composition of the parent BPPO and synthesized membrane. NMR spectra were measured using an AV III 400 NMR spectrometer (400 MHz, Bruker) using CDCl3 as solvent containing tetramethylsilane as an internal reference. FTIR spectra of the synthesized TESPTEC material and the dried membranes were recorded using the attenuated total reflectance (ATR) technique on a Vector 22 FTIR spectrometer (Bruker) with a resolution of 2 cm−1 and a total spectral range of 4000–400 cm−1.TGA of the prepared membranes was carried out using a Shimadzu TGA-50H analyzer in the temperature range 20–800 °C under nitrogen flow, with a constant heating rate of 10 °C min−1.
Tapping-mode atomic force microscopy (AFM) observations were obtained with a Veeco diInnova SPM, using microfabricated cantilevers with a force constant of approximately 20 N m−1. Morphological characterization of the prepared membranes was achieved using field emission scanning electron microscopy (FE-SEM, Sirion200, FEI Company, USA). Surface and cross-sectional views were obtained from dry membranes. SEM images of all prepared membranes were provided as a representative case.
Water uptake (WR), linear swelling ratio (LSR) & ion exchange capacity (IEC)
Water uptake (WR) and its temperature dependency were measured in a similar fashion to that described in our previous report.40 Linear swelling ratio was also measured according to our previously reported protocol.41 IEC was determined using the classical Mohr method, following the standard procedure described elsewhere.42Hydroxide conductivity
A standard four-point probe technique was utilized to determine the hydroxide conductivity of the prepared membranes. A procedure for determining membrane ionic conductivity was the same as previously reported by our research group.42 Ionic conductivity (κ) was determined for the prepared membranes using the equation below:
 | (1) |
Alkaline stability
To determine the membrane alkaline stability, membrane samples were first cut to a suitable size (4 × 1 cm2) and dipped inside aqueous NaOH (1 M) solution at 60 °C for different periods. After each specified period, the membrane samples were removed from NaOH solution and dipped into DI water for 24 h with vigorous washing to remove final traces of NaOH. The membrane hydroxide conductivity was then measured again and compared with the initial value.Results and discussion
Synthesis and spectral characterization of TESPTEC and related NVC-X AEMs
This study reports a classical UV-assisted thiol-ene click reaction for the synthesis of pro-active TESPTEC materials. A Menshutkin reaction was also performed to react TESPTEC with parent brominated poly(2,6-dimethyl-1,4-phenylene oxide) (BPPO). The resulting Menshutkin reaction mixture was precipitated in water and washed vigorously to afford the polyelectrolyte, which was further vacuum dried and dissolved in NMP to produce a clear homogeneous solution. Afterwards, this solution was converted into a thin film using the solution casting technique.The synthesis of TESPTEC employed the active combination of silica-based thiol MPTES with the nitrogen based aromatic backbone containing monomer NVC and photoinitiator DMPA (Scheme 1(B)).
The thiol-ene reaction is a well-known click reaction usually triggered via a free-radical supported mechanism, with the assistance of photoinitiation by a suitable photoinitiator (PI) to produce radicals from thiols.43 As such, we chose DMPA as an active PI to initiate the click reaction between silica-based thiol MPTES and NVC. Silica functionalized carbazole-based monomer TESPTEC was synthesized using a facile method in high yield. Over time the reaction mixture was observed to gradually change from colourless to pale yellow, as verified in Fig. S1 (ESI†). 1H NMR spectroscopy was used to determine the chemical structure of the clicked TESPTEC compound, as denoted in Fig. 1. The 1H NMR spectra related to NVC, MPTES, and TESPTEC, shown in Fig. 1, aid understanding of the differences between the chemical shifts of TESPTEC and of the monomers used. Initially, DMPA was first UV triggered, with this photoinitiation producing radicals from MPTES (representative thiol). In the propagation stage, the thiyl radical generated from MPTES coming into contact with NVC (representative ene) produced a carbon-centered radical, which can propagate through the ene moiety (NVC here).34 Finally, in the chain transfer phase, the carbon-centered radical abstracts a hydrogen radical from the thiol (3-mercaptopropyl)triethoxysilane here to produce the desired product, TESPTEC.34
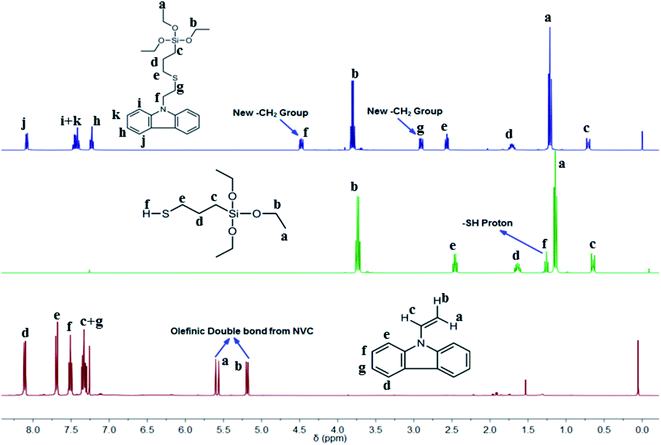 | ||
| Fig. 1 Comparative study of 1H NMR spectra of synthesized clicked monomer TESPTEC (top), MPTES (middle), and NVC (bottom). | ||
The 1H NMR spectra in Fig. 1 show the spectral differences between the monomers used and the obtained product, TESPTEC. TESPTEC showed two new methylene peaks (δ 4.48 ppm, t, 2H; 2.92 ppm, t, 2H) after the reaction, which were considered good evidence of the successful thiol-ene click reaction of NVC and MPTES. These two new methylene peaks were absent before the reaction in both monomers. Another significant observation was the disappearance of the olefinic double bond proton signals (δ 7.29 ppm, q, 1H; 5.56 ppm, d, 1H; 5.17 ppm, d, 1H) from NVC, and the thiol proton (–S–H; δ 1.26 ppm, t, 1H) from MPTES. These observations clearly indicated that, in the presence of DMPA (PI), the thiol-ene click reaction occurred and the anticipated product, TESPTEC, was formed. The chemical shifts of other protons in TESPTEC follow the predicted trend. Peaks at 7.25, 7.45, and 8.08 ppm were assigned to aromatic protons in TESPTEC. The presence of –Si–CH2 protons was observed at 0.71 ppm. Chemical shifts at 3.81 ppm and 1.21 ppm represent the –CH2 protons and methyl protons, respectively, associated with –Si–O–CH2–CH3 in the TESPTEC backbone. The remaining methylene protons shift was in good agreement with the chemical structure of TESPTEC. Therefore, the chemical structure of TESPTEC was verified by 1H NMR spectroscopy.
To confirm the presence of silica in the as-prepared TESPTEC, 29Si NMR analysis was performed. As shown in the spectrum in Fig. S2 (ESI†), the distinct peak at −45.9 ppm was attributed to the silicon atom present in the TESPTEC structure. Importantly, the presence of silica in TESPTEC proved that it was formed by the successful click reaction of NVC and MPTES.
The TESPTEC chemical structure was further interpreted using FTIR spectroscopy for comprehensive discussion. Fig. S3 (ESI†) shows the IR spectrum of the clicked product, TESPTEC, with characteristic bands at the anticipated wavelengths. The sharp intensity multi-headed band at around ∼2960 cm−1 was assigned to –CH2 groups (ν) in the TESPTEC backbone.44 The aromatic C–H stretching frequency was observed as a sharp peak at around ∼3030 cm−1.44 Out-of-plane aromatic C–H bending was also clearly visible as a sharp intense band at 745 cm−1.45 The presence of an Si–O bond inside the TESPTEC structure was confirmed by a strong characteristic sharp band at around ∼1050 cm−1.46 Additionally, typical sharp intensity bands at around 1244 cm−1 and 785 cm−1 provided evidence of a Si–C (δ and ν) bond in TESPTEC.43
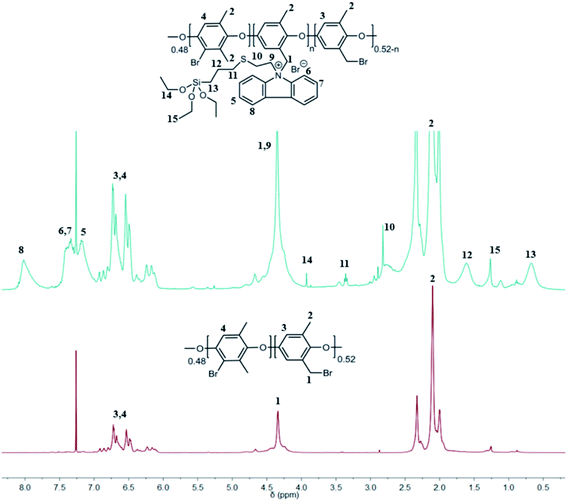
In general, for all NVC-X membranes, the classical Menshutkin reaction was performed in NMP with BPPO, and the amount of TESPTEC varied. Fig. 2 clearly shows the difference between 1H NMR spectra for both parent unmodified BPPO and TESPTEC-modified BPPO (NVC-30 considered as the typical case). The 1H NMR spectrum of NVC-30 was recorded using the dry polymer before redissolving in NMP to fabricate the desired thin film. Notably, the 1H NMR spectrum of NVC-30 looked promising in comparison with that of parent BPPO. The aromatic proton region in NVC-30 showed newly formed peaks (δ 7.17 ppm, 7.41 ppm, and 8.01 ppm) compared with pristine unmodified BPPO. Additionally, unlike BPPO, Si–CH2 and Si–O–CH2–CH3 protons were clearly present in the NVC-30 spectrum. This observation confirmed that pristine BPPO was modified with TESPTEC.
Fig. 3 shows a comparison of ATR-FTIR spectra for BPPO and NVC-50 membranes. These ATR-FTIR spectra clearly show the dissimilarity between BPPO and NVC-50 membranes, regarding the presence of bands related to –Si–O–Si, –Si–O–C stretching, and quaternary nitrogen present in the NVC-50 matrix. The presence of both –Si–O–Si and anti-symmetric –Si–O–C stretching in the NVC-50 membrane was confirmed by a strong characteristic absorption band at around 1040–1150 cm−1, which was absent in the parent BPPO membrane.40,47 Notably, the –Si–O–Si stretching signal indicated that silica-based crosslinking was viable in the NVC-50 membrane matrix.40 Moreover, unlike in BPPO, the NVC-50 membrane showed a typical sharp band at around ∼1220 cm−1, which provided evidence of a C–N bond.16 Furthermore, the absorption peak at around ∼2960 cm−1 was attributed to –CH2 groups (ν) inside both the NVC-50 membrane and unmodified BPPO.44 However, a quaternary ammonium group in the NVC-50 membrane was confirmed by the sharp peak at around ∼1660 cm−1.47 This sharp band was absent in the parent unmodified BPPO, providing adequate evidence of the quaternization of pristine BPPO by TESPTEC.
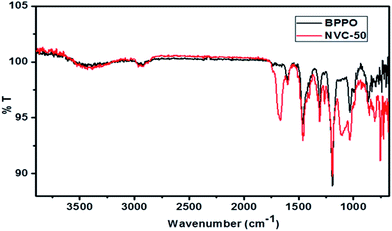 | ||
| Fig. 3 ATR-FTIR spectra of synthesized membrane NVC-50 in comparison with that of parent unmodified BPPO membrane. | ||
XPS analysis
XPS spectra for both unmodified BPPO and TESPTEC-modified BPPO (NVC-50 taken as a typical case), as shown in Fig. 4, were used to determine the surface elemental composition. Fig. 4(A) shows survey spectra for both modified and unmodified membranes, while Fig. 4(B) shows the high-resolution spectrum of the N 1s region for the NVC-50 membrane. For parent unmodified BPPO, all expected elements were observed, including bromine, oxygen, and carbon, while the NVC-50 membrane showed nitrogen, sulfur, and silicon in addition to bromine, oxygen, and carbon.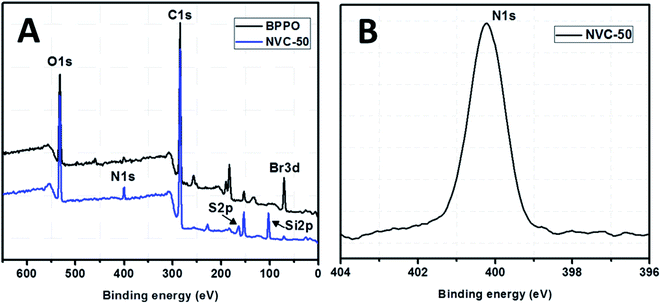 | ||
| Fig. 4 (A) XPS survey spectra of parent commercial unmodified BPPO membrane and reference synthesized membrane NVC-50. (B) High-resolution XPS spectra of N 1s region for NVC-50 membrane. | ||
These observations were promising and indicative. The peak at around 399.5 eV in Fig. 4(B) clearly shows that nitrogen is present in the quaternary state.48 Interestingly, this peak was absent in the parent unmodified BPPO membrane. This showed that the tertiary nitrogen atom present in the TESPTEC backbone had reacted with the –CH2Br group in BPPO to form a quaternized nitrogen in the NVC-50 membrane. In Fig. 4(A), the intensity of the Br peak decreased from BPPO to NVC-50, while the quaternized nitrogen peak was newly formed in the NVC-50 membrane. This result supported the incorporation of TESPTEC into BPPO, leading to the gradual consumption of –CH2Br groups and forming of a new quaternized nitrogen in NVC-50 via the Menshutkin reaction. Furthermore, sulfur was confirmed to be in the thioether (R–S–R) state in the NVC-50 membrane by the signal (2p electron) at around 163.5 eV.1 A sharp signal (binding energy, 102.5 eV) was also observed for Si 2p electrons in NVC-50 that was totally absent in unmodified BPPO. Overall, the XPS survey spectra of unmodified BPPO and NVC-50 were different, suggesting that BPPO was modified by TESPTEC via the Menshutkin reaction.
Water uptake (WR), linear swelling ratio (LSR) and ion exchange capacity (IEC)
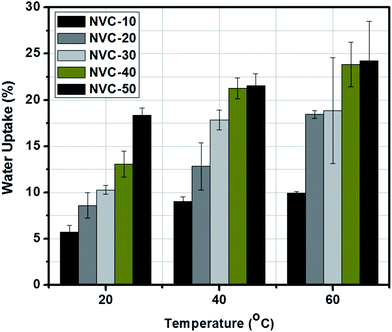
Water uptake (WR) is an imperative parameter in any ion exchange membrane and has remarkable influence on membrane-based applications.40,49 For ion transport to be viable, the presence of water molecules inside the polymer matrix is essential.50 However, the thermal, mechanical, and dimensional stabilities of any membrane can be prejudiced by a large volume fraction of water residing inside the polymer matrix.50The water uptake and conductivity appear to be the major obstacles to development of high-performance anion exchange membranes.1 AEMs need low water uptakes (less than 30 wt%) and reasonable conductivity (at least 10 mS cm−1) to be operative in fuel cell applications.51 Herein, using water uptake (WR) values, the hydrophilic nature of the NVC-X membranes was assessed. When gradually increasing the TESPTEC content from NVC-10 to NVC-50, we observed that the water uptake values also gradually increased. The development of improved hydrophilic domains was considered responsible for the gradually increasing water uptake.
The membrane matrix mostly contains three different types of water, categorized as free water, freezing bound water, and non-freezing bound water.50 According to the Eikerlings theory, it is fairly evident that bulk and bound water mostly resides inside charged ion-exchange membranes (IEMs).52 However, to solvate any of the ionic groups, bound water is essential, whereas the void volume is filled with bulk water.50
Fig. 5 shows that the NVC-50 membrane possesses a maximum water uptake of 18.36 wt%. In contrast, NVC-10 showed a lower water uptake of 5.69 wt%. By looking carefully at the membrane structure, we can witness the presence of silica in the membrane matrix. The active presence of silica can be treated as a crucial factor in membrane compactness. With gradually increasing functionality from membrane NVC-10 to NVC-50, the water uptake increased. At an elevated temperature (60 °C), the maximum water uptake for membrane NVC-50 was within the limit of 24.24 wt%. This observation suggested that with increasing temperature, from 20 °C to 60 °C, the water uptake of the NVC-50 membrane gradually increased. All other prepared membranes also showed higher water uptakes at elevated temperatures above 20 °C. Notably, when comparing the QPPO membrane with the NVC-X membranes, we observed that the QPPO membrane showed 125 wt% water uptake at 20 °C.57 Therefore, our prepared NVC-X membranes possessed much lower water uptake than the conventional QPPO membrane. Furthermore, water retention ability was assumed to play be an important characteristic of any AEM as a transport medium for hydroxide ions, although excessive swelling could lower the mechanical stability and dimensional strength of the membranes.51
For further elucidation, the linear swelling ratios (LSR) of the prepared membranes were measured, as shown in Table 1. The LSR gradually increased from NVC-10 to NVC-50, and ranged between 2.4 and 5.6%. This result indicated that the prepared membranes possessed lower dimensional swelling, which was beneficial for fuel cell applications. Additionally, the LSR values are better than those of previously published results.41,42
The concentration of functional groups inside the membrane matrix determined the IEC value. The IEC of anion exchange membranes is the decisive parameter for selectivity in fuel cell applications.53 Therefore, IEC measurements were performed to evaluate the charged nature of the prepared AEMs. The Mohr method was used to assess the IEC of our prepared AEMs. Table 1 shows that the IEC values gradually increase from membrane NVC-10 to NVC-50. This observed trend was easily explained as follows. Incorporation of more TESPTEC into the polymer matrix (BPPO) gave rise to a higher number of charged sites. Therefore, as the amount of TESPTEC in BPPO matrix increased (from NVC-10 to NVC-50), the IEC value also gradually increased. Notably, the NVC-50 membrane showed the highest IEC (0.61 ± 0.01 mmol g−1) among the membranes. The IEC values for all prepared membranes were in the range 0.11–0.61 mmol g−1. The introduction of TESPTEC into the BPPO backbone produced quaternary ammonium groups in the membrane matrix and enhanced the hydrophilicity of the membranes. Quaternary ammonium groups are hydrophilic in nature, and therefore introducing the group was believed to significantly promote higher hydrophilicity in the membrane matrix. Therefore, the IEC value followed an ascending trend from membrane NVC-10 to NVC-50.
Thermal stability of prepared TESPTEC-based NVC-X AEMs
The thermal stability of the prepared membranes was evaluated using thermogravimetric analysis (TGA) under a nitrogen atmosphere. Fig. S4(A) (ESI†) shows the TGA diagram for all prepared TESPTEC-based NVC-X membranes. In general, the weight loss pattern for all prepared membranes (NVC-10 to NVC-50) could be divided into multiple steps over the whole temperature range (20–800 °C). Specifically, the weight loss pattern for each step looked similar for each membrane. Notably, the membrane thermal stability can be explained using two prime features: the decomposition temperature and the residual weight percentage. The first step of weight loss, at around ∼100 °C, was attributed to the evaporation of hydrated and bound water associated with the quaternary ammonium groups.54 The second stage of degradation process, with typical weight loss t around ∼170 °C, was attributed to the degradation of the quaternary ammonium groups in the membrane matrix.54 The third step of weight loss correlated with the debromination phase, and started at ∼230 °C.42 Finally, the weight loss observed after 380 °C was attributed to degradation of the main aromatic backbone.42 From these observations, we concluded that our prepared membranes were thermally stable in the operation temperature range of fuel cell applications (60–80 °C).The DrTGA graph, shown in Fig. S4(B) (ESI†), was used to clarify the weight loss pattern. The DrTGA plot clearly showed a weight loss pattern with multiple stages for the prepared membranes, namely loss of absorbed water, degradation of the quaternary ammonium groups, debromination, and degradation of the main aromatic chain.
AFM of prepared TESPTEC-based NVC-X AEMs
Introduction of TESPTEC into BPPO as a side chain unit can cause microphase separation of the hydrophobic and hydrophilic domains.41 To authenticate this structure–property relationship, atomic force microscope (AFM) was used to compare the NVC-30 and QPPO membranes. Fig. 6 shows phase images of the NVC-30 membrane, in which both dark and bright zones were clearly visible. The bright zones can be attributed to rigid hydrophobic domains, while dark zones can be caused by the much “softer” hydrophilic domains.55 Nevertheless, the obtained phase images validated the actual microphase-separation morphology due to the membrane chemical structure.41 Herein, the difference in hydrophobic–hydrophilic domains between the main polymer matrix (BPPO) and TESPTEC-functionalized side chains was responsible for the development of distinct microphase segregation and well-connected hydroxide conducting channels.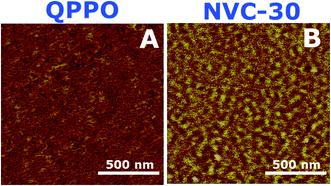 | ||
| Fig. 6 AFM tapping-phase images of (A) QPPO and (B) NVC-30. Scan box dimensions are 500 nm × 500 nm. QPPO AFM image taken from a previous report.54 | ||
It should be noted that the reference QPPO membrane possesses high IEC.54 Theoretically, increasing IEC leads to a higher degree of phase separation. This could be easily justified as the presence of higher ionic content promotes a greater hydrophobic–hydrophilic difference between the main rigid polymer chain and ionic side chains.54 However, the QPPO membrane actually showed poor nanophase separated morphology despite having a high IEC, while the NVC-30 membrane contained nanophase-segregated well-connected hydroxide ion conducting channels. This interconnected morphology sufficiently explained the high hydroxide conductive nature of the NVC-30 membrane.
SEM of prepared TESPTEC-based NVC-X AEMs
SEM micrographs were used to monitor the surface and cross-sectional morphologies of all prepared membranes. The reference surface and cross-sectional images for all membranes are shown in Fig. S5 (ESI†). Overall, the membrane surface images showed that the prepared membranes were mostly dense in nature, and no holes or cracks were observed. In the cross-sectional images, the same dense nature was observed. Membrane compactness was also verified from the cross-sectional images, as shown in Fig. S5.†Furthermore, the membrane physical appearance could be observed in the digital photograph of the NVC-50 membrane (Fig. S6, ESI†). These results show that the prepared membrane is promising for fuel cell applications.
Hydroxide conductivity of prepared TESPTEC-based NVC-X AEMs
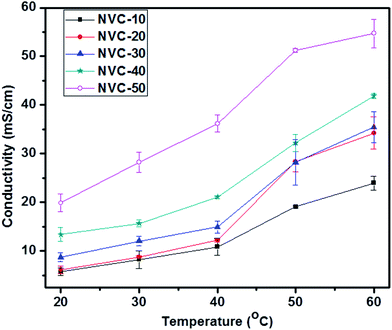
The ionic conductivity of an IEM is of great interest because it plays a crucial role in performance for fuel cell applications.56 The general minimum requirement for OH− conductivity is 10 mS cm−1, while the water uptake should be less than 30 wt%.51 Therefore, the main aim of this work was to develop thiol-ene click-mediated side-chain-based AEMs possessing low swelling properties and moderate ionic conductivities for fuel cell applications. The side-chain-type structure in AEMs is known to be important for obtaining a high ionic conductivity.51 The side-chain-type structure encouraged AEMs to use water molecules more effectively for OH− transportation.51 To date, many side-chain-based AEMs have been reported with acceptable ionic conductivities, but unsuitable swelling ratios. Click chemistry has received enormous attention due to its versatility; therefore, we focused on thiol-ene click-mediated side-chain-based AEMs. We could use the thiol-ene click reaction to easily incorporate the desired functionality inside the AEMs. The hydroxide ion conductivity of an AEM is known to depend on its ion exchange capacity.56 Therefore, increasing the IEC can promote high charge density and improve the volume fraction of water in the polymer matrix.56 However, in general, increasing the hydroxide conductivity by improving the IEC is not satisfactory because causes undesirable changes in mechanical and dimensional properties.41 Therefore, in AEMs, a critical balance of IEC and swelling ratio is necessary. Fig. 7 shows the temperature-dependent (20–60 °C) ionic conductivities of prepared membranes NVC-10–50. Notably, the conductivity measurements for all membranes were performed in deionized water. The ionic conductivities of all membranes gradually increased with increasing temperature, which could be due to the increasing free volume and faster mobility of anions inside the membrane matrix.56Additionally, Fig. 7 clearly shows that NVC-50 had higher conductivity (19.84 ± 1.81 mS cm−1) than the other prepared membranes at room temperature (20 °C), with a water uptake of only 18.36 wt%. Importantly, the obtained hydroxide conductivity was higher than 10 mS cm−1, the basic requirement for fuel cell activity. The water uptake value of the membrane was also satisfactory. The high hydroxide conductivity of the NVC-50 membrane could be due to the well-formed nanochannels and increasing IEC, which led to a higher concentration of active charged functional groups for anion transportation, and the water volume fraction in the membrane matrix.56 Furthermore, for the NVC-50 membrane, the comparative study of two different temperatures (20 °C and 60 °C) showed that, at the elevated temperature (60 °C), a higher conductivity (54.69 ± 2.91 mS cm−1) was afforded. At the elevated temperature, thermal motion and speedy diffusion resulted in higher anion mobility (the activation energy of ion transportation was overcome), while the anion mobility and increasing free volume (at high temperatures, the flexibility of the main polymer chain increases, resulting in a larger free volume) were responsible for the higher ionic conductivity.57 Table 2 shows that the prepared membrane had better or comparable ionic conductivity to most reported AEMs at room temperature (20 °C) and at the elevated temperature (60 °C). However, the reference QPPO membrane showed higher ionic conductivity than our membrane (2.07 ± 0.07 mmol g−1), which resulted in QPPO having extremely high water uptake (141.6 ± 6.8%).54 In contrast, our prepared membranes possessed much lower water uptake, which is considered an optimum property for fuel cell application.
| AEMs | Temperature (°C) | Conductivity (mS cm−1) | References |
|---|---|---|---|
| NVC-50 | 20 °C | 19.84 ± 1.81 | This work |
| QPPO | RT | 32 ± 0.9 | 54 |
| X60Y60 | 25 °C | 18.00 | 58 |
| QPAES-X20Y20 | 20 °C | 12.70 | 59 |
| [PVMBIm][OH] | 30 °C | 10.9 ± 0.06 | 60 |
| SCL-TPQAOH | 30 °C | 6.90 | 61 |
| ADAPP-ATMPP | RT | 13.00 | 62 |
| PP-DMHDA-20 | 20 °C | 19.20 | 51 |
| PAES-Q-75 | 25 °C | 21.90 | 63 |
| NAPAEK-Q-100 | 80 °C | 49.00 | 64 |
| [VBMI]Cl-styrene | 30 °C | 12.40 | 65 |
| QA-AAEM | 20 °C | 18.00 | 57 |
| C16D40 | 25 °C | 21.00 | 20 |
| PSf135-ImOH | 20 °C | 20.7 ± 0.06 | 66 |
| QSEBS | 80 °C | 9.37 | 67 |
| PES-G-OH | 60 °C | 42.00 | 68 |
| PVA-TMAPS | 25 °C | 8.00 | 69 |
| PSF-TMHDA | 25 °C | 10.00 | 70 |
| PSF-TMA/TMHDA | 25 °C | 17.00 | 71 |
| PES-B100-C16 | 30 °C | 18.90 | 72 |
| PSU-TMA | 25 °C | 12.00 | 73 |
Alkaline stability
AEM conductivity can be increased using many different techniques. However, chemical stability in long-term operations is known as a major drawback preventing the further development and commercialization of AEMFC applications.1 According to a recent survey, AEM stability can be well estimated from the cationic head group and main polymer chain degradation in an alkaline environment.1 The highly electrophilic nature of oriented groups (such as quaternary ammonium) makes them susceptible towards OH− attack, especially at raised temperatures.1 To determine the alkaline stability of our prepared membrane, we immersed the NVC-50 membrane in 1 M NaOH solution at 60 °C for 12 consecutive days (288 h). NVC-50 was chosen because it showed the maximum conductivity among the prepared membranes, and a temperature of 60 °C was chosen because it resisting degradation would be challenging under these conditions. Fig. 8 shows the comparative study of alkaline stability for both the NVC-50 and QPPO membranes. The QPPO membrane hydroxide ion conductivity declined rapidly during the accelerated alkaline stability test in alkaline sodium hydroxide solution (1 M) at 60 °C. However, NVC-50 evidently retained almost 60% of its initial conductivity, even after 12 days (288 h), whereas the QPPO membrane retained only 38% of its initial conductivity after 260 h of alkaline degradation test.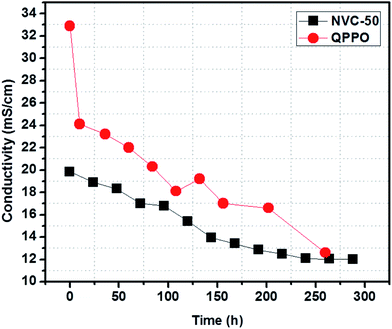 | ||
| Fig. 8 Alkaline stability of the NVC-50 membrane after immersing in 1 M NaOH at 60 °C (conductivity measurement carried out at 20 °C) compared with that of QPPO alkaline stability previously reported.54 | ||
There were three possible pathways for altering conductivity during the alkaline stability test. Under alkaline conditions, the Hofmann elimination, related to β-hydrogen, nucleophilic substitution directly at the α-carbon, and main polymer chain degradation play a crucial role in degenerating quaternary ammonium groups.51 Subsequently, the degeneration of quaternized ammonium groups in the alkaline medium resulted in a loss of conductivity. Therefore, this loss in conductivity was the main obstacle preventing commercial use of AEMFCs. For the first nine days, the NVC-50 membrane conductivity was sharply altered, but became almost stable afterwards. In this case, all three degradation mechanisms were possible. However, it is worth noting that, even after degradation, the NVC-50 membrane still demonstrated higher alkaline tolerance than the QPPO membrane.
Conclusions
In summary, we have designed and successfully synthesized NVC-based “thiol-ene” click-mediated side-chain-type AEMs with improved water uptake and conductivity. The versatility of thiol-ene click chemistry allowed the incorporation of silica into the NVC backbone, with the final clicked product, TESPTEC, used as a novel material for the preparation of AEMs via the Menshutkin reaction. The side-chain-type structure showed relatively good hydroxide conductivity and, due to silica incorporation, the water uptake was decreased to within an acceptable range. Effective ionic conduction in the prepared AEMs was promoted by the formation of quaternary ammonium groups in the membrane matrix. NVC-50 was the best membrane among those prepared in terms of IEC and conductivity. The observed thermal stability of the prepared membranes was acceptable for fuel cell applications. The maximum hydroxide conductivity was 19.84 ± 1.81 mS cm−1 in the NVC-50 membrane at room temperature, which was sufficient and promising for AEMFC applications. The alkaline stability of the NVC-50 membrane was also satisfactory compared with the reference QPPO membrane. Furthermore, facile synthetic routes, using thiol-ene click chemistry and the Menshutkin reaction, and the low cost of starting materials were added benefits. Moreover, the moderate conductivity with improved swelling ratios made these membranes a potential contender for AEMFC applications.Nomenclature
| AEM | Anion exchange membrane |
| AEMFC | Anion exchange membrane fuel cell |
| AFM | Atomic force microscopy |
| BPPO | Brominated poly(2,6-dimethyl-1,4-phenylene oxide) |
| DMPA | 2,2-Dimethoxy-2-phenylacetophenone |
| MPTES | (3-Mercaptopropyl)triethoxysilane |
| NMP | N-Methyl-2-pyrrolidone |
| NVC | N-Vinylcarbazole |
| PEM | Proton exchange membrane |
| PEMFC | Proton exchange membrane fuel cell |
| QA | Quaternary ammonium |
| SEM | Scanning electron microscopy |
| TESPTEC | 9-(2-((3-(Triethoxysilyl)propyl)thio)ethyl)-9H-carbazole |
| TGA | Thermogravimetric analysis |
| XPS | X-ray photoelectron spectroscopy |
Acknowledgements
Financial support received from the National Science Foundation of China (No. 91534203) and K. C. Wong Education Foundation (2016) is gratefully acknowledged. The scholarship obtained from the CAS-TWAS Presidents Fellowship is greatly appreciated.References
- J. Pan, L. Zhu, J. Han and M. A. Hickner, Chem. Mater., 2015, 27, 6689–6698 CrossRef CAS.
- M. A. Hickner, H. Ghassemi, Y. S. Kim, B. R. Einsla and J. E. McGrath, Chem. Rev., 2004, 104, 4587–4612 CrossRef CAS PubMed.
- M. Z. Jacobson, W. G. Colella and D. M. Golden, Science, 2005, 308, 1901–1905 CrossRef CAS PubMed.
- B. C. H. Steele and A. Heinzel, Nature, 2001, 414, 345–352 CrossRef CAS PubMed.
- K.-D. Kreuer, Chem. Mater., 1996, 8, 610–641 CrossRef CAS.
- D. Liu, S. Kyriakides, S. W. Case, J. J. Lesko, Y. Li and J. E. McGrath, J. Polym. Sci., Part B: Polym. Phys., 2006, 44, 1453–1465 CrossRef CAS.
- M. K. Debe, Nature, 2012, 486, 43–51 CrossRef CAS PubMed.
- G. Wu, K. L. More, C. M. Johnston and P. Zelenay, Science, 2011, 322, 443–447 CrossRef PubMed.
- R. Bashyam and P. Zelenay, Nature, 2006, 443, 63–66 CrossRef CAS PubMed.
- G. Couture, A. Alaaeddine, F. Boschet and B. Ameduri, Prog. Polym. Sci., 2011, 36, 1521–1557 CrossRef CAS.
- J. Pan, C. Chen, L. Zhuang and J. Lu, Acc. Chem. Res., 2012, 45, 473–481 CrossRef CAS PubMed.
- K. Asazawa, K. Yamada, H. Tanaka, A. Oka, M. Taniguchi and T. Kobayashi, Angew. Chem., Int. Ed., 2007, 46, 8024–8027 CrossRef CAS PubMed.
- Y. Leng, G. Chen, A. J. Mendoza, T. B. Tighe, Y. Wu, M. A. Hickner and C.-Y. Wang, J. Am. Chem. Soc., 2012, 134, 9054–9057 CrossRef CAS PubMed.
- J. Sanabria-Chinchilla, K. Asazawa, T. Sakamoto, K. Yamada, H. Tanaka and P. Strasser, J. Am. Chem. Soc., 2011, 133, 5425–5431 CrossRef CAS PubMed.
- J. John, K. M. Hugar, J. Rivera-Melendez, H. A. KostaliklV, E. D. Rus, H. Wang, G. W. Coates and H. D. Abruña, J. Am. Chem. Soc., 2014, 136, 5309–5322 CrossRef CAS PubMed.
- A. D. Mohanty, C. Y. Ryu, Y. S. Kim and C. Bae, Macromolecules, 2015, 48, 7085–7095 CrossRef CAS.
- J. R. Varcoe, P. Atanassov, D. R. Dekel, A. M. Herring, M. A. Hickner, P. A. Kohl, A. R. Kucernak, W. E. Mustain, K. Nijmeijer, K. Scott, T. Xu and L. Zhuang, Energy Environ. Sci., 2014, 7, 3135–3191 CAS.
- Y.-J. Wang, J. Qiao, R. Baker and J. Zhang, Chem. Soc. Rev., 2013, 42, 5768–5787 RSC.
- M. A. Hickner, A. M. Herring and E. B. J. Coughlin, J. Polym. Sci., Part B: Polym. Phys., 2013, 51, 1727–1735 CrossRef CAS.
- N. Li, Y. Leng, M. A. Hickner and C.-Y. Wang, J. Am. Chem. Soc., 2013, 135, 10124–10133 CrossRef CAS PubMed.
- S. Gu, J. Skovgard and Y. Yan, ChemSusChem, 2012, 5, 843–848 CrossRef CAS PubMed.
- J. Pan, S. Lu, Y. Li, A. Huang, L. Zhuang and J. Lu, Adv. Funct. Mater., 2010, 20, 312–319 CrossRef CAS.
- S. Gu, R. Cai, T. Luo, Z. Chen, M. Sun, Y. Liu, G. He and Y. Yan, Angew. Chem., Int. Ed., 2009, 48, 6499–6502 CrossRef CAS PubMed.
- J. Pan, Y. Li, J. Han, G. Li, L. Tan, C. Chen, J. Lu and L. Zhuang, Energy Environ. Sci., 2013, 6, 2912–2915 CAS.
- J. Han, H. Peng, J. Pan, L. Wei, G. Li, C. Chen, L. Xiao, J. Lu and L. Zhuang, ACS Appl. Mater. Interfaces, 2013, 5, 13405–13411 CAS.
- J. Yan and M. A. Hickner, Macromolecules, 2010, 43, 2349–2356 CrossRef CAS.
- K. M. Hugar, H. A. KostaliklV and G. W. Coates, J. Am. Chem. Soc., 2015, 137, 8730–8737 CrossRef CAS PubMed.
- J. Pan, C. Chen, Y. Li, L. Wang, L. Tan, G. Li, X. Tang, L. Xiao, J. Lu and L. Zhuang, Energy Environ. Sci., 2014, 7, 354–360 CAS.
- L. Zhu, T. J. Zimudzi, N. Li, J. Pan, B. Lin and M. A. Hickner, Polym. Chem., 2016, 7, 2464–2475 RSC.
- Y. Zuo, J. Cao and S. Feng, Adv. Funct. Mater., 2015, 25, 2754–2762 CrossRef CAS.
- H. C. Kolb, M. G. Finn and K. B. Sharpless, Angew. Chem., Int. Ed., 2001, 40, 2004–2021 CrossRef CAS PubMed.
- R. Kumar, Saima, A. Shard, N. H. Andhare, Richa and A. K. Sinha, Angew. Chem., Int. Ed., 2015, 54, 828–832 CrossRef CAS PubMed.
- C. E. Hoyle, A. B. Lowe and C. N. Bowman, Chem. Soc. Rev., 2010, 39, 1355–1387 RSC.
- C. E. Hoyle and C. N. Bowman, Angew. Chem., Int. Ed., 2010, 49, 1540–1573 CrossRef CAS PubMed.
- S. Y. Zhang, J. Zou, F. Zhang, M. Elsabahy, S. E. Felder, J. Zhu, D. J. Pochan and K. L. Wooley, J. Am. Chem. Soc., 2012, 134, 18467–18474 CrossRef CAS PubMed.
- R. Barbey and S. Perrier, ACS Macro Lett., 2013, 2, 366–370 CrossRef CAS.
- T. Kang, R. J. Amir, A. Khan, K. Ohshimizu, J. N. Hunt, K. Sivanandan, M. I. Montanez, M. Malkoch, M. Ueda and C. J. Hawker, Chem. Commun., 2010, 46, 1556–1558 RSC.
- W. Xi, T. F. Scott, C. J. Kloxin and C. N. Bowman, Adv. Funct. Mater., 2014, 24, 2572–2590 CrossRef CAS.
- H. Peng, C. Wang, W. Xi, B. A. Kowalski, T. Gong, X. Xie, W. Wang, D. P. Nair, R. R. McLeod and C. N. Bowman, Chem. Mater., 2014, 26, 6819–6826 CrossRef CAS.
- A. N. Mondal, C. Cheng, Z. Yao, J. Pan, M. M. Hossain, M. I. Khan, Z. Yang, L. Wu and T. Xu, J. Membr. Sci., 2015, 490, 29–37 CrossRef CAS.
- Q. Ge, J. Ran, J. Miao, Z. Yang and T. Xu, ACS Appl. Mater. Interfaces, 2015, 7, 28545–28553 CAS.
- J. Ran, L. Wu, Q. Ge, Y. Chen and T. Xu, J. Membr. Sci., 2014, 470, 229–236 CrossRef CAS.
- S. Bruna, I. Martinez-Montero, A. M. Gonzalez-Vadillo, C. Martin-Fernandez, M. M. Montero-Campillo, O. Mo and I. Cuadrado, Macromolecules, 2015, 48, 6955–6969 CrossRef CAS.
- A. N. Mondal, C. Dai, J. Pan, C. Zheng, M. M. Hossain, M. I. Khan, L. Wu and T. Xu, ACS Appl. Mater. Interfaces, 2015, 7, 15944–15954 CAS.
- G. Socrates, Infrared Characteristic Group Frequencies, Wiley, New York, 1980 Search PubMed.
- A. N. Mondal, C. Zheng, C. Cheng, J. Miao, M. M. Hossain, K. Emmanuel, M. I. Khan, N. U. Afsar, L. Ge, L. Wu and T. Xu, J. Membr. Sci., 2016, 507, 90–98 CrossRef CAS.
- S. Singh, A. Jasti, M. Kumar and V. K. Shahi, Polym. Chem., 2010, 1, 1302–1312 RSC.
- X. Lin, E. Shamsaei, B. Kong, J. Z. Liu, Y. Hu, T. Xu and H. Wang, J. Membr. Sci., 2016, 502, 76–83 CrossRef CAS.
- D. B. Spry, A. Goun, K. Glusac, D. E. Moilanan and M. D. Fayer, J. Am. Chem. Soc., 2007, 129, 8122–8130 CrossRef CAS PubMed.
- T. Chakrabarty, A. K. Singh and V. K. Shahi, RSC Adv., 2012, 2, 1949–1961 RSC.
- M. Zhang, J. Liu, Y. Wang, L. An, M. D. Guiver and N. Li, J. Mater. Chem. A, 2015, 3, 12284–12296 CAS.
- M. Eikerling, A. A. Kornyshev and U. Stimming, J. Phys. Chem. B, 1997, 101, 10807–10820 CrossRef CAS.
- Z. Zhang, L. Wu, J. R. Varcoe, C. Li, A. L. Ong, S. Poynton and T. Xu, J. Mater. Chem. A, 2013, 1, 2595–2601 CAS.
- Y. He, L. Wu, J. Pan, Y. Zhu, X. Ge, Z. Yang, J. Ran and T. Xu, J. Membr. Sci., 2016, 504, 47–54 CrossRef CAS.
- C. X. Lin, X. L. Huang, D. Guo, Q. G. Zhang, A. M. Zhu, M. L. Ye and Q. L. Liu, J. Mater. Chem. A, 2016, 4, 13938–13948 CAS.
- X. Lin, J. R. Varoce, S. D. Poynton, X. Liang, A. L. Ong, J. Ran, Y. Li and T. Xu, J. Mater. Chem. A, 2013, 1, 7262–7269 CAS.
- J. Ran, L. Wu, J. R. Varoce, A. L. Ong, S. D. Poynton and T. Xu, J. Membr. Sci., 2012, 415–416, 242–249 CrossRef CAS.
- N. Li, L. Wang and M. A. Hickner, Chem. Commun., 2014, 50, 4092–4095 RSC.
- X. Li, Q. Liu, Y. Yu and Y. Meng, J. Membr. Sci., 2014, 467, 1–12 CrossRef CAS.
- F. Gu, H. Dong, Y. Li, Z. Si and F. Yan, Macromolecules, 2014, 47, 208–216 CrossRef CAS.
- C. H. Zhao, Y. Gong, Q. L. Liu, Q. G. Zhang and A. M. Zhu, Int. J. Hydrogen Energy, 2012, 37, 11383–11393 CrossRef CAS.
- M. R. Hibbs, C. H. Fujimoto and C. J. Cornelius, Macromolecules, 2009, 42, 8316–8321 CrossRef CAS.
- X. Li, G. Nie, J. Tao, W. Wu, L. Wang and S. Liao, ACS Appl. Mater. Interfaces, 2014, 6, 7585–7595 CAS.
- Z. Liu, X. Li, K. Shen, P. Feng, Y. Zhang, X. Xu, W. Hu, Z. Jiang, B. Liu and M. D. Guiver, J. Mater. Chem. A, 2013, 1, 6481–6488 CAS.
- W. Li, J. Fang, M. Lv, C. Chen, X. Chi, Y. Yang and Y. Zhang, J. Mater. Chem., 2011, 21, 11340–11346 RSC.
- F. Zhang, H. Zhang and C. Qu, J. Mater. Chem., 2011, 21, 12744–12752 RSC.
- Q. H. Zeng, Q. L. Liu, I. Broadwell, A. M. Zhu, Y. Xiong and X. P. Tu, J. Membr. Sci., 2010, 349, 237–243 CrossRef CAS.
- Q. Zhang, S. Li and S. Zhang, Chem. Commun., 2010, 46, 7495–7497 RSC.
- E. D. Wang, T. S. Zhao and W. W. Yang, Int. J. Hydrogen Energy, 2010, 35, 2183–2189 CrossRef CAS.
- J.-S. Park, S.-H. Park, S.-D. Yim, Y.-G. Yoon, W.-Y. Lee and C.-S. Kim, J. Power Sources, 2008, 178, 620–626 CrossRef CAS.
- J.-S. Park, G.-G. Park, S.-H. Park, Y.-G. Yoon, C. S. Kim and W. Y. Lee, Macromol. Symp., 2007, 249–250, 174–182 CrossRef.
- C. X. Lin, Y. Z. Zhou, A. N. Lai, Q. G. Zhang, A. M. Zhu and Q. L. Liu, RSC Adv., 2016, 6, 17269–17279 RSC.
- L. Pasquini, M. L. D. Vona and P. Knauth, New J. Chem., 2016, 40, 3671–3676 RSC.
Footnote |
| † Electronic supplementary information (ESI) available. See DOI: 10.1039/c7ra03857g |
| This journal is © The Royal Society of Chemistry 2017 |

