
 Open Access Article
 This Open Access Article is licensed under a
 Creative Commons Attribution 3.0 Unported Licence
Assessing the performance and microbial structure of biofilms adhering on aerated membranes for domestic saline sewage treatment†
Hailong Tian‡
a,
Jie Liu‡b,
Tengteng Fengc,
Haifeng Lia,
Xiaolei Wu*g and
Baoan Li *def
*def
aCollege of Bioengineering, Henan University of Technology, Zhengzhou 450001, PR China
bCollege of Architecture and Urban Planning, Chongqing Jiaotong University, Chongqing 400074, PR China
cShandong Academy of Environmental Science, Jinan 250013, PR China
dState Key Laboratory of Chemical Engineering, Tianjin University, Tianjin 300072, PR China. E-mail: baoan.li@gmail.com; Fax: +86-22-27404496; Tel: +86-22-27407854
eCollaborative Innovation Center of Chemical Science and Engineering, Tianjin 300072, PR China
fTianjin Key Laboratory of Membrane Science and Desalination Technology, Tianjin University, Tianjin 300072, PR China
gDepartment of Energy and Resources Engineering, College of Engineering, Peking University, Beijing 100871, PR China. E-mail: xiaolei_wu@pku.edu.cn; Fax: +86-10-62759047; Tel: +86-10-62759047
First published on 22nd May 2017
Abstract
The presence of high salt concentration has always been considered as a common inhibitor that hampers effective municipal wastewater treatment. In this study, a bench-scale membrane-aerated biofilm reactor (MABR) was first introduced to degrade and remove the carbon and nitrogen pollutants under saline conditions. At influent concentrations of 220 mg CODCr per L and 32 mg NH4–N per L with an HRT of 24 h and salinity level of 3%, the reactor demonstrated excellent CODCr, NH4–N and TN removal efficiencies of 92.8%, 98.5% and 70.6%, respectively. Alphaproteobacteria, Anaerolineae, Gammaproteobacteria, Betaproteobacteria and Flavobacteria were the major functional classes in bacterial community. Candidatus Nitrososphaera exhibited stronger salt resistance compared with Nitrosomonas, and was probably the dominant nitrifier. Although the microbial diversity (Shannon–Wiener index) changed slightly along with the increasing salinity from 0.4% to 3%, the community composition substantially altered mainly through a fluctuant process via the growth of halophilic bacteria and the reduction of halotolerant bacteria. The halotolerant bacteria was mainly affiliated with Anaerolineae and Ignavibacteria while the halophilic bacteria mainly belonged to Alphaproteobacteria and Anaerolineae. The succession ensured a stable performance of the system under salty environments. This research suggests that MABR has the potential to effectively treat domestic saline sewage.
1. Introduction
Chloride salts are often found in wastewater, and are regarded as a common stress factor in wastewater treatment plants (WWTPs) for the treatment of domestic saline sewage. Such water is mainly generated from the utilization of seawater, seawater intrusion in the sewerage, landfill leachates and contaminated ground water. With regard to nitrogen removal, nitrification is easily inhibited by the increasing salinity. High salt concentration generally generates high osmotic pressure and low dissolved oxygen (DO) content in wastewater, which can considerably reduce the activity and abundance of ammonia-oxidizing bacteria (AOB)1 and then lead to slow and poor nitrifying process. Meanwhile, these autotrophic populations grow slowly and need more time for proliferation than most heterotrophic bacteria. Once the bacteria encounters damage by salt stress, its ecological function in wastewater treatment will be hardly resumed. In this study, a membrane-aerated biofilm reactor (MABR) might provide a solution to these problems.MABR is a novel wastewater treatment system that efficiently integrates the membrane gas separation and the biological film processes. This unique combination offers a counter diffusion of contaminants (electron donor) and oxygen (electron accepter) from both sides of biofilms.2 This phenomenon leads to higher oxygen transfer efficiency,3 reduced emissions of volatile toxic compounds,4 and the stratification of functional organisms in simultaneous biofilm removal of carbon and nitrogen in a single chamber.2,5 In MABR, the region near the membrane surface (or biofilm base) is characterized by favourable growth conditions for nitrifiers such as high DO and low contents of organic substrates, making nitrifiers more likely to inhabit and outcompete aerobic heterotrophic bacteria compared to those in conventional co-diffusion biofilms. Moreover, rough membrane surface is quite suitable for the adherence of nitrifiers, and the EPS mass among microorganisms make them hardly sloughed.5 All these conditions significantly contribute to the long term development of nitrifiers in MABR, which is likely to strength the ability of high-salt tolerance of MABR.
Previous studies have proposed integrated MABRs for the advanced treatment of pharmaceutical wastewater with high salinity.6,7 Good nitrification and denitrification performance could be achieved in the MABR system after detoxification via pre-physical–chemical technologies. These findings further help us in exploring the possibility of domestic wastewater disposal using a single MABR under a high-salt environment. One of the key points is whether a type of biofilm can be developed with both salt resistane and ammonium oxidation ability. Although the nitrifiers can show various levels of salt resistance in different wastewater treatment systems, limited researches have focused on the acclimation and performance of MABR biofilms under high salinity conditions. The influence of salt on the composition of microbial community in biofilms is also unclear.
The present work documents the process effect of MABR along with increasing salt contents. In additon, the bacterial/archaeal community structure of biofilms was investigated deeply at three levels of NaCl concentrations. The obtained results provide a new attempt of MABR for the treatment of domestic saline wastewater.
2. Materials and methods
2.1 Reactor configuration and operation
A lab-scale MABR (volume of 2.5 L) was set up to perform the treatment of domestic saline sewage. As shown in Fig. 1, the hollow-fiber membranes module (Hydroking Sci. & Tech. Ltd., Tianjin, China) was installed and submerged in a rectangular and well-designed perspex container (9 cm wide, 10 cm high, 30 cm long). The membrane module consisted of 245 composite hollow fiber membranes in a parallel configuration (wall thickness of 100 μm, outer diameter of 700 μm, active length of 1 m, specific surface area of approximately 431 m2 m−3), and these fibers were entwined through the rectangular channel. A circulation pump and two water distributors were used to control and regulate the cross-flow velocity across the biofilm, which was roughly calculated by dividing inlet water flux by the intra cross section area of the rectangular container. The aerated density was regulated by using the air compressor. The applied inoculation sludge (about 6400 mg L−1) was provided from an MBR device in Tianjin University. The seeding, biofilm culturing and start-up period lasted for 50 d before running. The reactor was operated in a batch feeding mode with an HRT of 24 h and the pH was maintained between 7.6 and 8.1.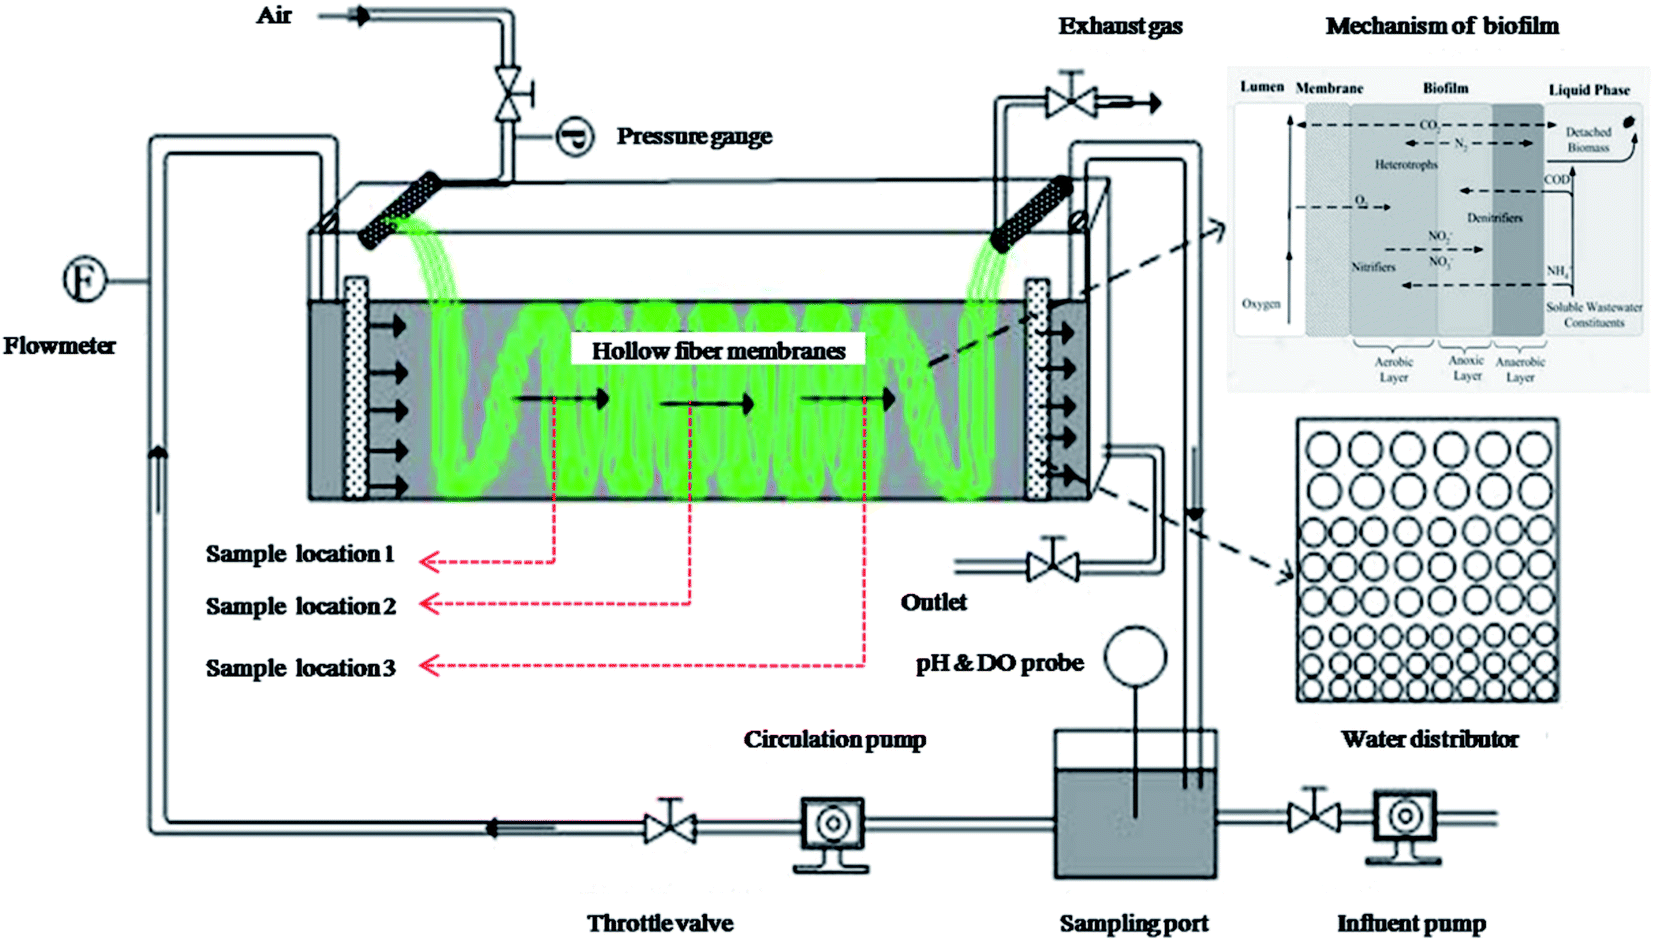 | ||
| Fig. 1 Schematic of the applied lab-scale MABR. | ||
The applied synthetic wastewater (Table S1†) was prepared in accordance with the typical compositions of C and N in domestic wastewater.8,9 The reactor was operated under four saline conditions (see Table 1). Phase S1 was conducted with none of salt, and then Phase S2 was subjected to low doses of salt. Subsequently, the biofilm began a period of domestication for 20 d by gradually adding salt doses to 30 g NaCl per L with an interval of 5 g NaCl per L (Fig. 2). After that, the reactor runned in a stable high-salty environment (30 g NaCl per L, Phase S3).
| Phase | Time (d) | Influent COD (mg L−1) | Influent NH4–N (mg L−1) | Pressure (MPa) | Salinity (NaCl g L−1) | T (°C) | HRT (h) |
|---|---|---|---|---|---|---|---|
| S1 | 50–69 | 224 ± 2.3 | 29.7 ± 1.3 | 0.10 | 0 | 23–25 | 24 |
| S2 | 70–88 | 225 ± 2.1 | 33.4 ± 0.9 | 0.10 | 4 | 23–25 | 24 |
| Acclimation | 89–107 | 223 ± 2.6 | 31.7 ± 0.4 | 0.10 | 9–30 | 23–25 | 24 |
| S3 | 108–124 | 226 ± 2.8 | 31.9 ± 0.6 | 0.10 | 30 | 23–25 | 24 |
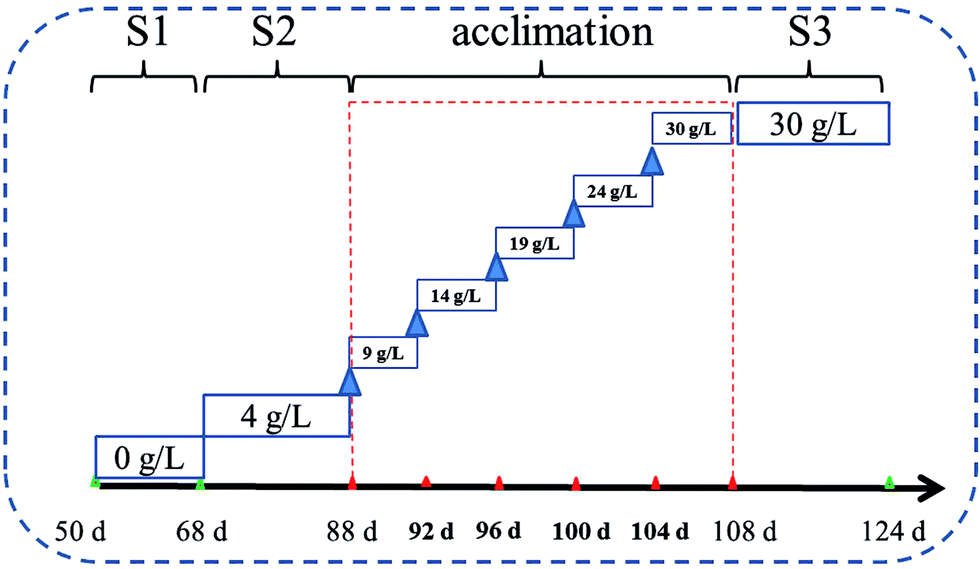 | ||
| Fig. 2 The flow chart of salty change in the experiment. | ||
2.2 Batch test
Batch test was performed to track the removal process of contaminants in an entire HRT (24 h, a cycle) under three saline conditions (i.e., 0 g NaCl per L, 4 g NaCl per L and 30 g NaCl per L), which can help us to further study the effect of salt on the biofilm performance. In each test, the influent feed was kept constant, and water quality monitoring was conducted every three hours. Meanwhile, each measurement was repeated three times.2.3 Sampling, DNA extraction, and PCR
At the end of each stage, biomass were carefully removed with a razor from three sites (Fig. 1) of the membrane and mixed together as one a representative sample. Then, all samples (including the seeding sludge) were collected and immediately stored at −80 °C before further analysis. Roughly, 0.5 g of each sample was used for genomic DNA extraction using the FastDNA® Spin Kit for Soil (MP Biomedicals, Cleveland, USA) following the manufacturer's instructions. The quantity and quality of the extracted DNA were assessed by using a UV-1700 PharmaSpec UV-VIS spectrophotometer (Shimadzu, Japan).The V3-V6 regions of bacterial 16S rRNA gene fragments were amplified using the forward primer 341F (5′-CCT ACG GGA GGC AGC AG) and reverse primer 1073R (5′-ACG AGC TGA CGA CAR CCA TG). The V3-V6 regions of the archaeal 16S rRNA gene fragments were acquired via the PCR method as follows. First, the forward primer 109F (5′-ACA GCT CAG TAA CAC GT) and reverse primer 1386R (5′-GCG GTG TGT GCA AGG AGC) were used to generate the DNA fragments with an average length of 1277 bp. Then the forward primer 339F (GGY GCA SCA GGC GCG VAW) and the reverse primer 1048R (CGR CRG CCA TGY ACC WC) was adopted to obtain the targeted amplification of around 709 bp based on the above DNA template. Each forward primer contained a unique 10-nucleotide barcode, which was used to distinguish samples from one another. The PCR conditions are presented in Tables S2 and S3.† The triplicate PCR products were pooled and purified by using the Gel/PCR Extraction Kit (Bioteke Corporation, Beijing, China).
2.4 Pyrosequencing and data processing
In accordance with standard protocols, seven prepared PCR amplicons were mixed together and then sent to the TEDA Institute of Biological Sciences and Biotechnology (Tianjin, China) for pyrosequencing on a massively parallel 454 GS-FLX sequencer according to standard protocols.The sequences were pre-processed by the TEDA Institute of Biological Sciences and Biotechnology. The raw sequences were processed with QIIME version 1.7.0 to obtain the optimized sequences, bad sequences were removed from the raw sequences (length outside bounds of 200 and 1000, num ambiguous bases exceeds the limit of 6, missing quality score, mean quality score below minimum of 25, max homopolymer run exceeds limit of 6, num mismatches in primer exceeds limit of 0 and uncorrected barcodes). All the optimized sequences with an average length of 732 bp (for bacteria) and 709 bp (for archaea) were compared by performing a BLAST search via the SILVA database (version 106), and then clustered into operational taxonomic units (OTU). The OTU was defined as the furthest neighbor Jukes–Cantor distance of 0.03 (OTU0.03) and then assigned to a taxonomy using the Ribosomal Database Project (RDP) Naive Bayes Classifier. For each rank assignment, the classifier automatically estimated the classification reliability via bootstrapping. Ranks in which representative sequences of different OTU0.03s could not be assigned with a bootstrap confidence were displayed under an artificial “unclassified” taxon. The Shannon–Wiener diversity index and Chao1 richness estimator were generated in the QIIME program. The nucleotide sequences were deposited in GenBank under accession number (DRA005066).
2.5 Physico-chemical measurements
CODCr, NH4–N, NO2–N, NO3–N, TN, DO and pH were determined via spectrophotometry by using the Multiparameter Bench Photometer for Laboratories (Hach Instruments Inc., USA). DO concentration and pH level were monitored with the microelectrode measurement system by using a portable DO detector (INESA, China) and pH meter (INESA, China), respectively. Each measurement was performed in triplicate.2.6 Statistical analysis
The drawing of heat maps, principal component analysis (PCA), and Bray–Curtis distance were performed using R3.1.2 statistical computing (http://www.r-project.org/). The water-quality trend charts were created using Origin 8.0 package.3. Results and discussion
3.1 Process performance
The long-term process of MABR after start-up were monitored and shown in Fig. 3. Given the average influent CODCr and NH4–N concentrations at 220 and 32 mg L−1, respectively, excellent CODCr and NH4–N removal efficiencies were achieved in biofilms at the steady state under S1 and S2 conditions (CODCr: S1-97.0%, S2-97.9%, NH4–N: S1-96.3%, S2-99.7%, TN: S1-81.2%, S2-96.8%, average). Biofilms in MABR seemed not be affected adversely by the low salt stress (4 g NaCl per L), but exhibited more better performance than that under salt-free condition.10 During the process of domestication, biofilms still performed good CODCr, NH4–N and TN removal effects (90.0%, 95.8%, 77.2%, respectively). Moderate shock of additional salt not only promoted salt tolerance of biofilms, but also did not considerably disrupt the function of simultaneous carbon and nitrogen removals. More importantly, the essential process ensured the biofilms proceed smoothly when treating wastewater with a concentration of 30 g NaCl per L. After a short term of acclimation (20 d), the biofilms still performed a high nitrification efficiency (98.5%), although the TN removal effect declined to 70.6% from 95.8% in S2 probably due to the lack of carbon resource and the inhibition on denitrifiers by salt stress. Interestingly, the effluent DO decreased to less than 2 mg L−1 in S2, but increased to 8.0 mg L−1 in S3. The microbial respiration intensity tended to be enhanced by the arising salinity, consuming more oxygen accordingly and leading to lower effluent DO compared with that under the salt-free condition. However, when a large amount of salt was introduced into the wastewater, high osmotic stress reduced microbial metabolic activities,11,12 such as the inhibited AOB, thereby resulting in lower oxygen consumption and higher effluent DO. This also hindered some anaerobic denitrifiers for denitrification on some level.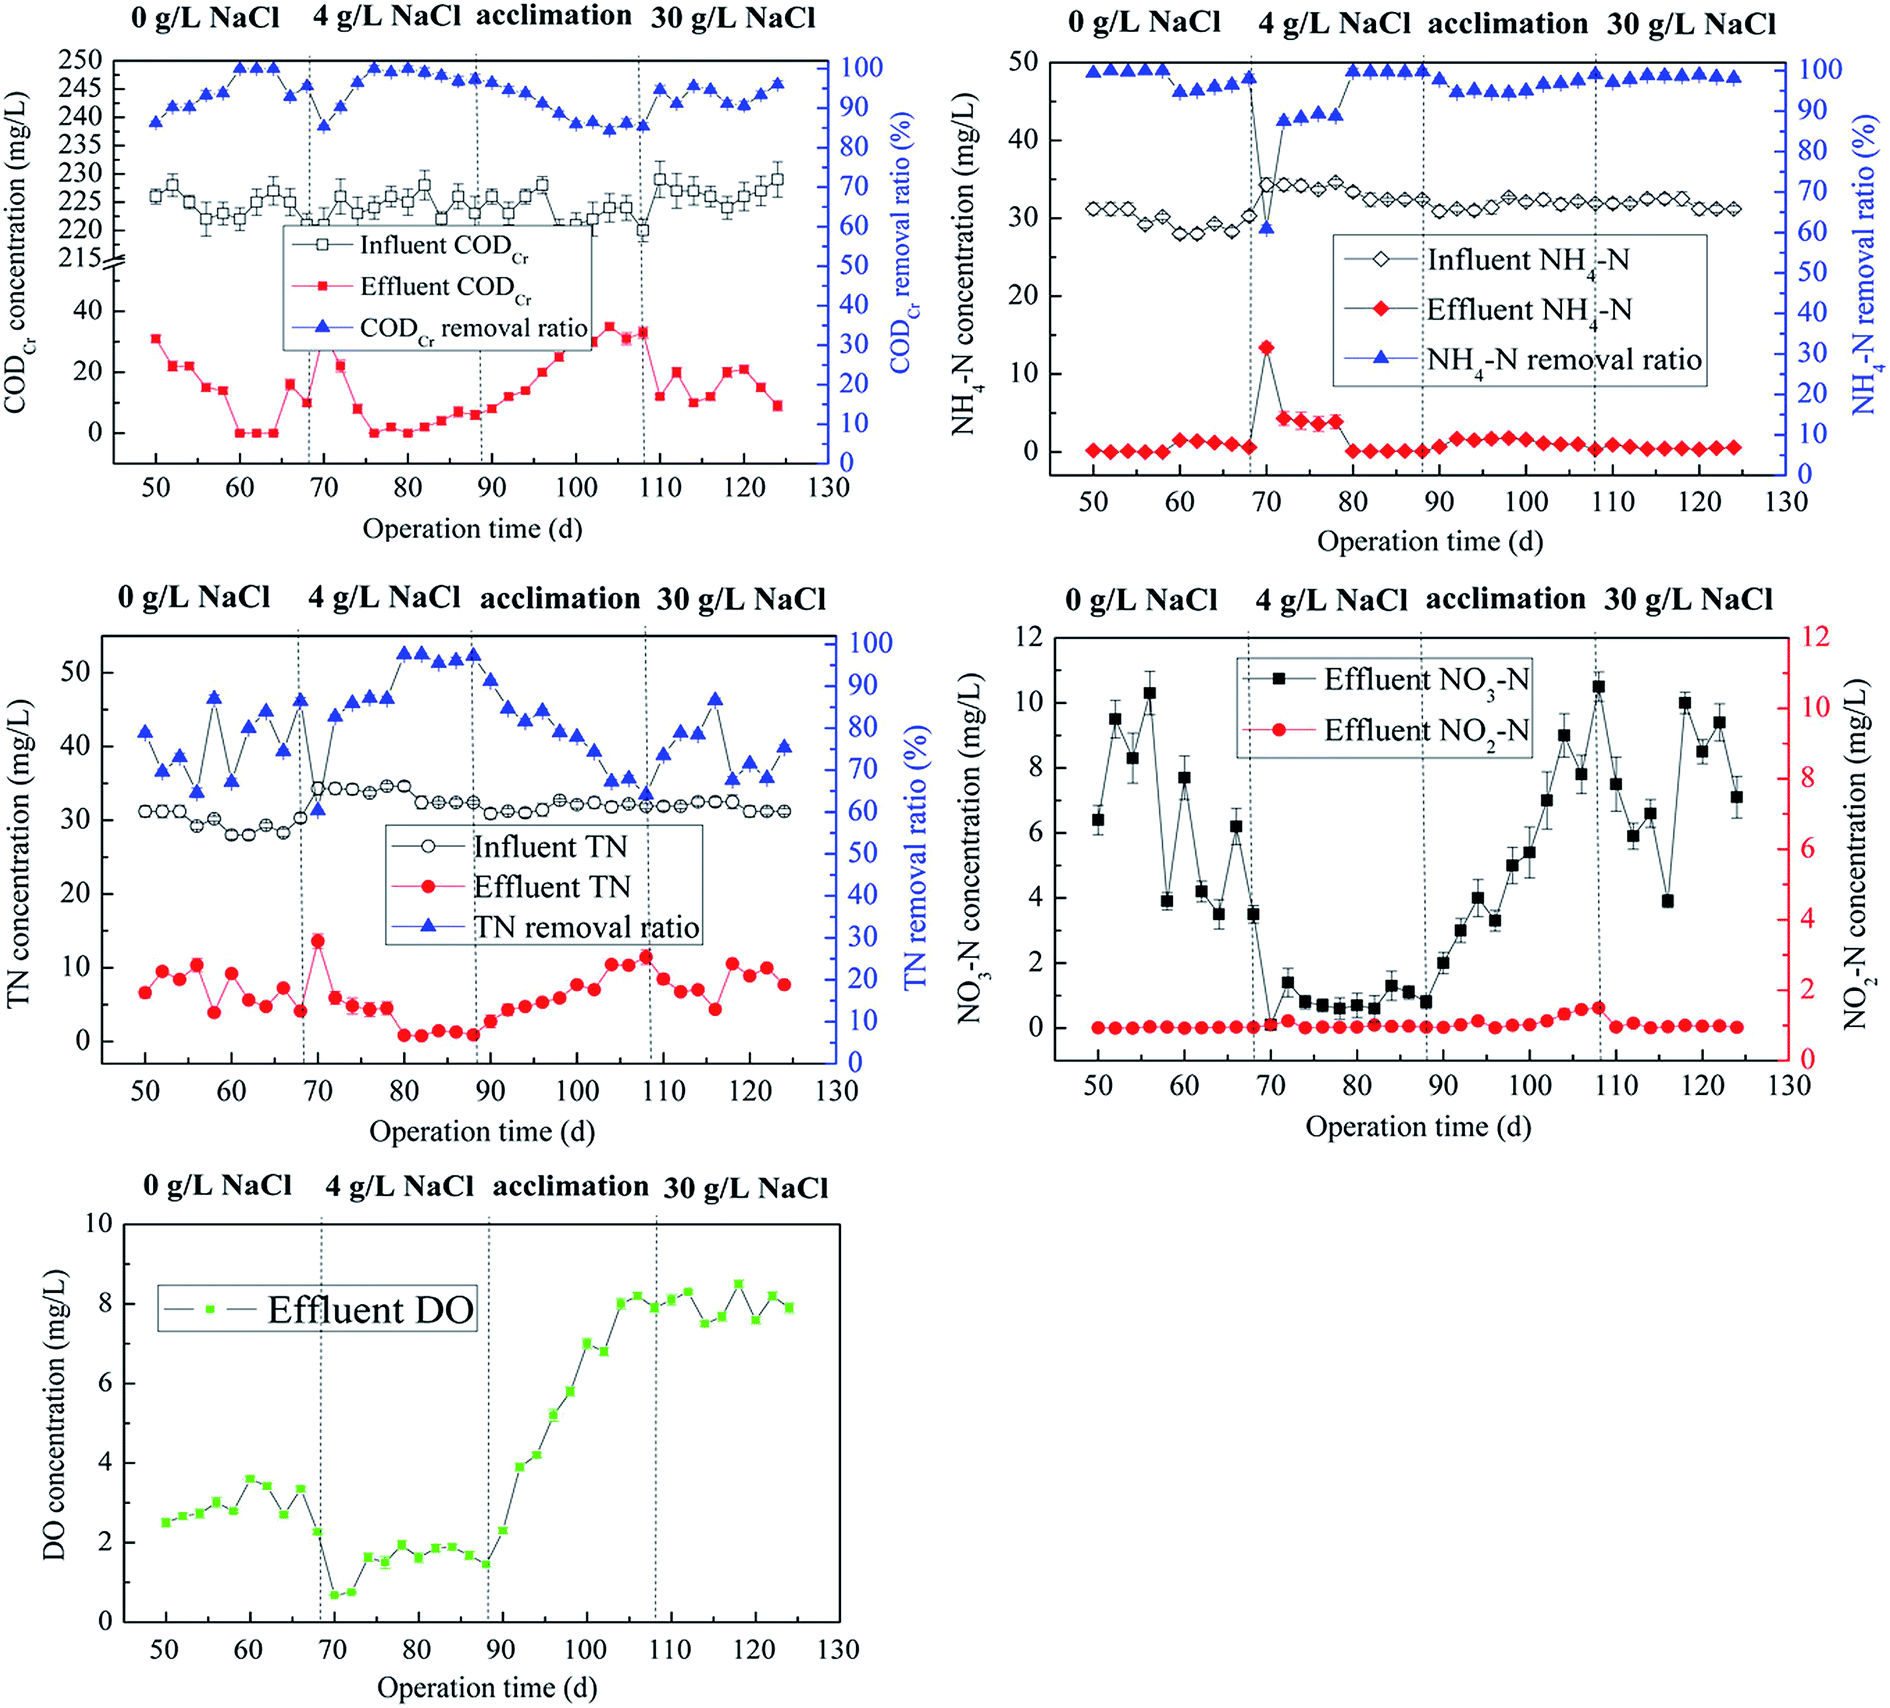 | ||
| Fig. 3 Performance of CODCr and nitrogen removal in the MABR during the whole operation. | ||
Batch test was carried out to emphasize the differences of removal processes for contaminants in an entire HRT. Fig. S1† shows that salt concentration delayed the CODCr and NH4–N removal process, but this did not hamper their ultimate elimination. The TN removal efficiency was the lowest in S3, suggesting that denitrification was negatively affected by the salt of 30 g NaCl per L, which led to a lower nitrogen removal ratio.13 Accumulation of NO2–N was obviously generated at 15 h in S3, although few NO2–N and much NO3–N were observed at the end of 24 h. Numerous studies have demonstrated that abundant salt (no less than 3% NaCl) in wastewater consistently facilitated partial nitrification process.14,15 Whether the case could occur in MABR should be accurately determined in future research.
3.2 Microbial community analysis
The efficiency of wastewater treatment has a direct association with the microbial community in biochemical treatment systems. The analytical structure of these organisms can help us better understand the significant factors (e.g., operational conditions and influent quality parameters) that affect or determine the overall performance of WWTPs. Additionally, the variance of community structure is consistently related to their diversity and composition. All these factors were considered in the current study.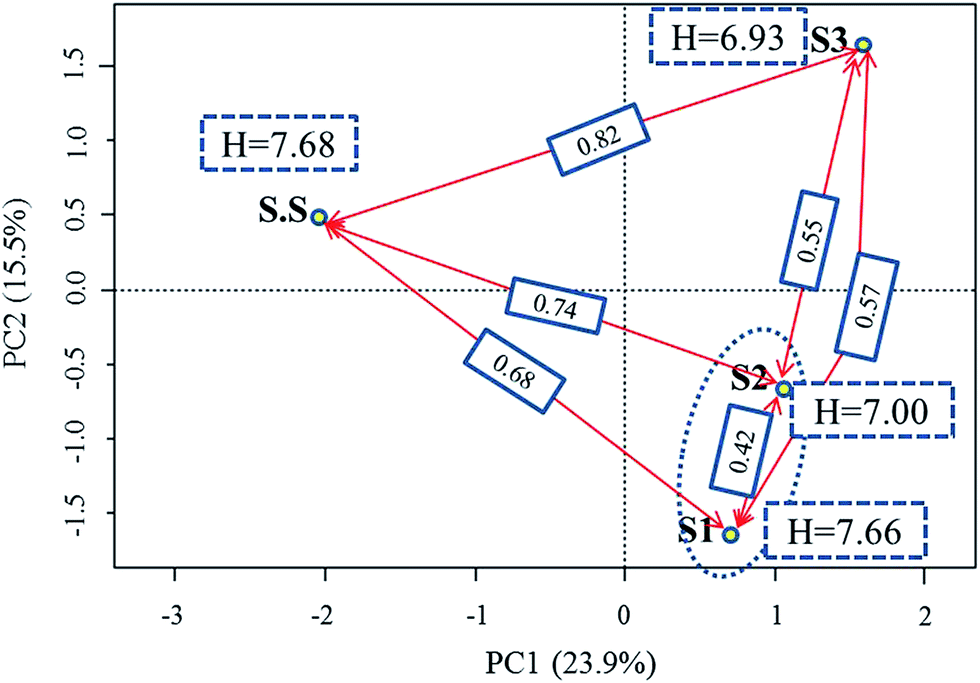 | ||
| Fig. 4 Ordination plot generated by PCA analysis coupled with α- and β- diversity (Shannon–Wiener index and Bray–Curtis dissimilarity, respectively). The PCA diagram was made based on OTUs level, the value in the blue dashed block refers to Shannon–Wiener index of an community, the value in the blue solid block referred to Bray–Curtis dissimilarity between two communities. | ||
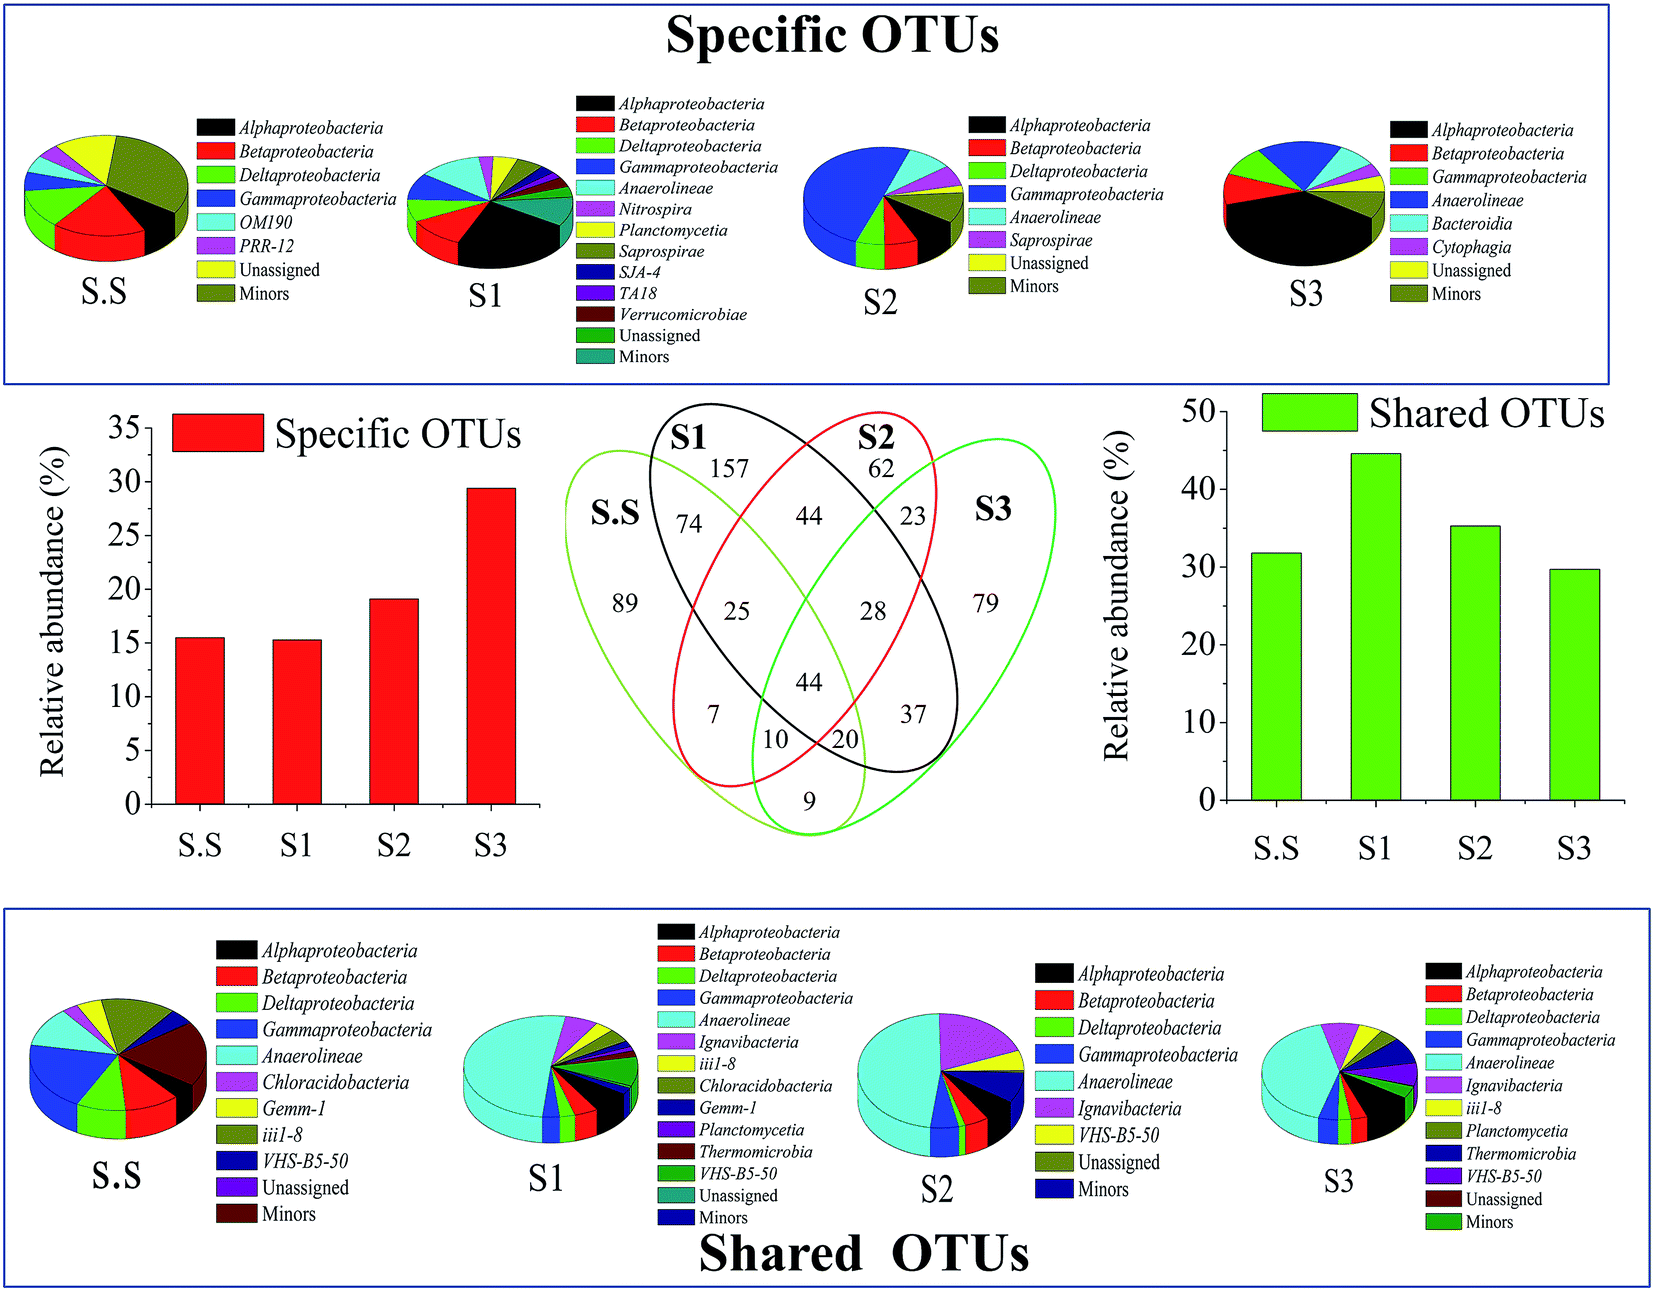 | ||
| Fig. 5 The detailed structural comparison and success of bacteria along with the growing salinity. The value in Venn diagram represented the number of OTUs. The pie charts showed the class distributions in specific OTUs and shared OTUs, respectively. The histograms indicated the relative quantity of specific OTUs and shared OTUs in total sequences, respectively. | ||
The Bacteroidetes population became more abundant (13.3%) with growing salt concentration. The phylum has been identified as one of the most important heterotrophic bacterial groups in marine habitats and contribute to the degradation of particulate organic matter in the ocean.20 Flavobacteria (class of Bacteroidetes), which are mostly present in aerobic aquatic and terrestrial environments, mainly inhabited in S3 and exhibited strong halophilic feature. Fig. S2c† shows the detailed information about the bacterial success at the family level. Obviously, bacteria such as Flavobacteriaceae (7.48%), Rhodocyclaceae (7.36%)21 and Rhodobacteraceae (5.49%)22 in S3, were the main halophilic populations, bacteria including Xanthomonadaceae (8.05% in S2) and Ignavibacteriaceae (6.85% in S2) might prefer to grow and multiply under lower salinity conditions to ensure the removal of contaminants in wastewater. Hyphomicrobiaceae demonstrated extensive adaptability for salinity in this condition. These above families are mostly associated with the denitrifying process in aquatic environments.23,24 Their different distributions in biofilms probably ensured the efficient and stable denitrification performance in MABR for the treatment of wastewater with various salt concentrations. By contrast, the nitrification-related families comprising Nitrosomonadaceae and Nitrospiraceae did not considerably colonize the S3-biofilm. Such was the case with their detailed genus Nitrosomonas (ammonia-oxidizing bacteria, AOB) and Nitrospira (nitrite-oxidizing bacteria, NOB), respectively (Fig. 6a). These nitrifiers were generally more likely to grow under moderate salt-free conditions rather than high-salt conditions. This fact effectively explains why the temporary accumulation of NO2–N was generated at 15 h in S3 in the batch test (Fig. S1†). It is worth noting that the reactor still achieved an excellent NH4–N removal rate (S3-98.5%) when suffering from high salt stress, although the growth of AOB was probably inhibited.
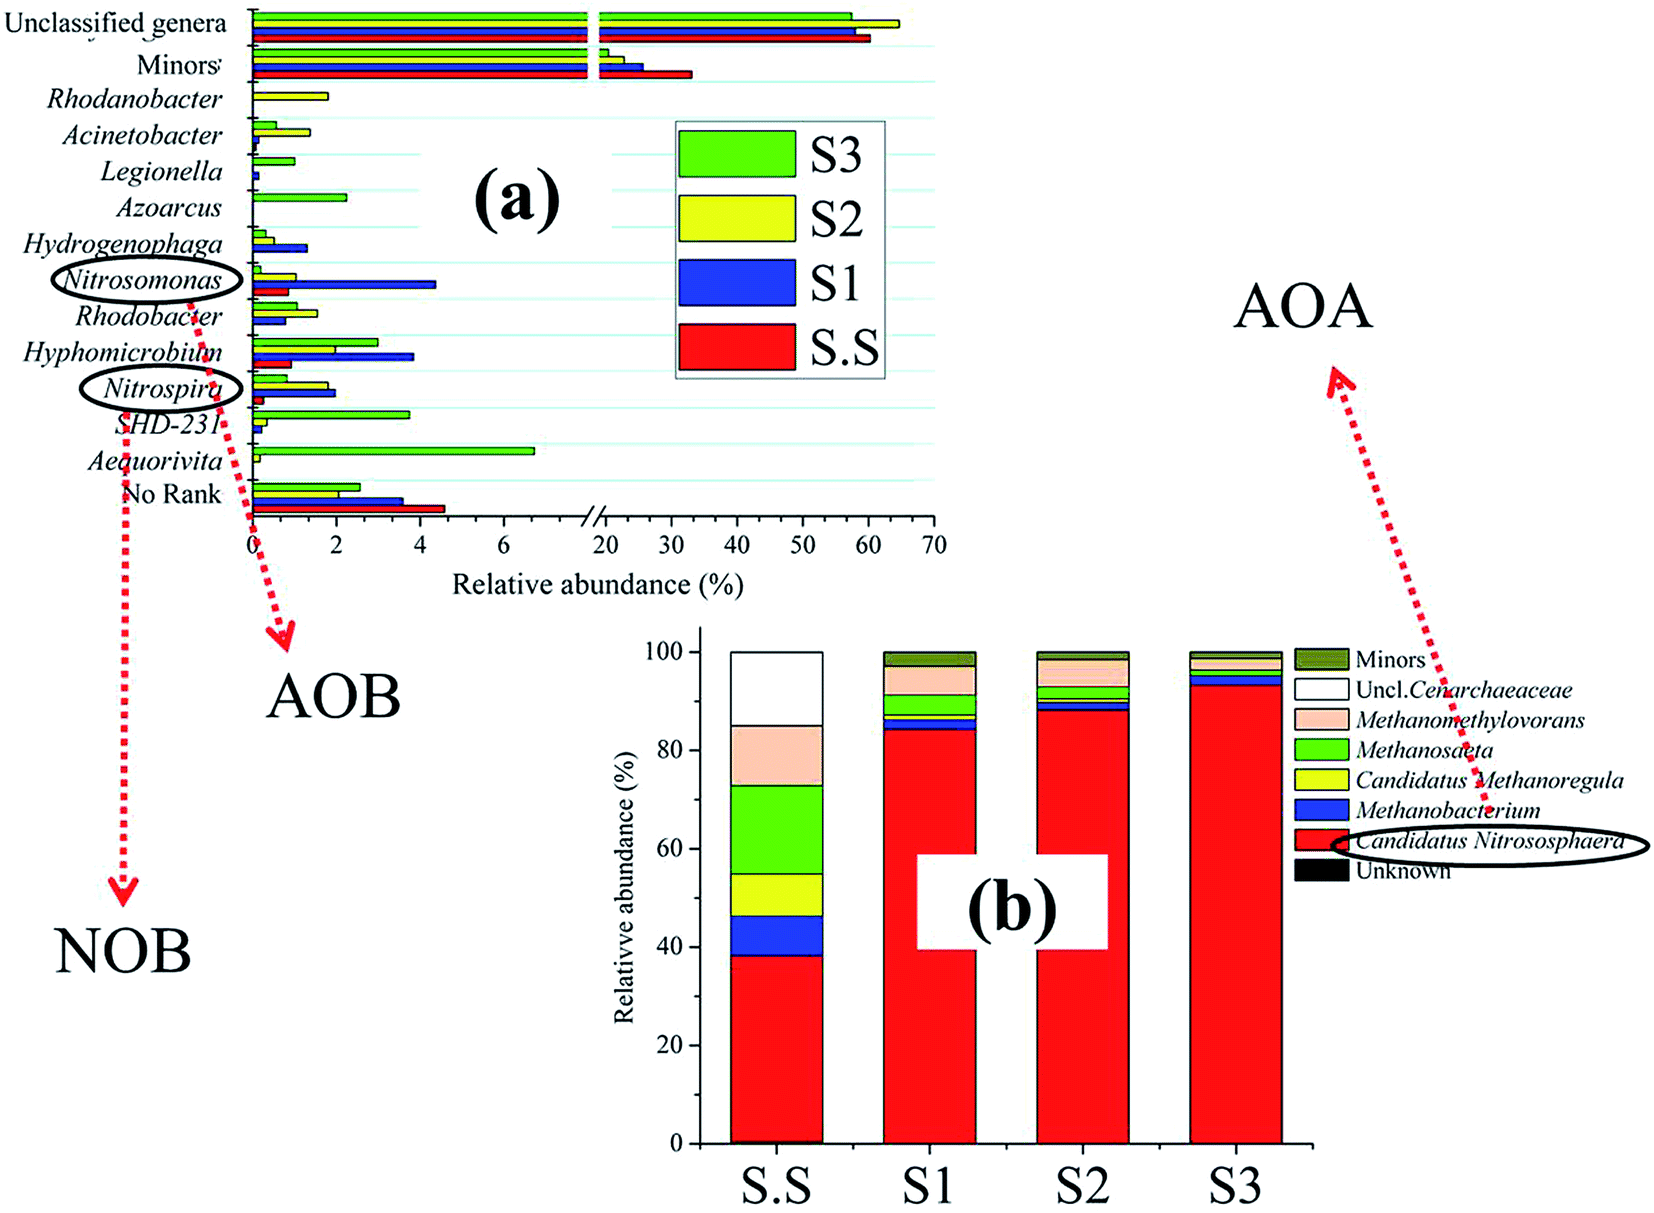 | ||
| Fig. 6 Microbial community distributions at genus level. (a) Bacteria, (b) archaea. | ||
Previous studies have demonstrated that the widespread existence of archaea associated with ammonia oxidation (AOA) in a variety of environments, such as hot spring,25 marine,26 soil,27 and WWTPs.28 Subsequently, detailed information about archaeal composition was explored (Fig. 6b). The representative AOA, Candidatus Nitrososphaera, which was affiliated with Thaumarchaeota, comprised almost the entire archaeal community in biofilms, and showed the greatest relative abundance in S3 (93.3%). The distribution of this type of AOA group I.1b29 was initially reported in terrestrial hot springs.30 The archaea can thrive in the nutrient-limited environments through the aerobic oxidation of the nanomolar concentrations of ammonia for CO2 fixation.31 In this study, Candidatus Nitrososphaera showed stronger salt resistance compared with Nitrosomonas, and might play an important role in the removal of NH4–N at a high concentration (30 mg L−1). Generally, AOA is dominated in number and function under natural extreme environments (e.g., high salinity, high temperature).32,33 However, whether or not this is the case in such artificial wastewater system should be clarified in future efforts. There is no denying that biofilms on the aerated membrane can provide appropriate niches for the adherence and growth of AOA if given proper conditions, for example, the appropriate seed sludge must contain a certain amount of AOA. It is easy to imagine that the reactor could not successfully or easily achieve the nitrification process if the inoculation sludge do not include AOA.
Although a large amounts of bacteria were identified as unknown or minors (<1%), some unique genera were still detected abundant in the S3-biofilm and might play an important role in the removals of carbon and nitrogen in MABR (Fig. 6a). For example, Azoarcus (2.2% in S3),34 Rhodobacter (1.1% in S3),35 and Hyphomicrobium (3.0% in S3) have been consistently found in industrial and domestic wastewaters and might be involved in the denitrifying process. Meanwhile, the phenomenon of aerobic denitrification observed in this experiment was likely associated with Hyphomicrobium. Related studies have reported the function of the genus in other wastewater treatments.36 Aequorivita, accounted for nearly 7.0% in S3, thus, it cannot be overlooked even though it was hardly detected in WWTPs. The special microbe was first discovered in Antarctic waters,37 and in other marine regions.38 It is strictly aerobic and chemoautotrophic. Obviously, the bacteria tended to live in high-salt environments, but their exact role in wastewater treatment is still unclear. Meanwhile, some methanogens, such as Methanomethylovorans, Methanobacterium and Methanosaeta, also showed strong salt tolerance although they were only in the minority in biofilms. These archaea are always detected in the anaerobic digestion systems,39,40 which probably inhabited in the region in biofilms away from membrane and involved in the methanogenesis.
4. Conclusion
In this study, a comprehensive experiment was conducted to evaluate the performance of saline wastewater treatment in the MABR system as well as to explore the bacterial and archaeal communities in biofilms. The experiment was done with the aim of further understanding how salinity affected these microorganisms and the removal performance in MABR. Test results revealed that MABR was suitable for the treatment of domestic sewage with high salinity. Compared with AOB, AOA probably contributed most to the ammonia oxidation process under conditions of high salt stress. Although the community diversity was decreased when salt was added into wastewater, the overall removal effects did not suffer significantly because of the unique microbial community composition and distribution in biofilm under high-salt conditions.However, more research efforts should be exerted to further identify the activity of AOA and AOB under salty pressure (e.g., determining the amoA gene transcription by real-time RT-PCR technology), and to characterize the spatial distribution of AOA in biofilm (e.g., applying FISH technology). The aim of these efforts is to study the influence of salinity on AOA towards the improved MABR application in domestic saline sewage treatment in the future.
Acknowledgements
The authors are extremely thankful to Xiang-Lin Lv and Ying-ChunYan for the assistance with sequence analysis. This study was supported by the National Natural Science Foundation of China (No. 51478304 and No. 31400103) and the Tianjin Scientific and Technological Planning Project, China (No. 13ZCZDSF00500).References
- C. Yang, W. Zhang, R. H. Liu, Q. Li, B. B. Li, S. F. Wang, C. J. Song, C. L. Qiao and A. Mulchandani, Environ. Sci. Technol., 2011, 45, 7408–7415 CrossRef CAS PubMed.
- K. Yamagiwa, A. Ohkawa and O. Hirasa, J. Chem. Eng. Jpn., 1994, 27, 638–643 CrossRef CAS.
- K. Brindle, T. Stephenson and M. J. Semmens, J. Membr. Sci., 1998, 144, 197–209 CrossRef CAS.
- K. Brindle and T. Stephenson, Biotechnol. Bioeng., 1996, 49, 601–610 CrossRef CAS PubMed.
- C. Pellicer-Nàcher and B. F. Smets, Water Res., 2014, 57, 151–161 CrossRef PubMed.
- X. Wei, B. A. Li, S. Zhao, L. Wang, H. Y. Zhang, C. Li and S. C. Wang, Bioresour. Technol., 2012, 122, 189–195 CrossRef CAS PubMed.
- H. L. Tian, H. M. Zhang, P. Li, L. Q. Sun, F. F. Hou and B. A. Li, RSC Adv., 2015, 5, 69829–69838 RSC.
- Y. Qing, X. H. Liu, C. Y. Peng, S. Y. Wang and Y. Z. Peng, Environ. Sci. Technol., 2009, 43, 9400–9406 CrossRef PubMed.
- L. Ren, Y. Ahn and B. E. Logan, Environ. Sci. Technol., 2014, 48, 4199–4206 CrossRef CAS PubMed.
- S. Aslan and E. Simsek, Bioresour. Technol., 2012, 118, 24–29 CrossRef CAS PubMed.
- C. Cortes-Lorenzo, M. Rodriguez-Diaz, C. Lopez-Lopez, M. Sanchez-Peinado, B. Rodelas and J. Gonzalez-Lopez, Bioresour. Technol., 2012, 121, 312–319 CrossRef CAS PubMed.
- F. Omil, R. J. Mendéz and J. M. Lema, J. Chem. Technol. Biotechnol., 1995, 63, 384–392 CrossRef CAS.
- A. R. Dinçer and F. Kargi, Environ. Technol., 2010, 20, 1147–1153 CrossRef.
- Z. L. She, L. T. Zhao, X. L. Zhang, C. J. Jin, L. Guo, S. Y. Yang, Y. G. Zhao and M. C. Gao, Chem. Eng. J., 2016, 288, 207–215 CrossRef CAS.
- T. Shinohara, S. Qiao, T. Yamamoto, T. Nishiyama, T. Fujii, T. Kaiho, Z. Bhatti and K. Furukawa, J. Biosci. Bioeng., 2009, 108, 330–335 CrossRef CAS PubMed.
- Y. Bai, Q. Sun, D. Wen and X. Tang, FEMS Microbiol. Ecol., 2012, 80, 323–330 CrossRef CAS PubMed.
- C. Cortés-Lorenzo, D. Sipkema, M. Rodríguez-Díaz, S. Fuentes, B. Juárez-Jiménez, B. Rodelas, H. Smidt and J. González-López, Ecological Engineering, 2014, 71, 126–132 CrossRef.
- A. Breuker, S. Stadler and A. Schippers, FEMS Microbiol. Ecol., 2013, 85, 578–592 CrossRef CAS PubMed.
- D. P. Herlemann, M. Labrenz, K. Jürgens, S. Bertilsson, J. J. Waniek and A. F. Andersson, ISME J., 2011, 5, 1571–1579 CrossRef CAS PubMed.
- C. Díez-Vives, J. M. Gasol and S. G. Acinas, Microb. Ecol., 2012, 64, 1047–1055 CrossRef PubMed.
- T. Osaka, K. Shirotani, S. Yoshie and S. Tsuneda, Water Res., 2008, 42, 3709–3718 CrossRef CAS PubMed.
- C. S. Liu, C. C. Zhao, A. J. Wang, Y. D. Guo and D. J. Lee, Appl. Microbiol. Biotechnol., 2015, 99, 6463–6469 CrossRef CAS PubMed.
- C. Y. Hwang and B. C. Cho, Int. J. Syst. Evol. Microbiol., 2008, 58, 1591–1597 CrossRef CAS PubMed.
- H. Y. Xu, L. P. Chen, S. Z. Fu, H. X. Fan, Y. G. Zhou, S. J. Liu and Z. P. Liu, Int. J. Syst. Evol. Microbiol., 2009, 59, 2297–2301 CrossRef CAS PubMed.
- R. Hatzenpichler, E. V. Lebedeva, E. Spieck, K. Stoecker, A. Richter, H. Daims and M. Wagner, Proc. Natl. Acad. Sci. U. S. A., 2008, 105, 2134–2139 CrossRef CAS PubMed.
- C. A. Francis, K. J. Roberts, J. M. Beman, A. E. Santoro and B. B. Oakley, Proc. Natl. Acad. Sci. U. S. A., 2005, 102, 14683–14688 CrossRef CAS PubMed.
- H. T. Wang, C. W. Marshall, M. Y. Cheng, H. J. Xu, H. Li, X. R. Yang and T. L. Zheng, Sci. Rep., 2017, 7, 44049 CrossRef PubMed.
- L. A. Sauder, M. Albertsen, K. Engel, J. Schwarz, P. H. Nielsen, M. Wagner and J. D. Neufeld, ISME J., 17, 1142–1157 Search PubMed.
- M. Pester, T. Rattei, S. Flechl, A. Gröngröft, A. Richter and J. Overmann, Environ. Microbiol., 2012, 14, 525–539 CrossRef CAS PubMed.
- J. R. de la Torre, C. B. Walker, A. E. Ingalls, M. Koenneke and D. A. Stahl, Environ. Microbiol., 2008, 10, 810–818 CrossRef CAS PubMed.
- M. Konneke, D. M. Schubert, P. C. Brown, M. Hugler, S. Standfest, T. Schwander, L. Schada von Borzyskowski, T. J. Erb, D. A. Stahl and I. A. Berg, Proc. Natl. Acad. Sci. U. S. A., 2014, 111, 8239–8244 CrossRef PubMed.
- D. A. Stahl and J. R. de la Torre, Annu. Rev. Microbiol., 2012, 83–101 CrossRef CAS PubMed.
- W. Qin, S. A. Amin, W. Martens-Habbena, C. B. Walker, H. Urakawa, A. H. Devol and A. E. Ingalls, Proc. Natl. Acad. Sci. U. S. A., 2014, 111, 12504–12509 CrossRef CAS PubMed.
- D. J. Lee and B. T. Wong, Bioresour. Technol., 2014, 166, 616–619 CrossRef CAS PubMed.
- K. Song, T. Suenaga, A. Hamamoto, K. Satou, S. Riya, M. Hosomi and A. Terada, J. Biosci. Bioeng., 2014, 118, 289–297 CrossRef CAS PubMed.
- J. B. M. Meiberg, P. M. Bruinenberg and W. Harder, J. Gen. Microbiol., 1980, 453–463 CAS.
- J. P. Bowman and D. S. Nichols, Int. J. Syst. Evol. Microbiol., 2002, 52, 1533–1541 CAS.
- J. J. Liu, X. Q. Zhang, J. Pan, C. Sun, Y. Zhang, C. Q. Li, X. F. Zhu and M. Wu, Int. J. Syst. Evol. Microbiol., 2013, 63, 3192–3196 CrossRef CAS PubMed.
- A. M. Ziganshin, T. Schmidt, Z. P. Lv, J. Liebetrau, H. H. Richnow, S. Kleinsteuber and M. Nikolausz, Bioresour. Technol., 2016, 217, 62–71 CrossRef CAS PubMed.
- A. M. Ziganshin, E. E. Ziganshina, S. Kleinsteuber and M. Nikolausz, Archaea, 2016, 2016, 3401272 CrossRef PubMed.
Footnotes |
| † Electronic supplementary information (ESI) available. See DOI: 10.1039/c7ra03755d |
| ‡ These authors contributed equally to this work. |
| This journal is © The Royal Society of Chemistry 2017 |