 Open Access Article
Porous SnO2 hexagonal prism-attached Pd/rGO with enhanced electrocatalytic activity for methanol oxidation
Yiran Hu,
Tao Mei,
Jinhua Li ,
Jianying Wang and
Xianbao Wang
 *
*
Hubei Collaborative Innovation Center for Advanced Organic Chemical Materials, Key Laboratory for the Green Preparation and Application of Functional Materials, Ministry of Education, Hubei Key Laboratory of Polymer Materials, School of Materials Science and Engineering, Hubei University, Wuhan 430062, China. E-mail: wangxb68@aliyun.com; Fax: +86 2788661729; Tel: +86 2788661729
First published on 8th June 2017
Abstract
Porous SnO2 hexagonal prisms, as a new promoter, were attached to Pd-based systems held by a reduced graphene oxide (rGO) support (Pd–SnO2/rGO) for the catalysis of the electrooxidation reaction of methanol. Cyclic voltammetry (CV) tests revealed that the electrocatalytic activity and stability were substantially improved by SnO2 with a special morphology. The specific activity (SA, jk, area) and mass activity (MA, jk, area) of Pd–SnO2/rGO were enhanced 1.31 and 3.3 times those of the Pd/rGO catalyst, respectively. Moreover, the CO-tolerance was also remarkably enhanced due to the presence of SnO2. It is believed that higher surface areas, more active sites, which are offered by the porous architecture of SnO2, as well as the synergetic effect between all components contribute to the improvement of the catalytic activities of the Pd–SnO2/rGO catalysts. Cost savings and the CO-poisoning obstacle being surmounted, which are the two main probing directions for elevating the overall performance of direct methanol fuel cells, makes the as-prepared Pd–SnO2/rGO a promising electrocatalyst.
1 Introduction
Direct methanol fuel cells (DMFCs) possess significant potential for portable devices and transportation utilization since the possibility of directly using fuel (methanol) at low operating temperatures and the interoperability of the existing distribution and consumption pattern of liquid fuel.1–4 For methanol electrooxidation at the anode, palladium is regarded as an eye-catching alternative to platinum as a catalyst. Besides their lower price as compared to the Pt-based electrocatalysts, Pd-based electrocatalysts can achieve appreciable activity for the oxidation of methanol in a high pH environment, where non-precious metals are adequately stable for electrochemical applications.5 The stability of base metals in an alkaline environment provides us more choices to cut down the expenditure of the catalysts. In addition, the better CO-type intermediates tolerance was shown in Pd-based electrocatalysts than in Pt-based electrocatalysts, especially when the pH is high.6 The intermediates during the electrooxidation of methanol, especially carbon monoxide, are strongly absorbed onto the active site of pure noble metals, such as Pd, and limit the catalytic efficiency.To save costs as well as overcome the CO-poisoning obstacle, a number of studies have been performed to achieve a satisfactory effectiveness of the Pd-based electrocatalysts. The most widely accepted strategy is to use less-precious metals to combine alloys, such as Pd–Cu,7,8 Pd–Ni,9 and Pd–Ag,10,11 or introduce metal oxides, such as NiO,12 CeO2 (ref. 13), MnO2 (ref. 13) and SnO2 (ref. 13), as co-catalysts. Compared to pure metals, metal oxides provide more possibilities of forming a construction that is more complicated and stable. Among all types of metal oxide promoters, SnO2 attracts significant attention due to its great stability as well as particular electrochemical properties. It has been extensively used in protection against corrosion, catalysts, and even been considered as a substitute for commercial graphite as an anode of a lithium-ion battery (LIB).1,14 Moreover, SnO2 can be a promoter of water displacement, which is the step that determines the rate of methanol oxidation.15
Furthermore, a proper support should be selected for the reason that the inevitable aggregation of nanosized catalysts may reduce the activity of the materials. The large surface areas and numerous active sites of the nanoparticles are crucial to the catalytic characteristics, on account of the surface where the catalytic reaction usually proceeds. Among the carbon materials, graphene is appropriate for Pd particles to disperse on it. Its ultrahigh electrical conductivity, large surface area, and abundant functional groups (hydroxyls, epoxides, carbonyls, etc.), which can immobilize and fix nanoparticles, can theoretically enhance the properties of the Pd-based electrocatalysts.16–19
Apart from the characteristics of each component, some outstanding superior and synergetic properties can be manifested when they are smartly integrated together. For instance, the electronic configuration, stability, and flexibility of the structures and the efficiency of electron transfer might be enhanced, as well as the number of electroactive sites can be increased.20–22
Herein, porous SnO2 hexagonal prism-attached Pd/rGO was prepared by the co-reduction of PdCl42− and GO with porous SnO2 hexagonal prisms, which was pre-prepared with water soluble chitosan as a dispersing agent in deionized pure water and excess NaBH4 as a reductant. The oil-bath reaction under constant pressure and relatively low temperature conserves energy and is more practicable for large-scale production. Although SnO2-enhanced Pd-based electrocatalysts with carbon supports have been reported, to the best of our knowledge, SnO2 with a specific morphology has never been used in anodic catalysts for methanol oxidation. The porous SnO2 hexagonal prism obtained in advance was not destroyed during the entire reduction reaction and provided more active sites. High-performance catalysts always have high surface areas and some of them have a porous construction. The interior hollow parts of the porous SnO2 decrease the quantity of the buried nonfunctional Pd atoms, and the uncommon geometry offers a great possibility to trim physical and chemical properties.23 Compared to pure Pd supported on rGO or on porous SnO2 hexagon, the as-prepared porous SnO2 hexagonal prism-attached Pd/rGO exhibits superior activity towards the oxidation of methanol that benefits from higher surface areas, more active sites, which were offered by the individual components, as well as the synergetic effect between all of them.
2 Experimental
2.1 Chemicals
Every reagent was maintained as received and no further purification was carried out before use. Analytical grade SnCl4·5H2O, NaOH, CuCl2·H2O, NaBH4, PdCl2, and CH3OH were obtained from Sinopharm Chemical Reagent Co. Water soluble chitosan was bought from Zhejiang Aoxing Biotechnology Co. Ltd. The few-layered GO was purchased from Hunan Fenghua Chemical Co. The experimental deionized water was freshly processed by a P60-CY Kertone Ultrapure Water System (Kertone Water Treatment Co. Ltd, resistivity = 18.25 MΩ cm).2.2 Synthesis of the porous SnO2 hexagonal prisms
The porous SnO2 hexagonal prisms were synthesized using a water-bath method with some modification.24 In a typical synthesis of the porous SnO2 hexagonal prisms, first 0.79 g of SnCl4·5H2O was dissolved in 100 mL of distilled water under stirring at room temperature, and then, 0.76 g of NaOH was added under continuous vigorous stirring. After the solution became clear, 50 mL solution of 0.375 g CuCl2·H2O was poured into the abovementioned uniform solution at 30 °C and was stirred for 15 min, resulting in a milky blue sediment. The resultant blend was allowed to stand at 30 °C for 6 h. The obtained sediment was centrifuged, ultrasonically cleaned using ultrapure water and absolute ethyl alcohol three times each and kept in a drying oven at 50 °C for 12 h. Subsequently, the product was annealed at 620 °C for 2 h in air atmosphere, resulting in a black powder. The black powder was soaked in 50 mL of 3.0 M HCl for 30 min at room temperature under stirring until the powder totally turned off-white. Finally, the off-white powder was washed with ultrapure water until the pH of the upper clear water was neutral.2.3 Preparation of the porous SnO2 hexagonal prism-attached Pd/rGO
Porous SnO2 hexagonal prism-attached Pd/rGO catalyst (denoted as SnO2–Pd/rGO) was obtained via a reduction method in only one step. In the standard preparation, 60 mg of GO powder was first ultrasonically dispersed in 50 mL of distilled water for 1 h. The mixture was obtained by blending 10 mg of the porous SnO2 hexagonal prisms and was homogenously dispersed in 20 mL water after ultrasonication for 10 min, 20 mL PdCl2 solution (5 mM), 2 mL solution of water soluble chitosan (0.1%) together with the obtained GO homogeneous solution. The abovementioned mixture was transferred into a 150 mL round-bottomed flask and constantly stirred for 30 min. After this, the uniform solution was placed in an oil bath. When the temperature reached 100 °C, a 20 mL solution containing 1.2 g NaBH4 was added dropwise into the flask under continuous stirring. The oil bath was controlled at 100 °C for 4 h to obtain the SnO2–Pd/rGO catalyst.2.4 Material characterization
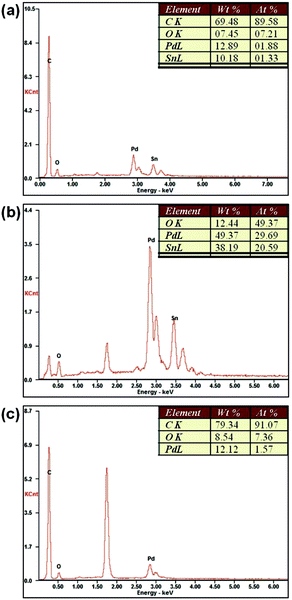
The morphology and microstructure of the catalyst were observed using transmission electron microscopy (TEM, Tecnai F20) and field emission scanning electron microscopy (FE-SEM, JSM7100F). Energy dispersive X-ray spectroscopy (EDX) was used to analyze the mass distribution of the elements using an analyzer attached to the FE-SEM. Powder XRD was carried out using a D8-Advance diffractometer (Bruker, Germany) with a Cu Kα radiation source (λ = 0.15418 nm). The surface elemental composition of the sample was investigated via X-ray photoelectron spectroscopy (XPS; Thermo Fisher Scientific Escalab 250Xi).2.5 Electrochemical measurements
A CHI760E electrochemical workstation (Shanghai Chenhua, China) was employed for the electrochemical studies at room temperature (∼25 °C). The measurements were performed using a three-electrode configuration that was composed of a modified glass carbon electrode (GCE) (3 mm in diameter), a platinum electrode, and a saturated calomel electrode (SCE) as the working, counter, and reference electrodes, respectively. Before the surface coating, the GCE was polished to a mirror-like finish with 0.3 and 0.05 μm alumina powder and rinsed with nitric acid solution, ethanol, and doubly distilled water using an ultrasonic cleaner and dried in air. Each specimen was ultrasonically dispersed in 500 μL of ethanol to obtain a uniform catalyst ink of 2 mg mL−1. After at least 60 min of ultrasonic cleaning, a 3 μL droplet of the resulting mixture was pressed onto the polished GCE and dried at 25 °C for 1 h. High purity N2 was utilized to deaerate the electrolyte for at least 30 min before all the measurements. For the methanol electrooxidation tests, an alkaline solution with 0.5 M KOH and 1 M CH3OH was used as the electrolyte.3 Results and discussion
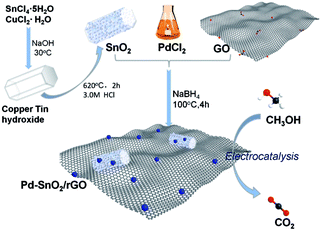
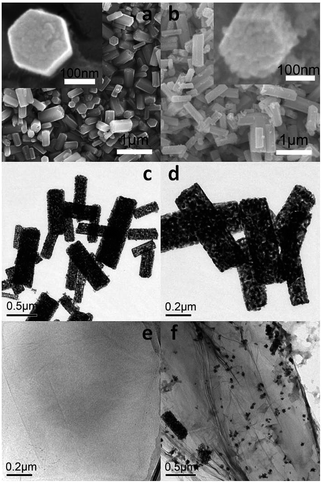
The porous SnO2 hexagonal prism was prepared using a special method without any template. The solid hexagonal prisms of copper tin hydroxide were first obtained through the reaction of SnCl4·5H2O and CuCl2·H2O with NaOH via a water-bath method. After the basic morphology was successfully attained with the help of CuCl2·H2O, the hydroxide was separated into CuO and SnO2 after the annealing process with the morphology being retained. Taking the stability of SnO2 under an acidic condition into consideration, 3 M HCl was used to remove the CuO part and the porous nanostructures of SnO2 were obtained from the remaining vacancies of CuO. The oil bath with NaBH4 as a reducing agent provides an alkaline environment, which is appropriate for GO reduction. Water-soluble chitosan as a dispersing agent prevents the rGO assembling to graphite to a great extent. The formation strategy for preparing Pd–SnO2/rGO is demonstrated in Scheme 1.The porous SnO2 hexagonal prism was synthesized with a length of 0.4–1.0 μm and a width of 0.1–0.4 μm (Fig. 1a–d). The evenly distributed porous structures can be clearly observed from the TEM images. On amplifying the images of the shape of one end of the obtained copper tin hydroxide and porous SnO2 hexagonal prism (inset in Fig. 1a and b), a special six-prism shape was observed. Fig. 1a and b are the SEM images of the solid hexagonal prisms of copper tin hydroxide and porous hexagonal prisms of SnO2, respectively, and they show a similar morphology. Fig. 1c and d are the TEM images of the porous SnO2 and Pd/SnO2 hexagonal prisms. Fig. 1f illustrates the TEM image of Pd–SnO2/rGO, which indicates that the porous hexagonal prisms of SnO2 maintained the basic morphology after the reduction. Theoretically, SnO2 would turn into stanniferous salts in a strong alkali environment only when the temperature is above 750 °C; thus, its components would not be affected during the entire reaction. The structure of the SnO2 hexagonal prisms was not broken by the airflow caused by the relatively moderate reaction mode of an oil bath, as shown in Fig. 1f. Pd nanoparticles on the surface of rGO were uniformly distributed. The TEM image of a few-layered GO is presented in Fig. 1e as a reference.
Fig. 2 shows the XRD patterns for the as-synthesized samples over the 2θ range of 5–85°. It can be clearly seen from Fig. 2a that the XRD patterns of the as-prepared and the purchased SnO2 have the same diffraction peaks of SnO2 (JCPDS: 41-1445), which indicates that SnO2 has been successfully synthesized. Pure Pd NPs with face-centered cubic (fcc) crystalline structures show 2θ values of (111), (200), and (220) that are consistent with the standard values of Pd (JCPDS: 87-0643). The XRD diffraction peaks of the (111), (200), and (220) facets of the fcc crystalline structures can be observed at 2θ = 39°, 45°, and 67° from Fig. 2b. The plane characteristic peak of Pd (111) was adopted to estimate the average crystallite size D of the Pd NPs following the Scherrer's equation:
D = 0.9λ/β![[thin space (1/6-em)]](https://www.rsc.org/images/entities/char_2009.gif) cos cos![[thin space (1/6-em)]](https://www.rsc.org/images/entities/char_2009.gif) θ θ
| (a) |
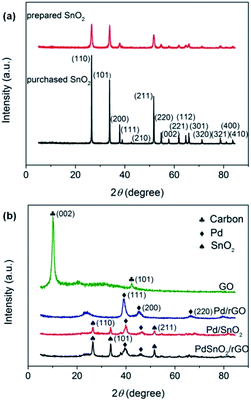 | ||
| Fig. 2 (a) XRD patterns of the prepared and purchased SnO2 and (b) XRD patterns of the purchased GO and prepared Pd/rGO, Pd/SnO2, and Pd–SnO2/rGO. | ||
In the abovementioned formula, λ (nm) is the X-ray wavelength (λ = 0.15418 nm for Cu Kα), β (rad) is the full width at half-maximum (FWHM) of the peak in the diffraction pattern, and θ (rad) is the Bragg diffraction peak. According to Fig. 2b, the FWHM are 0.830, 0.795, and 0.745 for Pd/rGO, Pd/SnO2, and Pd–SnO2/rGO catalysts, respectively. On calculating using eqn (a), the crystallite sizes of the Pd NPs were found to 10.05, 10.50, and 11.20 nm for the Pd/rGO, Pd/SnO2, and Pd–SnO2/rGO catalysts, respectively. Compared to the peaks of SnO2 shown in Fig. 2a, there are fewer peaks that can be clearly observed. The diffraction characteristic peaks at 2θ = 26.6°, 33.9°, and 51.8° correspond to the (100), (101), and (211) facets, respectively, of tetragonal SnO2, as shown in Fig. 2b; however, other peaks are weak and cannot even be observed. The faint peaks of SnO2 were hardly observed since the main Pd diffraction peaks and the sharp peaks of SnO2 were comparatively stronger. The crystallinity of SnO2 becomes pronounced in Pd–SnO2/rGO as evidenced by the increased intensity of the diffraction peaks.25 Moreover, as shown in the XRD patterns of GO, a sharp peak at 2θ = 11° of the C (002) facets can be observed. The fact that no obvious peaks can be found at the same positions in the patterns of other samples illustrates that GO is indeed partially reduced and rGO is formed. The XRD pattern of Pd/rGO has a wide peak at around 2θ = 23°, whereas the pattern of Pd–SnO2/rGO does not show this peak. This indicates that the reduction degree of GO among Pd–SnO2/rGO was better than that of Pd/rGO. Moreover, the peak of SnO2 could also hinder the observation of this diffraction peak.
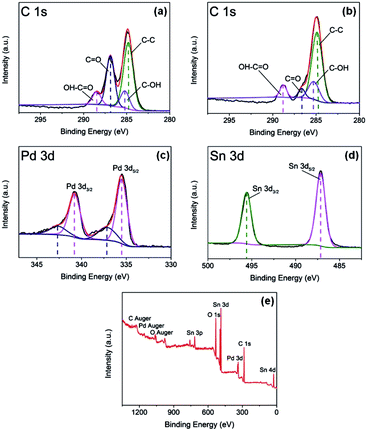
XPS analysis was used for investigating the surface composition and electron configuration of the prepared catalysts. Fig. 3a and b reveal the C 1s regions of the purchased GO and Pd–SnO2/rGO. From the C 1s spectra of GO and Pd–SnO2/rGO, four components corresponding to C–C, C–OH, C–O, and OH–C![[double bond, length as m-dash]](https://www.rsc.org/images/entities/char_e001.gif) O species can be further separated out. On the basis of the correlation of the C 1s spectrum of graphene oxide (Fig. 3a) and that of the Pd–SnO2/rGO (Fig. 3b), the reduction in the quantity of oxygenated functional groups was observed, also indicating the high reduction of GO via thermal and chemical reactions. Taken together with the results of XRD and the XPS spectra, it was observed that GO was highly reduced by NaBH4. Spectral peaks of Pd 3d and Sn 3d were observed in Pd–SnO2/rGO (Fig. 3c and d), validating the existence of Pd and SnO2 in the obtained sample. The Pd 3d spectrum, as shown in Fig. 2c, is formed by the Pd 3d3/2 and Pd 3d5/2 states, and the two signals can be further deconvoluted into two components of Pd2+ and Pb0, respectively. The percentage of Pb0 is about 77.8%, as measured by the relative peak areas, indicating that after the synthesis process, Pd–SnO2/rGO mainly contain Pb0 with a few oxidation states of palladium from the un-reacted ions.17,26,27 Pd2+ was inevitably adsorbed onto the hollow portion of SnO2 owing to the large surface areas of the porous construction and was not totally exposed for the reduction reaction to occur. The Sn 3d spectrum, as seen in Fig. 2d, has two peaks of Sn 3d3/2 at 495.5 eV and Sn 3d5/2 at 487.0 eV, which is in good agreement with the energy splitting reported for SnO2.28 Fig. 2e presents the survey spectra of the porous SnO2 hexagonal prism-attached Pd/rGO, which reveals that there are no other heteroelements apart from Pd, Sn, C, and O. The O 1s was detected at 530.8 eV, where the peak of the oxygen species appeared in SnO2.
O species can be further separated out. On the basis of the correlation of the C 1s spectrum of graphene oxide (Fig. 3a) and that of the Pd–SnO2/rGO (Fig. 3b), the reduction in the quantity of oxygenated functional groups was observed, also indicating the high reduction of GO via thermal and chemical reactions. Taken together with the results of XRD and the XPS spectra, it was observed that GO was highly reduced by NaBH4. Spectral peaks of Pd 3d and Sn 3d were observed in Pd–SnO2/rGO (Fig. 3c and d), validating the existence of Pd and SnO2 in the obtained sample. The Pd 3d spectrum, as shown in Fig. 2c, is formed by the Pd 3d3/2 and Pd 3d5/2 states, and the two signals can be further deconvoluted into two components of Pd2+ and Pb0, respectively. The percentage of Pb0 is about 77.8%, as measured by the relative peak areas, indicating that after the synthesis process, Pd–SnO2/rGO mainly contain Pb0 with a few oxidation states of palladium from the un-reacted ions.17,26,27 Pd2+ was inevitably adsorbed onto the hollow portion of SnO2 owing to the large surface areas of the porous construction and was not totally exposed for the reduction reaction to occur. The Sn 3d spectrum, as seen in Fig. 2d, has two peaks of Sn 3d3/2 at 495.5 eV and Sn 3d5/2 at 487.0 eV, which is in good agreement with the energy splitting reported for SnO2.28 Fig. 2e presents the survey spectra of the porous SnO2 hexagonal prism-attached Pd/rGO, which reveals that there are no other heteroelements apart from Pd, Sn, C, and O. The O 1s was detected at 530.8 eV, where the peak of the oxygen species appeared in SnO2.
The as-synthesized samples were further characterized via their electrochemical properties as a promising catalyst for the methanol oxidation reaction (MOR). The electrocatalytic behaviors of the porous SnO2 hexagonal prism-attached Pd/rGO catalyst were tested; moreover, for comparison, the same tests were carried out for graphene-based Pd (denoted as Pd/rGO), Pd based on porous the SnO2 hexagonal prisms (denoted as Pd/SnO2), and Pd prepared by reducing 5 mM PdCl2 aqueous solution with NaBH4 to figure out the structural advantages of Pd–SnO2/rGO and the enhancement from porous SnO2 hexagonal prisms and rGO. The catalytic activities of the specimens were acquired through CV tests in a N2-saturated alkaline solution of 0.5 M KOH + 1.0 M CH3OH. The currents of the catalytic activities of different catalysts were standardized, which was realized by the Pd mass, to make a comparison.
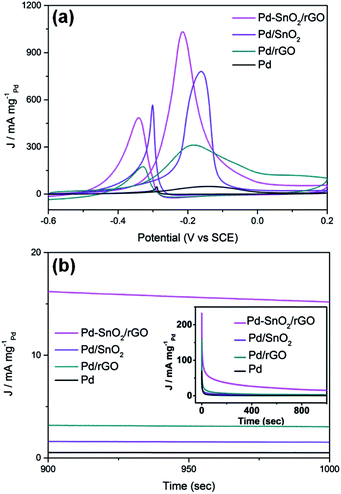
As can be distinctly seen in Fig. 4a, highest MA of the porous SnO2 hexagonal prism-attached Pd/rGO has a peak current of 1032.8 mA mgPd−1, which is around 1.3, 3.3, and 21.5 times that of Pd/SnO2 (780.5 mA mgPd−1), Pd/rGO (311.6 mA mgPd−1), and Pd (48.1 mA mgPd−1), respectively. After being scattered around the carbon material, in this case rGO, the mass activity of the Pd catalyst dramatically improved. The same enhancement appeared in the anchoring of Pd on porous SnO2 hexagonal prisms and rGO for increasing amount of transferred charge from the loaded Pd nanoparticals to the rGO funds. Moreover, the lower onset potential of Pd–SnO2/rGO than that of other reference materials (shown in Table 1) shows a substantially improved electrocatalytic activity of the porous SnO2 hexagonal prism-attached Pd/rGO towards methanol oxidation.
| Electrocatalyst | Pd mass content (wt%) | Peak current density (mA mgPd−1) | Eonset (V vs. SCE) | If/Ib ratio |
|---|---|---|---|---|
| Pd | 100.00 | 48.1 | −0.45 | 1.06 |
| Pd/rGO | 12.12 | 311.6 | −0.48 | 1.79 |
| Pd/SnO2 | 49.37 | 780.5 | −0.50 | 1.38 |
| Pd–SnO2/rGO | 12.89 | 1032.8 | −0.52 | 2.13 |
As for Pd-based catalysts, the mechanism of MOR under an alkaline condition is as follows:29,30
| Pd + CH3OH → Pd–(CH3OH)ads | (1) |
| Pd + OH− → Pd–(OH)ads + e− | (2) |
| Pd–(CH3OH)ads + OH− → Pd–(CH3O)ads + H2O + e− | (3) |
| Pd–(CH3O)ads + OH− → Pd–(CH2O)ads + H2O + e− | (4) |
| Pd–(CH2O)ads + OH− → Pd–(CHO)ads + H2O + e− | (5) |
| Pd–(CHO)ads + OH− → Pd–(CO)ads + H2O + e− | (6) |
| Pd–(CO)ads + Pd–(OH)ads → Pd–(COOH)ads + Pd | (7) |
| Pd–(COOH)ads + OH− → Pd + CO2 + H2O + e− | (8) |
CO, which is the main poisoning intermediate species of the catalyst, infects the active sites and significantly impedes the access of methanol, and the activity of the Pd-based catalysts thus drops. CO will be further oxidized to the final product CO2, which corresponds to the backward current density. Therefore, the ratio of the forward and backward oxidation current density If/Ib is a vital indicator to measure the endurance of the catalyst to poisoning types that are dominated by CO.31 From Fig. 4a, the If/Ib value of Pd–SnO2/rGO was detected to be 2.13, higher than that of Pd/rGO (shown in Table 1). The significant increase in If/Ib showed that on the surface of Pd–SnO2/rGO, methanol was more effectively oxidized and generated less poisoning species than on Pd/rGO. The reason for this variation is that the addition of SnO2 can promote the rate of methanol electrooxidation, which is closely related to water displacement. The adsorbed hydroxyl groups generated from the water displacement step reacted with the adsorbed CO and timely removed it, surmounting the CO-poisoning obstacle of Pd to a certain extent as follows:
| SnO2 + H2O → SnO2–(OH)ads + H+ + e− | (9) |
| Pd–(CO)ads + SnO2–(OH)ads → Pd + SnO2 + CO2 + H+ + e− | (10) |
Stability measurements of the catalysts were achieved via chronoamperometry (CA) in a N2-saturated alkaline solution with 0.5 M KOH and 1.0 M CH3OH and conducted at −0.1 V vs. SCE for 1000 s. As shown in Fig. 4b, for all the catalysts, the curves show an ultrafast fall-off at the beginning and then gradually reach a state that is approximately steady. The presented initial current was higher for the double layer charge as well as the abundant active sites held by the surface of the catalysts. Then, the intermediate products poison the samples and block the surface active sites, leading to a quick decline.32 The initial current of the porous SnO2 hexagonal prism-attached Pd/rGO catalyst was highest as well as steady stage current. Together with the minimal rate of current decay, Pd–SnO2/rGO definitely had the best poisoning tolerance and catalytic stability. The stronger metal–substrate interaction provides Pd/rGO with a higher steady current than that of Pd/SnO2, and it agrees with the results of the If/Ib value calculated by the CVs curves.
To further explore and compare the activities of the electrode materials, the electrochemical active surface areas (ECSAs) were tested. Fig. 5a presents the CVs of the Pd/rGO and porous SnO2 hexagonal prism-attached Pd/rGO catalysts from the fourth cycle. The CV scanning rate was 50 mV s−1 with a measuring potential ranging from −0.2 to 1 V (vs. SCE) in a solution of O2-removed 0.5 M H2SO4. A total of four portions can be seen in the sweeping curves corresponding to the four electrochemical redox processes that occur on the surface of three electrodes. The ECSAs of the catalysts based on Pt are normally calculated by obtaining the part of the CV curves corresponding to the coulombic charge for hydrogen desorption integrated in the CV.33 However, the cyclic voltammogram curves of Pd are way too far from those of Pt. Hydrogen is absorbed not only on the surface but strongly enough to be partly absorbed into the lattice of palladium. The H2 absorption started even before the underpotential deposition (UPD) of the absorbed hydrogen atoms and it led to an additional flux of faradaic current. Accordingly, two pathways for the desorption processes of hydrogen to the Pd surface or into the electrolyte from the lattice of palladium simultaneously proceed in the anodic sweep.
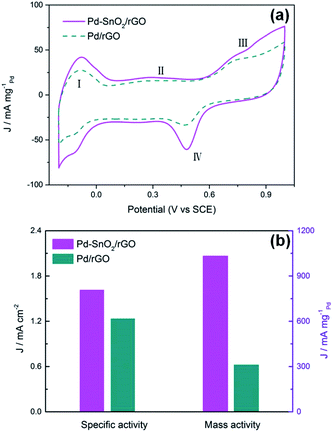 | ||
| Fig. 5 (a) CV curves for the Pd–SnO2/rGO and Pd/rGO catalyst-modified electrodes in O2-removed 0.5 M H2SO4. (b) The specific activity and mass activity at 0.50 V. | ||
Therefore, the ECSAs were measured by the area of peak IV generated from the reduction of Pd(II) during backward sweeping. Moreover, peak I can be due to the reaction of hydrogen oxidation, which emerges about between −0.2 and 0 V, and peak III is related to the generation of palladium(II) oxide on the surface of the Pd-based catalysts.6 The ECSAs were calculated by integrating the part of the CV curves that presented the reduction charge of the newly formed Pd(OH)2 layer:34
 | (b) |
4 Conclusion
In summary, a simple oil-bath method to prepare porous SnO2 hexagonal prism-attached Pd/rGO composite material was described; the composite material was characterized and tested as a catalyst for methanol electrooxidation. We chose SnO2 as a promoter of the Pd-based electrocatalyst to simultaneously cut the cost and accelerate the rate of the pivotal step of MOR. The step, which is water displacement, produces more hydroxyls to combine with the absorbed CO, thus easing the poisoning phenomenon of catalysts of MOR and strengthening the stability. Furthermore, the high surface areas of the porous structure of the SnO2 hexagonal prisms increase the number of active sites. Hollow parts of SnO2 together with the rGO support enable the Pd nanoparticles to be separated instead of being aggregated. The composite's electronic conductivity was also enhanced by the rGO support. Accordingly, in relation to Pd/SnO2, Pd/rGO, and Pd, Pd–SnO2/rGO has a substantially upgraded electrocatalytic activity and durability for methanol oxidation. This study is a new attempt of using SnO2 with a special morphology for MOR.Acknowledgements
This work was financially supported by the National Key R&D Program of China (Grant 2016YFA0200200) and National Natural Science Foundation of China (Grants 51203045 and 21401049).Notes and references
- X. Cui, Y. Zhu, Z. Hua, J. Feng, Z. Liu, L. Chen and J. Shi, Energy Environ. Sci., 2015, 8, 1261–1266 CAS.
- R. Ganesan and J. S. Lee, Angew. Chem., Int. Ed. Engl., 2005, 44, 6557–6560 CrossRef CAS PubMed.
- Y. G. Guo, J. S. Hu, H. M. Zhang, H. P. Liang, L. J. Wan and C. L. Bai, Adv. Mater., 2005, 17, 746–750 CrossRef CAS.
- H. Huang, J. Zhu, D. Li, C. Shen, M. Li, X. Zhang, Q. Jiang, J. Zhang and Y. Wu, J. Mater. Chem. A, 2017, 5, 4560–4567 CAS.
- C. Bianchini and P. K. Shen, Chem. Rev., 2009, 109, 4183–4206 CrossRef CAS PubMed.
- Y. Ren, S. Zhang and H. Li, Int. J. Hydrogen Energy, 2014, 39, 288–296 CrossRef CAS.
- K. Mandal, D. Bhattacharjee, P. S. Roy, S. K. Bhattacharya and S. Dasgupta, Appl. Catal., A, 2015, 492, 100–106 CrossRef CAS.
- Y. Xiong, W. Ye, W. Chen, Y. Wu, Q. Xu, Y. Yan, H. Zhang, J. Wu and D. Yang, RSC Adv., 2017, 7, 5800–5806 RSC.
- R. S. Amin, R. M. A. Hameed and K. M. El–Khatib, Appl. Catal., B, 2014, 148–149, 557–567 CrossRef CAS.
- Z. Li, L. Ye, Y. Wang, S. Xu, F. Lei and S. Lin, RSC Adv., 2016, 6, 79533–79541 RSC.
- S. Roy Chowdhury, S. Ghosh and S. K. Bhattachrya, Electrochim. Acta, 2017, 225, 310–321 CrossRef CAS.
- Y. Song, X. Zhang, S. Yang, X. Wei and Z. Sun, Fuel, 2016, 181, 269–276 CrossRef CAS.
- Y. Luo, Y. Xiao, G. Cai, Y. Zheng and K. Wei, Appl. Catal., B, 2013, 136, 317–324 CrossRef.
- B. L. Caetano, F. Meneau, C. V. Santilli, S. H. Pulcinelli, M. Magnani and V. Briois, Chem. Mater., 2014, 26, 6777–6785 CrossRef CAS.
- D. Sebastian, A. Stassi, S. Siracusano, C. L. Vecchio, A. S. Arico and V. Baglio, J. Electrochem. Soc., 2015, 162, F713–F717 CrossRef CAS.
- Y. Y. Tong, C. D. Gu, J. L. Zhang, M. L. Huang, H. Tang, X. L. Wang and J. P. Tu, J. Mater. Chem. A, 2015, 3, 4669–4678 CAS.
- L. Nan, Z. Fan, W. Yue, Q. Dong, L. Zhu, L. Yang and L. Fan, J. Mater. Chem. A, 2016, 4, 8898–8904 CAS.
- M. Liu, R. Zhang and W. Chen, Chem. Rev., 2014, 114, 5117–5160 CrossRef CAS PubMed.
- D. Chen, Y. Zhao, X. Peng, X. Wang, W. Hu, C. Jing, S. Tian and J. Tian, Electrochim. Acta, 2015, 177, 86–92 CrossRef CAS.
- M. A. Shenashen, D. Hassen, S. A. El-Safty, M. M. Selim, N. Akhtar, A. Chatterjee and A. Elmarakbi, Adv. Mater. Interfaces, 2016, 3, 1600743 CrossRef.
- M. Wang, Z. Ma, R. Li, B. Tang, X.-Q. Bao, Z. Zhang and X. Wang, Electrochim. Acta, 2017, 227, 330–344 CrossRef CAS.
- F. Colmati, E. Antolini and E. R. Gonzalez, Electrochim. Acta, 2005, 50, 5496–5503 CrossRef CAS.
- Y. J. K. C. Chen, Z. Y. Huo, Z. W. Zhu, W. Y. Huang, H. L. Xin, D. G. L. J. D. Synder, J. A. Herron, M. Mavrikakis, M. F. Chi, Y. D. L. K. L. More, N. M. Markovic, G. A. Somorjai, P. D. Yang and a. V. R. Stamenkovic, Science, 2014, 343, 1339 CrossRef PubMed.
- J. Huang, X. Xu, C. Gu, S. Yao, Y. Sun and J. Liu, CrystEngComm, 2012, 14, 3283 RSC.
- Z. Wang, D. Luan, F. Y. Boey and X. W. Lou, J. Am. Chem. Soc., 2011, 133, 4738–4741 CrossRef CAS PubMed.
- D.-X. Yu, A.-J. Wang, L.-L. He, J. Yuan, L. Wu, J.-R. Chen and J.-J. Feng, Electrochim. Acta, 2016, 213, 565–573 CrossRef CAS.
- S. Guo, S. Zhang, X. Sun and S. Sun, J. Am. Chem. Soc., 2011, 133, 15354–15357 CrossRef CAS PubMed.
- H. Song, L. Zhang, C. He, Y. Qu, Y. Tian and Y. Lv, J. Mater. Chem., 2011, 21, 5972 RSC.
- R. S. Amin, K. M. El-Khatib, S. Siracusano, V. Baglio, A. Stassi and A. S. Arico, Int. J. Hydrogen Energy, 2014, 39, 9782–9790 CrossRef CAS.
- G. Hu, F. Nitze, H. R. Barzegar, T. Sharifi, A. Mikołajczuk, C.-W. Tai, A. Borodzinski and T. Wågberg, J. Power Sources, 2012, 209, 236–242 CrossRef CAS.
- T. Wang, W. Cui, M. Peng, S. Ouyang and S. Wang, J. Mater. Chem. A, 2016, 4, 8584–8589 CAS.
- Z. Bo, D. Hu, J. Kong, J. Yan and K. Cen, J. Power Sources, 2015, 273, 530–537 CrossRef CAS.
- S. Lu, K. Eid, D. Ge, J. Guo, L. Wang, H. Wang and H. Gu, Nanoscale, 2017, 9, 1033–1039 RSC.
- L. Z. L. Xiao, Y. Liu, J. T. Lu and H. D. Abruna, J. Am. Chem. Soc., 2009, 131, 602–608 CrossRef CAS PubMed.
| This journal is © The Royal Society of Chemistry 2017 |

