DOI:
10.1039/C7RA03327C
(Paper)
RSC Adv., 2017,
7, 24895-24902
Synergistic influence of halogenated flame retardants and nanoclay on flame performance of high density polyethylene and wood flour composites†
Received
21st March 2017
, Accepted 1st May 2017
First published on 10th May 2017
Abstract
High density polyethylene and wood flour (HDPE/WF) composites containing three flame modifiers (FMs) (i.e., two fire retardants: 1,2-bis(pentabromophenyl) and ethylene bis(tetrabromophthalimide), and one nanoclay), maleic anhydride grafted polyethylene (MAPE) and other processing aids were prepared through twin-screw extrusion, and their properties were characterized. The addition of FMs lowered the composite strength, but composite modulus did not change in a systematic manner. The fiber-polymer interfacial adhesion became increasingly deteriorated with the FM addition, and the use of MAPE coupling agent in the composites helped improve the interfacial adhesion. There was a synergistic effect of the fire retardants, nanoclay and MA-g-PE, especially for 1,2-bis(pentabromophenyl)–clay–MAPE system, on thermal stability and fire retardancy with lowered heat release rate and total heat release of the composites, leading to significantly improved flame performance.
Introduction
Wood-plastic composites (WPCs) with a good combined dimensional and mechanical performance during their service life have been widely used in recent years.1 WPC has gained popularity in several fields, including construction (e.g., deck boards, building cladding), outdoor furniture, and automobiles (e.g., interior panels). However, one limitation for WPC's wide application is its poor fire resistance.2
The addition of flame retardants into WPCs through extrusion, compression and/or injection molding is widely used strategies for enhancing their flame performance. Phosphorous compound-based flame retardants, such as ammonium polyphosphate (APP), and combined expandable graphite and APP has been widely studied.3–11 However, these compounds release harmful gases upon the degradation and are limited for fire retardancy of polyolefin.12,13 Boron compounds, such as zinc borate (ZB) with high thermal stability and easy char formation, are also effective fire retardancy for WPC.14–17 Metal hydroxides, such as aluminum hydroxide and magnesium hydroxide showed high efficiency in fire resistance of WPC.18–21 However, high loadings of flame retardants (the boron compound and metal hydroxides) are required for a good fire performance, which normally deteriorates composite mechanical properties.22 Halogenated flame retardants are often used as effective flame retardants for WPCs.23 Unfortunately, high level of smoke is released due to its inefficient combustion.24 Thus, it is critical to lower the chemical loading for a successful application in WPCs.
Nanoclay with a high surface area and aspect ratio is a good candidate to overcome the aforementioned drawbacks in developing fire-resistant WPCs. The addition of a small amount of nanoclay helped improve mechanical properties, thermal stability and flame retardancy.13,25 For example, burning rate of high density polyethylene (HDPE)–wood composite was reduced with the use of nanoclay, and uniform clay dispersion generally enhanced the flame performance.24 It has also been reported that a better dispersion of montmorillonite clay promoted the char layer formation and thus reduced heat release rate of poly(vinyl chloride)/wood composites.26 However, flame retardancy data of nanoclay in WPCs is generally very limited; and nanoclay alone usually could not achieve high fire performance for WPCs. Recent studies have mostly concentrated on the combined use of two or more flame modifiers (FMs) in the search for their synergistic effects to reduce heat release, smoke evolution and the burning to give a better balance of flammability and mechanical properties for composites.26
The objective of this work was to provide a comparative study on the synergistic effect among fire retardants, nanoclay, and a compatibilizer on mechanical, thermal, and fire performance of WPCs. Extruded WPCs with and without FMs were made and analyzed through mechanical testing, scanning electronic microscopy (SEM), thermogravimetry and cone calorimetry. The chemical component, morphology and structure of residual composite powder after a complete combustion were also studied using attenuated total reflectance Fourier transform infrared (FTIR) spectroscopy, wide-angle X-ray diffraction (WAXD) and micromorphology observations. Finally, the flame retardant mechanism was proposed for the composite system.
Experimental
Materials
High density polyethylene (HDPE, AD60-007) pellets (density = 0.963 g cm−3, melt index = 0.73 g/10 min at 190 °C/2.16 kg and softening temperature = 127 °C) was purchased from ExxonMobile Chemical Co. (Houston, TX, USA). Pinewood flour (WF – a 40 mesh particle size) was obtained from American Wood Fiber Inc. (Schofield, WI, USA). Maleic anhydride grafted polyethylene (MA-g-MAPE) (G2608, melt index = 8 g/10 min at 190 °C/2.16 kg and acid number = 8 mg KOH per g) was supplied by Eastman Chemical Co. (King-sport, TN, USA). Fire retardants 1,2-bis(pentabromophenyl) (SA-8010) and ethylene bis(tetrabromophthalimide) (SABT-93) were supplied by Albemarle Co. (Baton Rouge, LA, USA). Nanoclay from Nanocor Inc. (Hoffman Estates, IL, USA) was a commercial HDPE based clay masterbatch with a clay content of 50 wt% (25 wt% MA-g-PE and 25 wt% PE), and lubricant (TPW 306) was obtained from Struktol Co. (Stow, OH, USA).
Compounding and extrusion
Wood flour was dried before compounding in a laboratory oven at 80 °C for 24 h to reduce its moisture content. Other raw materials including HDPE, MAPE and lubricant were used directly without further drying. Compounding was done using a Leistritz Micro-27 co-rotating parallel twin-screw extruder (Leistritz Co., Allendale, NJ, USA). The extruder has 11 heating zones with a screw length-to-diameter ratio of 40![[thin space (1/6-em)]](https://www.rsc.org/images/entities/char_2009.gif) :1. For compounding each target formulation, a mixture of HDPE, MAPE and/or clay master batch pellets was fed upstream with a weight-in-loss pellet feeder, and a mixture of powder wood four, lubricant and fire retardant additives was fed down-stream using another weight-in-loss powder feeder through a side-stuffer. The compounding was conducted using a screw speed of 50 rpm and a temperature profile of 155 (feeder), 160, 165, 170, 170, 170, 160, 155, 140, 140 and 155 °C (die). The extrudate was continuously pelletized into granules with a BT 25 pelletizer (Scheer Bay Co., Bay City, MI, USA). Composite samples were extruded using the prepared pellets. The Leistritz extrusion machine and a profile die were used to produce 5 mm thick × 100 mm wide test samples. Designation and composition of composites with fire retardants are listed in Table 1. It should be pointed out that the formulation design was based a constant wood loading (50 wt%) and a constant FM loading (7.5 wt%, except for the control group). The design led to some variation in actual HDPE and MAPE loading in the formulation, especially between the control and treatment groups.
:1. For compounding each target formulation, a mixture of HDPE, MAPE and/or clay master batch pellets was fed upstream with a weight-in-loss pellet feeder, and a mixture of powder wood four, lubricant and fire retardant additives was fed down-stream using another weight-in-loss powder feeder through a side-stuffer. The compounding was conducted using a screw speed of 50 rpm and a temperature profile of 155 (feeder), 160, 165, 170, 170, 170, 160, 155, 140, 140 and 155 °C (die). The extrudate was continuously pelletized into granules with a BT 25 pelletizer (Scheer Bay Co., Bay City, MI, USA). Composite samples were extruded using the prepared pellets. The Leistritz extrusion machine and a profile die were used to produce 5 mm thick × 100 mm wide test samples. Designation and composition of composites with fire retardants are listed in Table 1. It should be pointed out that the formulation design was based a constant wood loading (50 wt%) and a constant FM loading (7.5 wt%, except for the control group). The design led to some variation in actual HDPE and MAPE loading in the formulation, especially between the control and treatment groups.
Table 1 Formulations of the composites used in the study
| Composite ID |
Composition (%wt) |
| HDPE |
WF |
MAPE |
Lub |
Clay |
SA-8010 |
SABT-93 |
| A0 |
40.00 |
50.00 |
4.00 |
6.00 |
0.00 |
0.00 |
0.00 |
| B15 |
33.75 |
50.00 |
3.75 |
5.00 |
7.50 |
0.00 |
0.00 |
| C10 |
35.25 |
50.00 |
2.25 |
5.00 |
2.50 |
5.00 |
0.00 |
| C15 |
32.50 |
50.00 |
2.50 |
5.00 |
5.00 |
5.00 |
0.00 |
| D10 |
35.25 |
50.00 |
2.25 |
5.00 |
2.50 |
0.00 |
5.00 |
| D15 |
32.50 |
50.00 |
2.50 |
5.00 |
5.00 |
0.00 |
5.00 |
Characterization
The modulus of elasticity (MOE) and modulus of rupture (MOR) for the HDPE/WF composites were measured according to the ASTM: D790 standard using an INSTRON 5582 Testing Machine (In-stron Co., Grove City, PA, USA). Prior to testing, test samples were conditioned to reach constant weights at 23 °C and 50% relative humidity. A three-point loading was used with a crosshead speed of 2.3 mm min−1 and a span length of 127 mm (sample width = 32 mm). For each formulation, five replicates were tested. Thermogravimetric analysis (TGA) was conducted using a TA Q50 thermal gravimetric analyzer (TA Instruments Inc., New Castle, DE, USA) from 40 to 600 °C at a heating rate of 10 °C min−1 in a nitrogen atmosphere. Powder WPC samples were prepared from composite profile and weight of each TGA sample was about 10 mg. The chemical structure of the residual powder of the HDPE/WF composites after the complete combustion was measured by the attenuated total reflectance Fourier transform infrared spectroscopy (ATR-FTIR). The spectra were collected using the FTIR spectrophotometer (Nicolet Nexus 670-FTIR, Thermo Electron Corporation, Gormley, Canada). The scanning range of wavenumber was from 4000 to 800 cm−1. Fire performance of the composites was measured with a Stanton Redcroft (Fire Testing Technology Limited, West Sussex, UK) cone calorimeter according to the ISO 5660-1 standard. For each test, a test sample was placed on the surface of a piece of aluminum foil inside a corundum crucible (100 mm length × 100 mm width). Subsequently, the crucible was mounted horizontally on the loader and exposed to the heat radiation of 50 kW m−2. This heat radiation corresponded to a temperature of 780 °C on the upper surface of the test sample. After the combustion test, the top sample surface morphology was taken with a digital camera, and char residues were collected for further analysis. The fractured composite surface after bending test and residual char powder after the complete combustion were studied using scanning electron microscopy (SEM, Hitachi S4800, Hitachi Ltd., Tokyo, Japan) at 20 kV. The prepared sample surfaces were coated with gold before observation. The crystallographic studies were done by WAXD analysis using a Bruker Siemens D5000 X-ray diffractometer (Bruker AXS Inc., Madison, WI, USA) operated at the Cu Kα radiation (λ = 0.154 nm) with 40 kV and 30 mA in a 2θ range from 5 to 60° at a step size of 0.02°. The dispersion of nanoclay and flame retardant particles in the wood polymer matrix for C10 sample was observed with a transmission electron microscope (JEM 1400, JEOL, Peabody, MA, USA) at an accelerating voltage of 120 kV. The residual char powder after the complete combustion was well dispersed in the methanol solvent using the sonication treatment. Drops of suspension were deposited onto glow-discharged carbon-coated TEM grids. The liquid in excess was absorbed with filter paper, and the remaining thin liquid film was allowed to dry. The TEM grids were allowed to dry at room temperature for 3 hours before imaging.
Results and discussion
Mechanical properties
The measured composite MOE and MOR values of HDPE/WF composites are summarized in Table 2. It should be pointed out that the composite composition variation among various formulations (Table 1) made it difficult to compare exact influence of the material composition on mechanical properties for different composites. Overall, the observed MOE values did not change significantly among all samples, while the MOR values show a reduction from the control sample A0. The higher MOR value for sample A0 was attributed to the superior compatibility between WF and HDPE matrix without the influence of FMs. The esterification reaction for the formation of covalent bond between the maleic anhydride group (COOH group) of MAPE and hydroxyl group of WF promoted the exposed PE molecules entangle with HDPE chains during the compounding.27 The MOE value of the composite B15 (7.5% active clay) was relatively larger than that of the control sample A0 because of the reinforcing effect of the nanoclay, which exhibited much higher Young's modulus than that of the HDPE. The MOE values of the composites C10 and C15 were reduced compared to that of the A0 due to the deterioration in the compatibility between HDPE and WF with reduced MAPE and the addition of fire retardant SA8010, which is a common phenomenon observed in wood reinforced plastics.2,3,5 The MOE values for the D10 and D15 composite groups with fire retardant SABT-93 were much similar as that of the A0 sample. The result shows that the SABT-93 compound had less negative impact on composite MOE compared with the SA8010. The MOR values of the composites B15, C10, C15, D10 and D15 decreased compared to that of the A0. The addition of FMs deteriorated the interfacial adhesion and increased stress concentration, leading to reduced composite strength.28,29 The MOR values of the composites C15 and D15 were lower compared to those of the C10 and D10, indicating that the presence of compatibilizer MAPE and decrease in the FM content in the sample groups had a positive effect on the MOR values. However, the composite B15 showed a relatively higher MOR value compared with these of the composites C10, C15, D10 and D15. This result was attributed to the fact that without the addition of the fire retardant (SA-8010 or SABT-93), the relatively good dispersion of the nanoclay in the HDPE matrix leads to a better strength property through the stress transfer from HDPE matrix to WF.
Table 2 Mechanical and thermogravimetric properties of composite samples
| Composites |
Mechanical property |
Thermogravimetric propertya |
| MOE (GPa) |
MOR (MPa) |
T1% (°C) |
Tpeak1 (°C) |
Tpeak2 (°C) |
Char at 600 °C (wt%) |
| T1% = decomposition temperature at 1% mass loss; Tpeak1 = the first peak temperature; Tpeak2 = the second peak temperature. |
| A0 |
4.24 ± 0.12 |
34.45 ± 1.19 |
129 |
366 |
471 |
11.34 |
| B15 |
4.52 ± 0.38 |
24.51 ± 2.24 |
157 |
367 |
475 |
10.87 |
| C10 |
3.74 ± 0.45 |
21.69 ± 1.70 |
111 |
352 |
477 |
11.65 |
| C15 |
3.78 ± 0.59 |
21.83 ± 2.14 |
83 |
350 |
463 |
9.04 |
| D10 |
4.57 ± 0.51 |
22.10 ± 1.77 |
145 |
346 |
472 |
11.19 |
| D15 |
4.19 ± 0.27 |
23.71 ± 2.77 |
154 |
340 |
470 |
13.75 |
Morphology
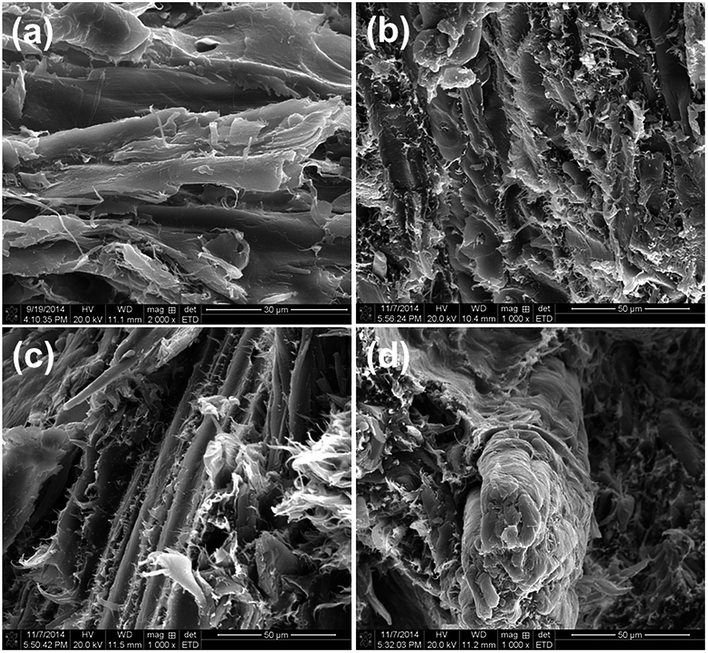
The morphology of the fractured surface for the composites after bending tests is shown in Fig. 1. For the control A0 sample (Fig. 1a), a ductile fractured surface present in some regions implied a better compatibility between HDPE matrix and WF in the presence of MAPE without FMs. For the B15 sample (Fig. 1b), with the addition of nanoclay only, the fractured composite surface became much rougher due to the formation of interacted HDPE-nanoclay structure. For the C10 sample (Fig. 1c), with decrease in the contents of fire retardants and the presence of compatibilizer MAPE, the ductile fractured surface appeared in some areas and the exposed WF disappeared, demonstrating that the addition of the compatibilizer promoted the interfacial interaction among flame retardants, WF and HDPE matrix. For the C15 sample (Fig. 1d), the increased addition of fire retardant SA-8010 largely weakened the interfacial interaction between WF and HDPE, displaying the largely exposed WF. This observation was responsible for the decreased MOE and MOR values of HDPE/WF composites with the addition of SA-8010 at high loading levels, as shown in Table 2. The composite D10 and D15 show a similar morphology structure as these of the C10 and C15 groups.
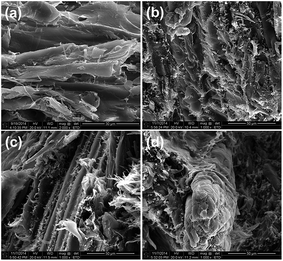 |
| | Fig. 1 SEM micrographs of the fractured sample surfaces: (a) A0, (b) B15, (c) C10 and (d) C15. | |
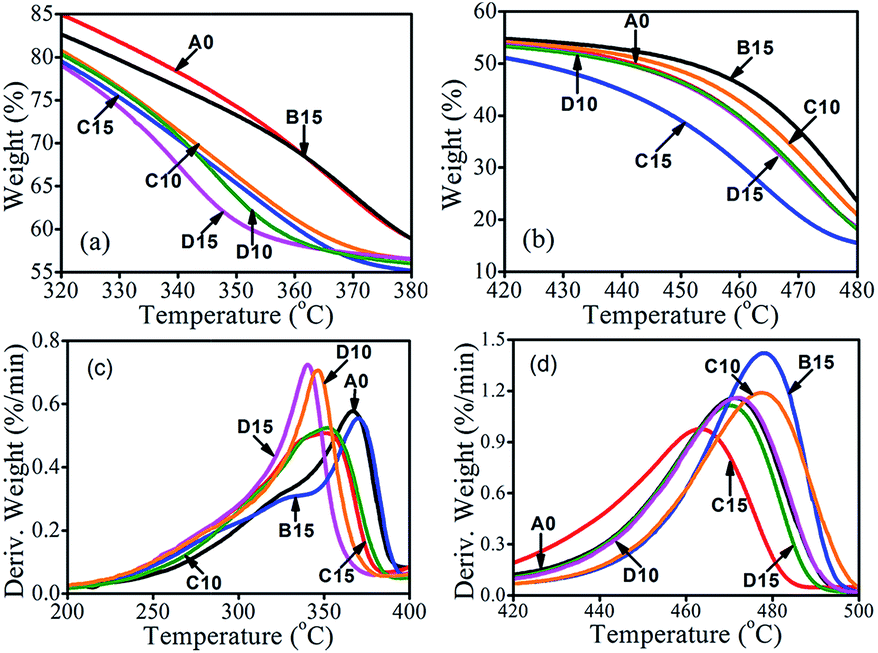
Thermal stability
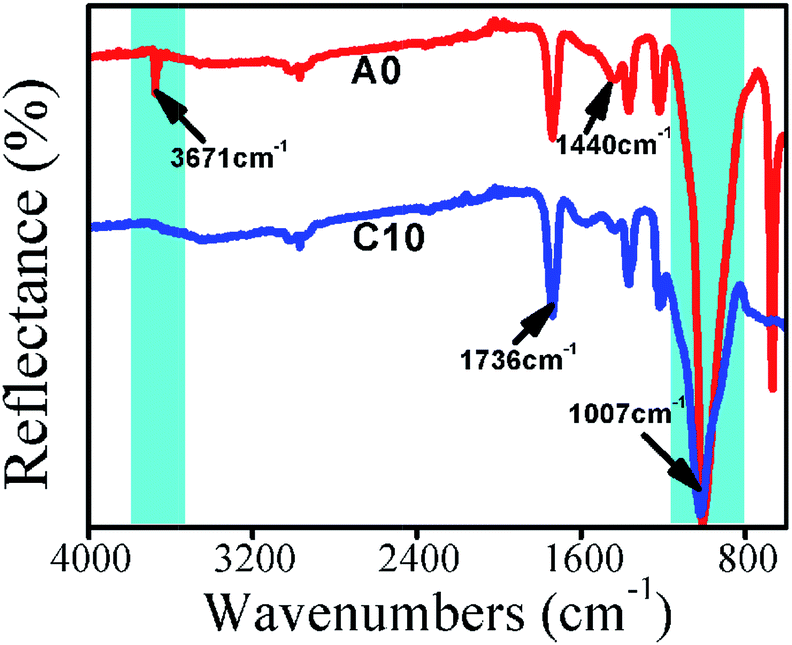
The thermal decomposition of SA-8010 and SABT-93 is shown in Fig. S2 and Table S1.† As shown in Fig. S2,† compared to that of SA-8010, the thermally decomposed curve of SABT-93 shifted to a higher temperature. From Table S1,† it can be seen that SA-8010 and SABT-93 has similar T1% values, while their peak values are totally different with 400 and 455 °C, respectively. The thermal degradation behavior of the composites is shown in Fig. 2 and S1.† The decomposition temperatures at the 1% mass loss and the maximum decomposition rate as well as residual material amount are summarized in Table 2. All samples decomposed in two steps corresponding to the decompositions of WF and HDPE, respectively. The peak temperature at the first decomposition step (Tpeak1) corresponded to the decomposition of WF. For the B15 sample (nanoclay only), the Tpeak1 value did not change much compared to that of the A0. However, it was shifted to lower temperatures for the C10, C15, D10, and D15 samples, indicating that the thermal decomposition of WF and char formation took place earlier with the addition of FMs (i.e., SA-8010, SABT-93, nanoclay) and the compatibilizer MAPE. The esterification, dehydration and crosslinking of hydroxyl group from WF with anhydride carbonyl group from MAPE were responsible for the char formation of WF, supported by FTIR analysis for the char residuals of the composites A0 and C10 groups shown in Fig. 3. For the C10 sample, the decrease of peaks at 3671 cm−1 (O–H band stretching vibration) and 1007 cm−1 (C–OH stretching and deformation) as well as the increase of peaks at 1736 and 1440 cm−1 (C![[double bond, length as m-dash]](https://www.rsc.org/images/entities/char_e001.gif) O band stretching vibration and H–C–H band deformation vibration) demonstrated the char formation of WF. The peak temperature at the second degradation step (Tpeak2) associated to the degradation of HDPE had a reversed trend. For the B15 sample with nanoclay only, the Tpeak2 value was shifted to a higher temperature compared to that of the A0, indicating that the addition of nanoclay retarded the decomposition of HDPE. For the composites C10 and D10, the synergism of nanoclay and fire retardant SA-8010 or SABT-93 and improved interfacial adhesion by MAPE shifted the Tpeak2 values to higher temperatures, especially the C10 sample with the largest Tpeak2 value among all the samples. For the composites C15 and D15, the Tpeak2 values were lower than that of the A0, possibly due to the aggregation of nanoclay and SA-8010 or SABT-93 at high content levels in the composites and relatively poor insulation layer formation for HDPE during combustion. Therefore, WF decomposition and its crosslinking reaction with MAPE for char formation, synergism of nanoclay and fire retardant (SA-8010 or SABT-93) at proper loading level and good interfacial adhesion helped delay thermal degradation of HDPE.
O band stretching vibration and H–C–H band deformation vibration) demonstrated the char formation of WF. The peak temperature at the second degradation step (Tpeak2) associated to the degradation of HDPE had a reversed trend. For the B15 sample with nanoclay only, the Tpeak2 value was shifted to a higher temperature compared to that of the A0, indicating that the addition of nanoclay retarded the decomposition of HDPE. For the composites C10 and D10, the synergism of nanoclay and fire retardant SA-8010 or SABT-93 and improved interfacial adhesion by MAPE shifted the Tpeak2 values to higher temperatures, especially the C10 sample with the largest Tpeak2 value among all the samples. For the composites C15 and D15, the Tpeak2 values were lower than that of the A0, possibly due to the aggregation of nanoclay and SA-8010 or SABT-93 at high content levels in the composites and relatively poor insulation layer formation for HDPE during combustion. Therefore, WF decomposition and its crosslinking reaction with MAPE for char formation, synergism of nanoclay and fire retardant (SA-8010 or SABT-93) at proper loading level and good interfacial adhesion helped delay thermal degradation of HDPE.
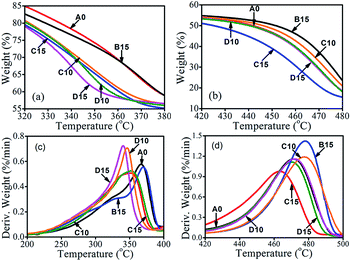 |
| | Fig. 2 TGA curves of composites A0, B15, C10, C15, D10 and D15: (a) weight loss from 320 to 380 °C, (b) weight loss from 420 to 480 °C, (c) DTG from 200 to 400 °C, and (d) DTG from 420 to 500 °C. | |
 |
| | Fig. 3 ATR-FTIR spectra of composites A0 and C10. | |
Flammability
The combustion parameters of the HDPE/WF composites from the cone calorimetry test are shown in Fig. 4 and Table 3. For the heat release rate (HRR) curves (Fig. 4a), all samples had two HRR peaks. The first peak was between 55 and 75 s. The D15 sample exhibited the highest HRR peak (pHRR) of 356.62 kW m−2 at 60 s, and the C15 displayed the lowest pHRR of 277.43 kW m−2 at 55 s. The second peak appeared in the range from 225 to 305 s. For the second peak, the highest pHRR of 371.48 kW m−2 at 235 s was from the A0 sample, and the lowest pHRR of 280.51 kW m−2 at 290 s was associated with the sample D10. The A0 sample had the highest HRR value with pHRR value of 371.48 kW m−2 among all the samples. In case of the B15 sample, the reduction of HRR and total heat release (THR) values was observed (Fig. 4a and b). The improvement of fire performance could be related to good dispersion state and insulation effect of nanoclay. It is well known that nanoclay has a multilayer structure with thin nano-platelets. The layer structure of nanoclay acted as an effective oxygen and heat barrier during combustion. For the composites C10 and C15, HRR, THR and pHRR values decreased significantly compared to these of the B15, revealing the synergistic effect of nanoclay and SA-8010. The effective barrier from the multilayer platelets of nanoclay blocked the heat and mass transfer. The bromine radicals released from SA-8010 removed the high energy heat in the gas phase, which largely insulated the HDPE matrix and retarded the mass loss and energy release rate of the decomposed products. However, as the total content of nanoclay and SA-8010 increased from 10 to 15 wt% and the absence of compatibilizer MAPE, a further decrease in HRR and THR values was not observed. For example, the THR value increased from 131.11 to 149.00 MJ m−2. This might be attributed to the formation of FM aggregations in the composites with a higher loading as well as the decreased interfacial interaction among FMs, WF and HDPE. The presence of SABT-93 also improved the fire retardancy of HDPE/WF composites. For example, compared to that of the B15, the pHRR values for the D10 and D15 decreased by 22.1% and 12.4%, respectively. The best fire performance was achieved for the C10 sample, as shown in Table 3. It is therefore concluded that SA-8010 had a better fire retardancy than SABT-93 for WPC, and the combination of nanoclay and SA-8010 showed the synergistic flame retardancy for HDPE/WF composites. Among all the samples, the lowest total smoke production (TSP) was observed for the control A0 sample (Fig. 4c). The B15 composite with clay only had a similar TSP curve as the A0 composite. However, a significant increase in the TSP was observed for the composites C10, C15, D10 and D15. When SA-8010 and SABT-93 were burnt, they pyrolyzed to form bromine radicals and volatile organic (aromatic) compounds, which led to a large amount of smoke. In case of mass loss (ML) (Fig. 4d), the A0 sample exhibited a very high mass loss among all samples. For the composites C10 and C15, the addition of SA-8010 significantly decreased the ML values, showing the good fire retardancy of SA-8010 in HDPE/WF composites. Interestingly, for the composites D10 and D15, the incorporation of SABT-93 had little effect on ML values. For WPCs, the carbon radicals produced from the decomposition of WF attacked hydrogens on HDPE chains and accelerated the degradation of HDPE matrix. However, bromide radicals as radical scavengers decomposed from SA-8010 and SABT-93 trapped the free radicals produced from WF, which resulted in the reduced probability of decomposition of HDPE matrix. The flame retardant SA-8010 reduced the decomposition of WPCs in a high efficiency compared to that of SABT-93 as the peak value (400 °C) in thermal stability temperature of SA-8010 is lower than that of SABT-93 (455 °C) as shown in Table S1,† which could trap more free radicals from WF, and decrease their influence on the decomposition of HDPE matrix. In addition, the peak value in the decomposed temperature of SABT-93 was similar to that of HDPE matrix in WPCs, which had limited effect on retarding degradation of HDPE matrix. Therefore, the addition of SA-8010 significantly decreased the ML values of WPCs, while the incorporated SABT-93 had little or limited effect on ML values. The overall combustion parameter results demonstrated that SA-8010 exhibited superior fire retardancy compared with SABT-93. The combined use of nanoclay and SA-8010 showed an even better fire retardancy. The compatibilizer MAPE played a critical role in improving the fire performance. Since SA-8010 had a better fire retardancy compared with SABT-93, the combined effect of nanoclay, SA-8010, and compatibilizer MAPE on the fire performance of HDPE/WF composites was further analysed based on the morphology of char residue.
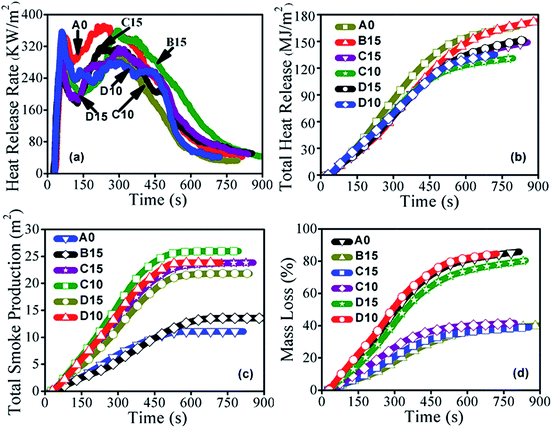 |
| | Fig. 4 Fire performances of composite A0, B15, C10, C15, D10 and D15: (a) heat release rate, (b) total heat release, (c) total smoke production, and (d) mass loss curves. | |
Table 3 Cone calorimetry data of the manufactured compositesa
| Composite ID |
Flame retardants |
pHRR (kW m−2) |
THR (MJ m−2) |
AMLR (g s−1) |
TSP (m2) |
| pHRR – peak of heat release rate; THR – total heat release; AMLR – average heat release rate; TSP – total smoke production. |
| A0 |
None |
371.48 |
166.85 |
0.071 |
11.03 |
| B15 |
Nanoclay |
360.09 |
174.29 |
0.059 |
13.50 |
| C10 |
Nanoclay/SA-8010 |
351.04 |
131.11 |
0.060 |
25.95 |
| C15 |
Nanoclay/SA-8010 |
316.79 |
149.00 |
0.065 |
23.83 |
| D10 |
Nanoclay/SABT-93 |
356.62 |
135.07 |
0.068 |
23.80 |
| D15 |
Nanoclay/SABT-93 |
315.27 |
151.47 |
0.066 |
21.81 |
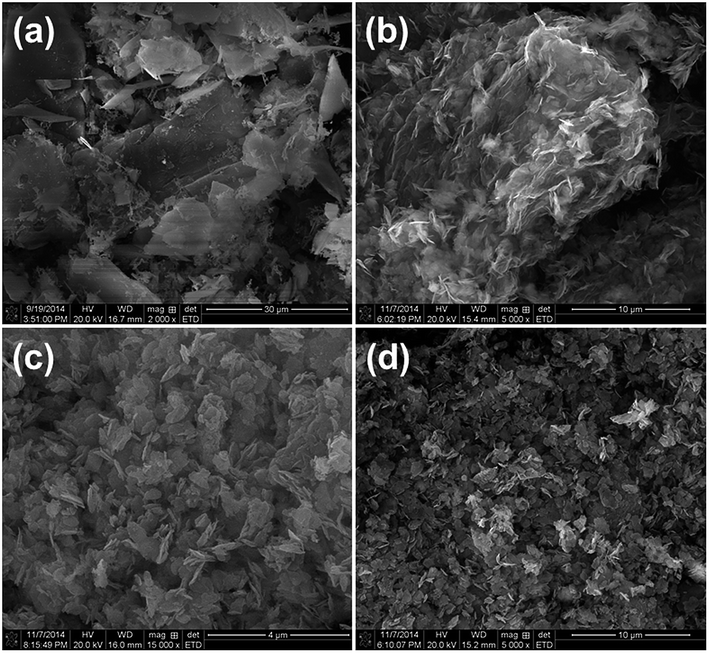
Char residual morphology
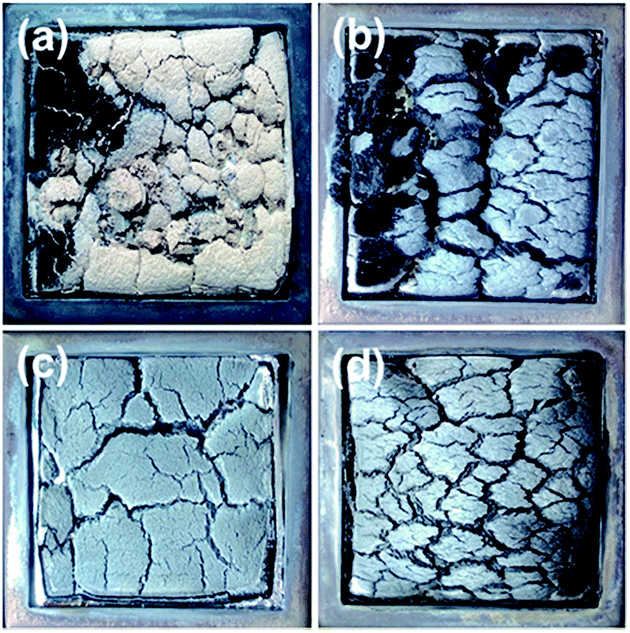
Digital photographs of char residues of the composites A0, B15, C10 and C15 after the cone calorimeter test are shown in Fig. 5. For the char residues of the A0 sample (Fig. 5a), it was seen that the char residues were completely collapsed into small pieces, and burnt out in some areas, which implied the poor fire retardancy. For the char residues of the clay-only B15 sample (Fig. 5b), the surface layer was quite loose and even burnt out in the center. The char residues had cracks and holes although a continuous char layer was seen. For the char residues of the C10 sample, with the addition of compatibilizer MAPE as well as the decrease in the contents of the fire retardant, more compact and continuous surface layer was generated, as shown in Fig. 5c. For the char residues of the C15 sample (Fig. 5d), the char layer was continuous and compact with small cracks on the surface, indicating the improved fire performance. These observations confirmed the synergism of SA-8010 and nanoclay in promoting the formation of char layer to protect the HDPE substrate from combustion, as well as the contribution of improved interfacial interaction with the addition of MAPE toward the fire performance.
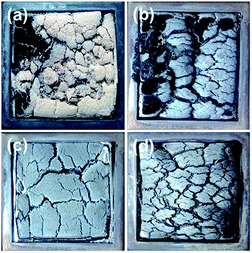 |
| | Fig. 5 Photographs of the char residues after cone calorimetry: (a) A0, (b) B15, (c) C10, (d) C15. | |
The SEM micrographs of char residues after combustion for the composites A0, B15, C10 and C15 are shown in Fig. 6. Many large holes and cracks were found in the char residues of the A0, as shown in Fig. 6a. This structure contributed to fast heat transfer and gas diffusion, and therefore the sample was burnt quickly. The char residues of the B15 (Fig. 6b) appeared to be aggregated together with holes. This kind of noncontinuous and compact char layer was not effective to prevent the HDPE substrate from degradation under combustion. For the char residues of the C15 sample (Fig. 6d), residual char covered on the surface, which was continuous with some small holes. This was attributed to the formation of fire retardant aggregations as well as the poor distribution of fire retardants in the composites with a higher loading, as discussed previously. However, in comparison with the A0 and B15, much more compact and continuous morphology was seen observed for the char residue of the C10 (Fig. 6c). The char residue of the C15 exhibited more compact surface layer, which was responsible for the improved fire retardancy, indicating the synergistic effect of nanoclay and SA-8010, again. The improved compatibility among fire retardants, WF and HDPE with the presence of MAPE further produced more compact and continuous char residue, which significantly reduced the heat and mass transfer rate, leading to enhanced fire performance. These observations were in accordance with the THR and HRR data.
 |
| | Fig. 6 SEM micrographs of the char residues after cone calorimetry test: (a) A0, (b) B15, (c) C10 and (d) C15. | |
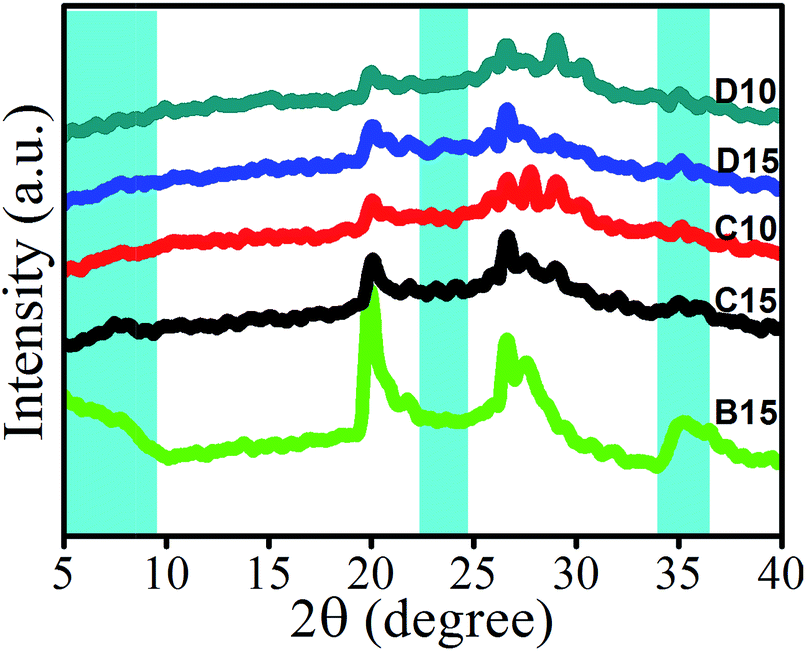
Char residual structure
The X-ray diffractograms of A0, B15, C10, C15, D10 and D15 samples are shown in Fig. S3† and 7, respectively. In the diffractogram of A0, the peak for the crystalline portion of HDPE in the blend appeared at 36.13° corresponded to the crystalline region of the cellulose of pristine wood.30 For organically modified nanoclay, the sharp diffraction peak was typically at around 5°.31 However, the disappearance of typical crystal diffraction peak of nanoclay was observed for C10, C15, D10 and D15 samples as the exfoliation of nanoclay layers in the HDPE matrix.32 The strong hydrogen bonding between the oxygen groups of silicates and the maleic anhydride group (or COOH group) as the driving force could promote MAPE molecules enter and penetrate into the gallery between nanoclay layers. Subsequently, the HDPE molecular chains could more easily enter the gallery and finally exfoliate layers. It was further supported from the TEM result (Fig. S4†). For the C10 sample, the dark lines were the silicate layers of nanoclay, and the black spots present in the image were the SA-8010 particles. In addition, the intensity of crystalline peaks for the wood and HDPE matrix appeared in the range of 14 to 25° as well as 36.13° was found to either decrease or disappear with the incorporation of nanoclay and/or SA-8010/SABT-93. The decrease in the crystallinity of cellulose of wood was supposed to the cause of insertion of nanoclay and SABT-93/SA-8010 into the amorphous region of cellulose.33 Similar decrease in peak intensities of the wood and polymer due to the incorporation of silica was observed and reported by Deka and co-worker while studying the WAXD profile of silica, nanoclay and WPCs system.34 All these data suggested that the nanoclay layers were exfoliated, and flame retardants (SABT-93/SA-8010) were dispersed in the wood and polymer matrix.
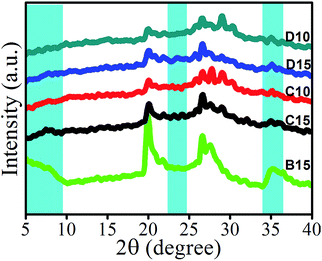 |
| | Fig. 7 WAXD patterns of composites B15, C10, C15, D10 and D15. | |
On the contrary, for the diffractogram of the B15 sample, the broader diffraction peak of nanoclay at around 5° was presented, which implied that the nanoclay was not exfoliated.35 The reason is that the size of dispersed nanoclays became larger or even aggregated as the level of nanoclay increased too much. Therefore, the higher clay contents, the higher the MAPE needed to exfoliate the additional clay.
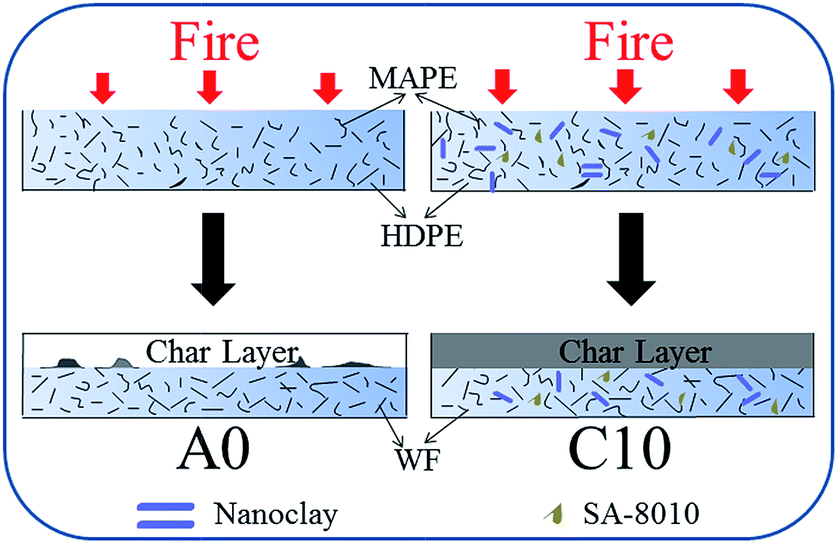
Mechanism discussion
FMs in polymer have an action in a condensed phase, a gas phase, or the combined condensed-gas phase. According to the previous reports, halogenated flame retardants work in the gas phase, and organo-modified clays acted as a char layer in the condensed phase.13,36 Based on the above analysis, the combustion process during burning for the combined system of nanoclay and SA-8010 was schematically proposed (Fig. 8). Free radicals were first produced in the thermal degradation of HDPE/WF composites at high temperatures, and accelerated their thermal degradation.8 For the A0 sample, carbon radicals were produced from the decomposition of the carbon backbone of WF, which attacked hydrogen on HDPE chain to form new long chain radicals at high temperatures (over 400 °C) as indicated in Table 2. This new free radicals could be broken into volatiles, while much free radical formation took place in HDPE, which accelerated the decomposition of HDPE. For the C10 sample, SA-8010 decomposed to produce bromine radicals, which was considered as radical scavengers.13 Therefore, bromine radicals trapped the free radicals produced from WF. As a result, SA-8010 reduced the influence of WF on stability of HDPE. Additionally, the char layer produced from the WF and nanoclay built up on the surface during burning. The stable char layer of nanoclay as an insulation layer prevented further decomposition of HDPE and slowed down the mass loss and energy release rates of the decomposed products.24 Finally, the presence of MAPE largely improved the interfacial interaction among fire retardants, WF and HDPE, which also contributed to the superior fire performance.
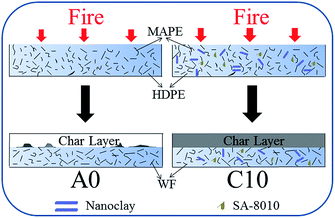 |
| | Fig. 8 Schematic representation of mechanism for synergistic fire retardancy of nanoclay and SA-8010 in WF/HDPE/MAPE composites. | |
Conclusions
The HDPE/WF composites with compatibilizer MAPE, and FMs (i.e., fire retardants of SA-8010 and SABT-93 and nanoclay) were prepared. The MOR values of the composite were reduced after the addition of FMs, and MOE values did not change systematically. The presence of coupling agent MAPE improved the compatibility among FMs, WF and HDPE. The synergism of nanoclay and SA-8010/SABT-93 and improved interfacial adhesion by MAPE shifted the thermal decomposition of the composites to higher temperatures. The combined addition of fire retardants (SA-8010 or SABT-93) and nanoclay reduced the HRR and THR from composites, exhibiting the synergism for enhanced char layer formation. The incorporation of compatibilizer MAPE further reduced the HRR and THR values, revealing the effectiveness of MAPE in improving interfacial bonding and fire performance of HDPE/WF composites. Morphology analysis for char residues revealed that the combined use of SA-8010, nanoclay, and MAPE resulted in much more continuous and compacted char layer, leading to the best flame performance among the formulations tested. Char residual structure analysis indicated that MAPE promoted the exfoliation of nanoclay, and the dispersion of flame retardants SA-8010 and SABT-93 in the wood and HDPE matrix.
Acknowledgements
The authors would like to acknowledge the support from the USDA National Institute of Food and Agriculture McIntire Stennis project [1000017] and Zhejiang Agriculture and Forestry University.
References
- M. Nikolaeva and T. Kärki, Fire Mater., 2013, 37, 612–620 CrossRef CAS.
- Y. Q. Fang, Q. W. Wang, C. G. Guo, Y. M. Song and P. A. Cooper, J. Anal. Appl. Pyrolysis, 2013, 100, 230–236 CrossRef CAS.
- Y. Arao, S. Nakamura, Y. Tomita, K. Takakuwa, T. Umemura and T. Tanaka, Polym. Degrad. Stab., 2014, 100, 79–85 CrossRef CAS.
- M. B. Abu Bakar, Z. A. MohdIshak, R. Mat Taib, H. D. Rozman and S. Mohamad Jani, J. Appl. Polym. Sci., 2010, 116, 2714–2722 CAS.
- N. Aryilmis, J. T. Benthien, H. Thoemen and R. H. White, J. Appl. Polym. Sci., 2011, 122, 3201–3210 CrossRef.
- Z. X. Zhang, J. Zhang, B. X. Lu, Z. X. Xin, C. K. Kang and J. K. Kim, Composites, Part B, 2012, 43, 150–158 CrossRef CAS.
- L. Zhou, C. G. Guo and L. P. Li, J. Appl. Polym. Sci., 2011, 122, 849–855 CrossRef CAS.
- B. Li and J. M. He, Polym. Degrad. Stab., 2004, 83, 241–246 CrossRef CAS.
- J. Q. Zheng, B. Li, C. G. Guo, Q. Wu and Y. F. Wang, J. Appl. Polym. Sci., 2014, 131, 40281–40286 Search PubMed.
- G. Bai, C. G. Guo and L. P. Li, Construct. Build. Mater., 2014, 50, 148–153 CrossRef.
- H. Seefeldt, U. Braun and M. H. Wagner, Macromol. Chem. Phys., 2012, 213, 2370–2377 CrossRef CAS.
- K. Lu, X. J. Cao, Q. S. Liang, H. T. Wang, X. W. Cui and Y. J. Li, Ind. Eng. Chem. Res., 2014, 53, 8784–8792 CrossRef CAS.
- A. B. Morgan and J. W. Gilman, Fire Mater., 2013, 37, 259–279 CrossRef CAS.
- N. Ayrilmis, T. Akbulut, T. Dundar, R. H. White, F. Mengeloglu, U. Buyuksari, Z. Candan and E. Avci, Construct. Build. Mater., 2012, 33, 63–69 CrossRef.
- N. Ayrilmis, BioResources, 2011, 6, 3178–3187 CAS.
- N. Ayrilmis, Composites, Part B, 2013, 44, 745–749 CrossRef CAS.
- R. Kurt, F. Mengeloglu and H. Meric, Eur. J. Wood Wood Prod., 2012, 70, 177–182 CrossRef CAS.
- J. G. Gwon, S. Y. Lee and J. H. Kim, J. Appl. Polym. Sci., 2014, 131, 40120–40126 CrossRef.
- M. Sain, S. H. Park, F. Suhara and S. Law, Polym. Degrad. Stab., 2004, 83, 363–367 CrossRef CAS.
- N. M. Stark, R. H. White, S. A. Mueller and T. A. Osswald, Polym. Degrad. Stab., 2010, 95, 1903–1910 CrossRef CAS.
- N. Ayrilmis, J. T. Benthien, H. Thoemen and R. H. White, Eur. J. Wood Wood Prod., 2012, 70, 215–224 CrossRef CAS.
- X. S. Wang, H. C. Pang, W. D. Chen, Y. Lin, L. S. Zong and G. L. Ning, ACS Appl. Mater. Interfaces, 2014, 6, 7223–7235 CAS.
- N. M. Stark, S. A. Mueller, R. H. White and T. A. Osswald, 10th International Conference on Wood & Biofiber Plastic Composites, Madison, Wisconsin, USA, May 2009 Search PubMed.
- Y. H. Lee, T. Kuboki, C. B. Park, M. Sain and M. Kontopoulou, J. Appl. Polym. Sci., 2010, 118, 452–461 CrossRef CAS.
- G. Guo, C. B. Park, Y. H. Lee, Y. S. Kim and M. Sain, Polym. Eng. Sci., 2007, 47, 330–336 CAS.
- Y. S. Zhao, K. J. Wang, F. H. Zhu, P. Xue and M. Y. Jia, Polym. Degrad. Stab., 2006, 91, 2874–2883 CrossRef CAS.
- G. F. Wu and M. Xu, BioResources, 2014, 9, 4173–4193 Search PubMed.
- G. Gong, B. Nyström and R. Joffe, Plast., Rubber Compos., 2013, 42, 244–255 CrossRef CAS.
- H. K. Lee and D. S. Kim, J. Appl. Polym. Sci., 2009, 111, 2769–2776 CrossRef CAS.
- Q. F. Yao, C. Wang, B. T. Fan, H. W. Wang, Q. F. Sun, C. Jin and H. Zhang, Sci. Rep., 2016, 6, 3505–3516 Search PubMed.
- B. K. Deka and T. K. Makji, Composites, Part A, 2011, 42, 2117–2125 CrossRef.
- R. R. Devi and T. K. Maji, Wood Sci. Technol., 2012, 46, 299–315 CrossRef CAS.
- A. Hazarika and T. K. Maji, Ind. Eng. Chem. Res., 2013, 52, 13536–13546 CrossRef CAS.
- B. K. Deka and T. K. Maji, Polym. Bull., 2013, 70, 403–417 CrossRef CAS.
- B. Kord, P. Ravanfar and N. Ayrilmis, J. Polym. Environ., 2016 DOI:10.1007/s10924-016-0897-x.
- A. Dasari, Z. Z. Yu, G. P. Cai and Y. W. Mai, Prog. Polym. Sci., 2013, 38, 1357–1387 CrossRef CAS.
Footnote |
| † Electronic supplementary information (ESI) available. See DOI: 10.1039/c7ra03327c |
|
| This journal is © The Royal Society of Chemistry 2017 |
Click here to see how this site uses Cookies. View our privacy policy here. 
 Open Access Article
 This Open Access Article is licensed under a
  *a,
Guangyao Li*b,
Mei-Chun Lia,
Xiuxuan Suna and
Dennis Ringc
*a,
Guangyao Li*b,
Mei-Chun Lia,
Xiuxuan Suna and
Dennis Ringc