DOI:
10.1039/C7RA03111D
(Paper)
RSC Adv., 2017,
7, 31352-31364
Facile synthesis of potassium copper ferrocyanide composite particles for selective cesium removal from wastewater in the batch and continuous processes
Received
16th March 2017
, Accepted 9th June 2017
First published on 19th June 2017
Abstract
A composite potassium copper ferrocyanide particle adsorbent (CMC–KCuFC) was fabricated in this study, based on the use of a carboxymethyl cellulose sodium (CMC) biopolymer cross-linked with Cu2+ via a syringe pump device, serving as an efficient biosorbent for cesium (Cs) ion removal and adsorption from wastewater, and was verified by SEM, EDX, FT-IR, TGA and XRD. Influencing factors in the adsorption of cesium were systematically investigated, including the pH of the solution, contact time, initial concentration, temperature and competing ions. The results demonstrated that use of the CMC–KCuFC adsorbent was feasible under a wide range of pH values (5–10). The cesium adsorption process was described by the Freundlich isotherm model. Meanwhile, the adsorption equilibrium time was reached within 600 min and the kinetic study showed it to be well fitted by the pseudo-second-order kinetic model. Moreover, all materials involved in the CMC–KCuFC adsorbent were biosafe and biodegradable. CMC–KCuFC is expected to be a potential adsorbent for continuous removal of cesium from wastewater.
1. Introduction
In the recent years, there have been growing concerns regarding the contamination caused by radioactive waste. The treatment of radionuclide wastewater is in urgent need, especially after the Fukushima Daiichi nuclear disaster in 2011. Of all the radionuclides, 137-cesium (137Cs) has attracted great attention due to its long half-life (T1/2 = 30.17 years), high energy gamma ray emission and high solubility in water,1–3 which can cause adverse effects on the environment and human health. A weak Lewis acid, the Cs+ ion, exhibits a low tendency to form complexes with ligands. Meanwhile, because of its chemical similarity to potassium, 137Cs can be easily incorporated into terrestrial and living organisms where it is deposited in the soft tissues, leading to cancer.4,5 Hence, development of an efficient and economical removal method is principal for the removal of cesium from wastewater in view of the environmental risks.
To date, various methods have been proposed for removal of radiocesium from wastewater, the most main used are solvent extraction,6,7 chemical precipitation8 and adsorption method.9 Among these methods, adsorption has been proved to be an excellent way to treat wastewater, offering significant advantages, like the low-cost, availability, profitability, easy operation, and efficiency.10 A variety of 137Cs adsorbent materials, including clay minerals, metal oxides, zirconium phosphate and silicotitanates are all previously reported for removal of cesium,11–15 whereas the limitation of the low Cs+ selectivity or too expensive for large-scale application in environmental cleanup. Accordingly, new adsorption materials are necessary to be researched.
Transition metal (Cu, Fe, Ni, Zn and Co) hexacyanoferrates (MCFs) are considered to be one of the inorganic adsorbents for selective recovery of cesium from wastewater. Among them, potassium copper hexacyanoferrate (KCuFC) is often chosen as the agent in practical application. Due to it is available in powdery and granular form compared to other metal hexacyanoferrates.16 Moreover, its radiation stability, high selectivity, low cost and excellent ion exchange performance in a broad range of pH make its feasible for large-scale application.17,18 Nevertheless, direct use of KCuFC as adsorbent has been hampered by its fine powder morphology, and it is unsuitable for continuous column stuffing and difficult to remove from solutions.19,20 To solve this problem, the immobilization of KCuFC particles into polymers is a key technology to apply these particles for the large-scale applications. An organic polymer, biopolymer carboxymethyl cellulose (CMC) is a desirable candidate for immobilizing agent, due to its unique characteristics such as solubility, non-toxicity and biocompatibility. Furthermore, in the presence of Cu2+, Fe3+, La3+ and Al3+ etc.21 CMC can form stable ionotropic gels. Among them, Cu2+ can be used as an ecofriendly and nontoxic crosslinking agent for CMC. Additionally, it is one of the raw materials for the synthesis of the KCuFC and does not produce secondary pollution after adsorption. The chemical structure of CMC is shown in Fig. 1.
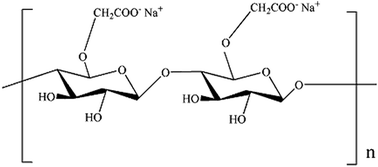 |
| | Fig. 1 Chemical structure of CMC. | |
This work synthesized a novel adsorbent of CMC–KCuFC particles by using copper chloride cross-linked carboxymethyl cellulose sodium (CMC) biopolymer as the immobilized matrix, and built particles within the polymer through a syringe pump for recovering cesium from wastewater. The composite particle was prepared using only eco-friendly materials at room temperature. FT-IR, XRD and SEM were utilized to characterize the extraction mechanism of adsorbent. In addition, to evaluate the adsorption capacity of cesium from aqueous solution in detail under various experimental conditions, isotherm and kinetic models were investigated to understand the adsorption process.
2. Materials and methods
2.1. Reagents
Sodium carboxymethyl cellulose (CMC, 1000–1400 mPa s, USP grade) was purchased from Aladdin Chemistry Co. Ltd. (Shanghai, China). Copper(II) chloride dihydrate (CuCl2·2H2O), potassium hexacyanoferrate(II) trihydrate (K4[Fe(CN)6]·3H2O), cesium chloride (CsCl), NaOH and HCl were purchased from Chengdu Kelong Chemicals Company. Stock solution of 20 mg L−1 cesium ion aqueous solution was prepared by dissolving 0.0253 g CsCl in 1000 mL deionized water. Besides, all reagents in experiment were of analytical reagent grade and used without further purification.
2.2. Preparation of CMC–KCuFC particles and CMC–Cu particles
2 g of CMC was dissolved in 100 mL of 2.5% (w/v) K4[Fe(CN)6] solution under constant agitating for 4 h at room temperature, then ultrasonicated for several minutes to obtain a homogeneous solution. The mix solution was added drop-wise with continuous stirring to 100 mL of 2% (w/v) CuCl2 solution, using a syringe pump (Model: LSP02-1B) at the speed of 1 mL min−1, and then the coagulated particles (CMC–KCuFC) were stirred continuously for 12 h. After that, the CMC–KCuFC particles were collected by rinsing several times with deionized water until removing the residual Cu(II) ions. Finally, the CMC–KCuFC particles were dried in oven at 50 °C for use in further studies. The preparation process schematic diagram was displayed in Fig. 2.
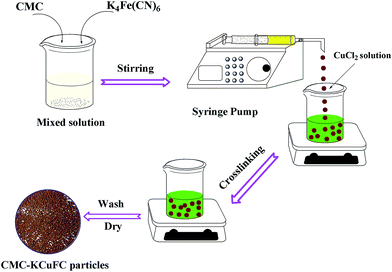 |
| | Fig. 2 Schematic presentation of the preparation process of CMC–KCuFC. | |
The following CMC–Cu particles were prepared by a similar method to that of preparation of CMC–KCuFC particles. Specifically, 2 g of CMC was dissolved in 100 mL of distilled water with vigorous magnetic stirring for 4 h at room temperature, and then ultrasonicated for several minutes to obtain a homogeneous solution. The CMC solution was dropped into 100 mL 2% (w/v) CuCl2 solution, using a syringe pump (Model: LSP02-1B) at the speed of 1 mL min−1, and then the coagulated particles (CMC–Cu) were stirred continuously for 12 h. After that, the CMC–Cu particles were washed with deionized water to residual Cu(II) ions. Finally, the CMC–Cu particles were dried 50 °C in an oven.
2.3. Batch adsorption experiment for cesium
Inactive cesium was used to research the adsorption behaviors. In brief, all adsorption experiments were carried out on thermostatic shaker (HZQ-2) with a constant speed of 150 rpm by using batch technique. Initial pH, contact time, initial concentration and temperatures and competing ions on adsorption of cesium were evaluated in 50 mL of test solutions with 0.01 g (dry weight) CMC–KCuFC particles. Besides, 0.05 mol L−1 HCl and 0.05 mol L−1 NaOH were used to adjust the pH value of the solution. The concentrations of Cs+ remaining in the solution were quantified with a Hitachi Z-2000 Zeeman atomic absorption spectrophotometer with air–acetylene flame (AAS) before and after adsorption. Each sample was designed in triplicate, and the average values were used to evaluate the adsorbent capabilities. The adsorption capacity at equilibrium (qe) and elimination efficiency (E%) of the cesium ions can be evaluated using eqn (1) and (2), respectively.19,22| | |
E(%) = (C0 − Ce)/C0 × 100
| (2) |
where C0 (mg L−1) and Ce (mg L−1) are the initial cesium concentration and cesium concentration at equilibrium in the aqueous solution, respectively. V (mL) is the volume of cesium solution and m (g) is the dry weight of the adsorbent.
2.4. Fixed bed column study
In order to study the dynamic behavior of the continuous adsorption of Cs+ ions from aqueous solution by CMC–KCuFC particles, fixed bed column adsorption experiments were investigated. The column experiments were carried out in a glass column with an inner diameter (ID = 1.5 cm) and length (L = 35 cm). Column was filled with adsorbent between two supporting layers of glass wool. CMC–KCuFC particles were added from the top of the column. The cesium ions solution is pumped upwards the adsorber from a liquid holding tank, and the inlet flow rate was controlled by using a peristaltic pump. Effluent samples are collected in regular time intervals and stored for analysis, and the influent and effluent cesium concentrations were measured by the AAS. The schematic diagram of the fixed-bed adsorption system was shown in Fig. 3.
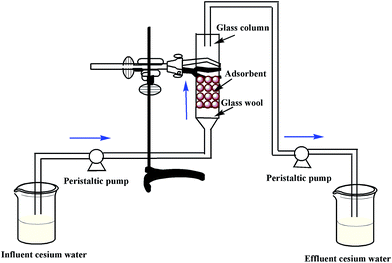 |
| | Fig. 3 Schematic diagram of the fixed-bed adsorption experiment. | |
2.5. Characterization of the CMC–KCuFC particles
The surface morphology of the adsorbent was characterized by TM3000 scanning electron microscope (SEM). The specific surface area and pore volume of the adsorbent was determined by surface area analyzer (BET, JW-BK112). X-ray spectroscopy (EDX, Ultra 55, Carl Zeiss, Germany) was employed to detect the element composition of the adsorbent surface coated with gold. The surface functional groups of the adsorbent was demonstrated by the Fourier transform infrared spectra (FT-IR, Nicolet-5700, PerkinElmer Instruments Corporation) and adopting the KBr pellet technique, over the spectral range of 4000–400 cm−1. XRD patterns of adsorbent crystalline structure were analyzed by X'Pert PRO (PANalytical B.V., 40 kV, 40 mA) equipped with a Cu Kα source at 2θ range from 10° to 80°. The thermal stabilities of adsorbent were measured using thermogravimetric analysis (TGA, Q600, USA), the samples were gradually heated at a rate of 20 °C min−1 from 20 to 800 °C under the protection of N2 with a flow rate of 20 mL min−1.
3. Results and discussion
3.1. Batch experiments
3.1.1. Effect of CMC–KCuFC particles size. In order to investigate the effect of CMC–KCuFC particles size on adsorption of cesium, CMC–KCuFC particles were controlled by different size of syringe needle, the results are shown in Fig. 4, it can be seen that the adsorption capacity decreased slightly with the increase in particles size from 1.5 to 2.0 mm, an effect that might be attributed to the amount of active sites on the adsorbent surface during the adsorption operation process.
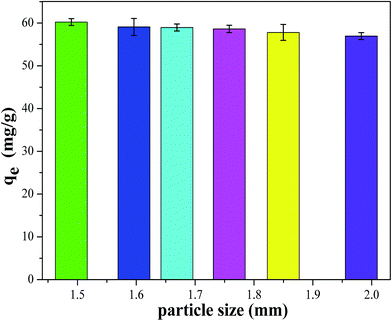 |
| | Fig. 4 Effect of particle size of CMC–KCuFC particles on cesium adsorption. | |
3.1.2. Effect of pH. The pH of solution played a vital role to affect the chemical reactions and adsorption behavior, especially for ion-exchange process.23,24 To choose optimal pH for the removal of cesium, the effect of pH on CMC–KCuFC particle was studied in the range of 2–10. The results were shown in Fig. 5. It can be seen that the adsorption capacity increased apparently with increasing pH from 2 to 5, while the adsorption capacity remained steady up when the pH was in the range of 5 to 10. This occurred because that at low pH, ion exchange sites were mainly protonated, making them less available for cation.25 However, when the pH increased, the sites became available for cation in ion-exchange processes, leading to higher adsorption. Even though, the adsorption capacity of cesium ions was feasible across a wide range of pH values, if the pH was at least 5 or above.26
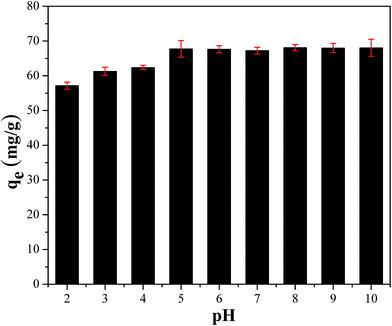 |
| | Fig. 5 Effect of pH on adsorption capacity on the remove of 50 mL 20 mg L−1 Cs+ for 24 h at 298.15 K. | |
3.1.3. Effect of contact time and kinetics of cesium adsorption study. Effect of contact time on the adsorption capacity and elimination efficiency of CMC–Cu and CMC–KCuFC particles were given in Fig. 6, respectively. It was shown that over 61.67% of Cs was removed after 600 min with CMC–KCuFC, while only 5.56% was removed with CMC–Cu and qe value was 7.85 mg g−1 at relatively low cesium concentration, which was specially revealed that the adsorbance of CMC–Cu for cesium in wastewater was insignificant. Therefore, the adsorption of CMC–KCuFC for cesium should be attributed to the existence of KCuFC crystals.
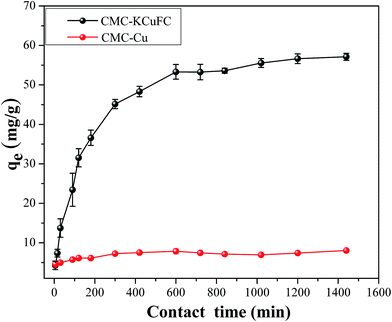 |
| | Fig. 6 Effect of contact time on the remove of 50 mL 20 mg L−1 Cs+ for 24 h at 298.15 K. | |
The kinetic studies were used to evaluate the mechanism of interaction between the adsorbent and the adsorbate. For this purpose, the kinetics was analyzed using pseudo-first-order and pseudo-second-order kinetic model. The equations of both linear models can be expressed as follows:27,28
| |
log(qe − qt) = log![[thin space (1/6-em)]](https://www.rsc.org/images/entities/char_2009.gif) qe − k1t/2.303 qe − k1t/2.303
| (3) |
| | |
t/qt = t/qe + 1/k2qe2
| (4) |
where
qe (mg g
−1) and
qt (mg g
−1) are the adsorption capacity at equilibrium and at any time
t, respectively.
t (min) is the contact time.
k1 (min
−1) is the pseudo-first-order rate constant, while
k2 (g (mg
−1 min
−1)) is the pseudo-second-order rate constant for cesium adsorption process.
k1 and
k2 can be obtained from the plot of experimental data.
The linear fitting of pseudo-first-order and pseudo-second-order model were shown in Fig. 7. The calculated parameters of qe, k1 and k2 were tabulated in Table 1, respectively. Compared with the two models, the correlation coefficient (R2 = 0.999) of pseudo-second-order model was higher than pseudo-first-order model. Besides, the calculated equilibrium adsorption capacity qe (60.827 mg g−1) in pseudo-second-order kinetics model was closer to the experimental data (57.133 mg g−1). It was demonstrated that the adsorption of cesium obeyed the pseudo-second-order kinetic model over the whole adsorption process, implying that the main rate limiting step was chemical adsorption involved valence forces through sharing or exchange of electrons between the adsorbent and adsorbate.23,28 The maximum adsorption capacity was 60.827 mg g−1.
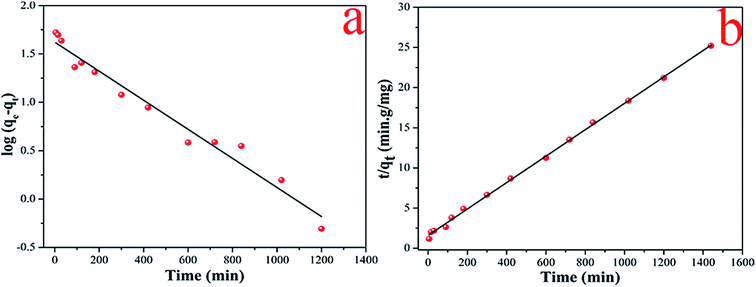 |
| | Fig. 7 The linear fitting of pseudo-first-order kinetic models (a) and pseudo-second-order kinetic models (b) of Cs+. | |
Table 1 Parameters of linear pseudo-first-order kinetics and pseudo-second-order kinetics
| Type |
Parameter |
| qe(exp) (mg g−1) |
Pseudo-first-order model |
Pseudo-second-order model |
| qe (mg g−1) |
k1 (min−1) |
R2 |
qe (mg g−1) |
k2 (g (mg−1 min−1)) |
R2 |
| Linear |
57.133 |
41.941 |
3.45 × 10⁻³ |
0.970 |
60.827 |
1.68 × 10⁻⁴ |
0.999 |
3.1.4. Effect of initial cesium concentration and adsorption isotherm model. The effect of different initial cesium concentrations varying from 10 to 100 mg L−1 at different temperatures were showed in Fig. 8. It was found that all the adsorption capacity increased rapidly at the initial concentration of 10–40 mg L−1 and increased slowly within the concentration of 40–100 mg L−1 in the range of temperature from 288.15 to 328.15 K. This may be explained that the increasing initial cesium solution concentration of cesium provided a necessary driving force to overcome all the mass transfer resistance to the Cs+ between the aqueous and solid phases, and then a lower number of coordination sites were available when the adsorption capacity tended to saturate.29
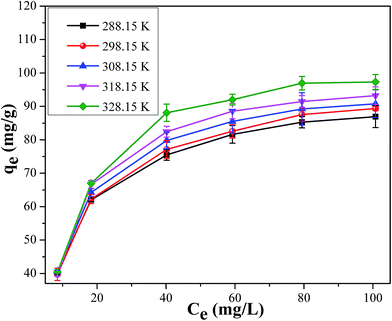 |
| | Fig. 8 Effect of initial concentration on adsorption capacity of 50 mL Cs+ for 24 h at 288.15–328.15 K. | |
Equilibrium isotherms provided information about the adsorption mechanism, surface properties and the affinity of the adsorbent. In this study, Langmuir and Freundlich models were utilized to describe the relationship between adsorbed cesium and its residual in aqueous solution at adsorption equilibrium. The equation of linear Langmuir model can be written as:30
| | |
Ce/qe = 1/(KLqm) + Ce/qm
| (5) |
While Freundlich isotherm explains multilayer adsorption on heterogeneous surfaces in nature.31 The linear Freundlich model can be expressed as:
| |
 | (6) |
where
qe (mg g
−1) is the adsorption capacity of cesium on the adsorbent at equilibrium,
C0 (mg L
−1) and
Ce (mg L
−1) are the initial cesium concentration and equilibrium cesium concentration, respectively.
KL (L mg
−1) is the calculated Langmuir constant related to the energy of adsorption and
qm (mg g
−1) is the monolayer adsorption capacity.
KF (mg g
−1) is the Freundlich constant indicates the multilayer adsorption capacity and
n is the intensity of adsorption.
The Langmuir and Freundlich values of qm, KL, n and KF can be obtained from the slope and intercept of the plots (Fig. 9), and the results were listed in Table 2. As evidenced by the correction coefficient R2, the Freundlich model presented more suitable than Langmuir model, indicating that the adsorption process belongs to multilayer adsorption with non-uniform distribution of adsorption heat and affinities over the heterogeneous surface. Additionally, the obtained 1/n values were between 0 and 1, indicating a highly favorable interaction in the whole adsorption process.
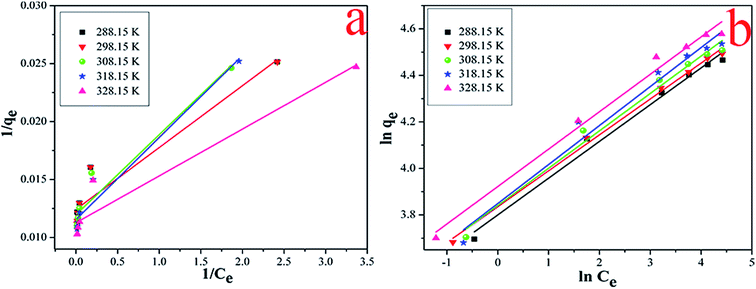 |
| | Fig. 9 The linear of Langmuir models (a) and Freundlich models (b) of Cs+. | |
Table 2 The linear of Langmuir and Freundlich models
| Type |
T (K) |
Langmuir |
Freundlich |
| qm (mg g−1) |
KL (L mg−1) |
R2 |
KF (mg g−1) (L mg−1)1/n |
n |
R2 |
| Linear |
288.15 |
80.451 |
2.328 |
0.909 |
1.335 |
6.327 |
0.986 |
| 298.15 |
80.451 |
2.328 |
0.909 |
1.344 |
6.483 |
0.995 |
| 308.15 |
83.542 |
1.737 |
0.932 |
1.345 |
6.220 |
0.983 |
| 318.15 |
86.580 |
1.634 |
0.955 |
1.348 |
5.965 |
0.966 |
| 328.15 |
88.731 |
2.790 |
0.918 |
1.367 |
6.216 |
0.985 |
3.1.5. Effect of temperatures and the evaluation of adsorption thermodynamics. Effect of various temperatures on the adsorption of cesium onto CMC–KCuFC particle was investigated at different initial concentrations range from 10 to 100 mg L−1. As shown in Fig. 10, while increasing the temperature from 288.15 to 328.15 K the influence of temperature was not obvious at all the initial concentrations ranging from 10–100 mg L−1. Therefore, from the aspect of energy saving, the following experiments were all conducted at 298.15 K.
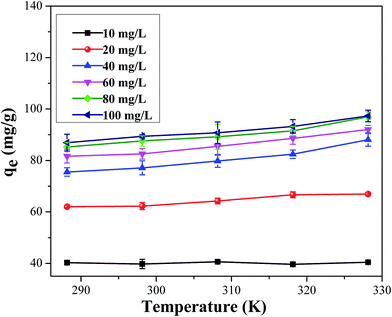 |
| | Fig. 10 Effect of temperature on the remove of 50 mL Cs+ for 24 h at 288.15–328.15 K. | |
In order to evaluate the thermodynamic feasibility and under the nature of the adsorption process, three basic thermodynamic parameters (ΔHo, ΔSo and ΔGo) were calculated by the following.31,32
| |
ln![[thin space (1/6-em)]](https://www.rsc.org/images/entities/char_2009.gif) Kd = ΔSo/R − ΔHo/RT Kd = ΔSo/R − ΔHo/RT
| (8) |
where
T (K) is the temperature.
R (8.314 J (mol
−1 K
−1)) is the universal gas constant.
Kd (mL g
−1) is the distribution coefficient. Δ
Ho (kJ mol
−1), Δ
So (J (mol
−1 K
−1)), Δ
Go (kJ mol
−1) are in the enthalpy change, entropy change and Gibbs free energy for the adsorption process, respectively. The values of Δ
Ho and Δ
So can be obtained from the slope and intercept of the Van't Hoff linear plots of ln
![[thin space (1/6-em)]](https://www.rsc.org/images/entities/char_2009.gif) Kd versus
Kd versus 1/
T. The results were shown in
Fig. 11. Meanwhile, the values of thermodynamic parameters for the adsorption of cesium at different temperatures were given in
Table 3.
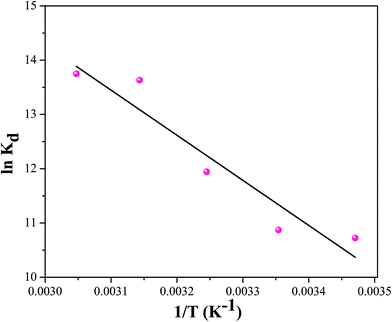 |
| | Fig. 11 The relationship between ln![[thin space (1/6-em)]](https://www.rsc.org/images/entities/char_2009.gif) Kd and 1/T for Cs+ adsorption of CMC–KCuFC particles. Kd and 1/T for Cs+ adsorption of CMC–KCuFC particles. | |
Table 3 Thermodynamic parameters for the adsorption process of cesium on CMC–KCuFC
| T (K) |
ln![[thin space (1/6-em)]](https://www.rsc.org/images/entities/char_2009.gif) Kd Kd |
ΔGo (kJ mol−1) |
ΔHo (kJ mol−1) |
ΔSo (J (mol−1 K−1)) |
| 288.15 |
10.723 |
−24.843 |
69.087 |
325.974 |
| 298.15 |
10.871 |
−28.102 |
| 308.15 |
11.945 |
−31.362 |
| 318.15 |
13.633 |
−34.622 |
| 328.15 |
13.750 |
−37.882 |
It can be found that all the ΔGo values were negative at the temperature range of 288.15 to 328.15 K, conforming that the adsorption of cesium onto CMC–KCuFC particle was thermodynamically feasible and spontaneous in nature. For the adsorption of cesium the positive values of ΔHo indicated that the adsorption was endothermic. Moreover, the positive value of ΔSo was interpreted as the result of an increase in the randomness at the solid/liquid interface during the adsorption of cesium on the adsorbent.33
3.1.6. Effect of competing ions on the adsorption of cesium. The influence of competing cations (e.g. Na+, K+, Li+, Ca2+ and Mg2+) on the Kd value of cesium ion onto the CMC–KCuFC particle was investigated. These five cations were selected due to their natural abundance in wastewater. The effect was studied by keeping the concentration of Cs+ constant (20 mg L−1), and varying the concentrations of Na+, K+, Li+, Ca2+ and Mg2+ under pH (5 ± 0.02) at 298.15 K. In the absence of added cations, the value of Kd was 9493.094 mL g−1. The results under competition with added cations were presented in Fig. 12. As the concentration added cations increase from 50 to 250 mg L−1, the Kd value was substantially increased in the following sequence: K+ < Na+ < Ca2+ < Mg2+ < Li+. The Kd value was lowest in the presence of K+, which could be attributed to the closer similarity in hydration radius between K+ (3.30 Å) and Cs+ (3.25 Å) than that of the other cations.34 Meanwhile, the influences of Ca2+ and Mg2+ cations on the adsorption might be involved in other process or steps except ion exchange, such as nonspecific surface adsorption.35
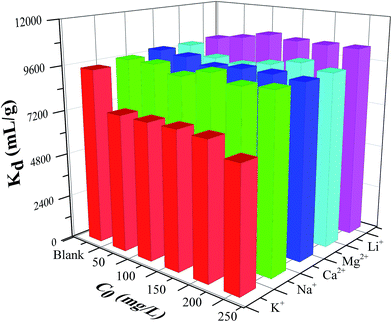 |
| | Fig. 12 Effect of competing ions on the remove of 50 mL 20 mg L−1 Cs+ for 24 h at 298.15 K. | |
In order to investigate effect of adsorbent dose on the Kd value, the results were shown in Table 4 and Fig. 13. It was obvious that the Kd value of cesium increased rapidly with increasing dose of CMC–KCuFC particles, which might be due to the reason that the adsorbent provided greater surface area and available active adsorption sites with increasing dose of CMC–KCuFC particles.36 Besides, it can be found that the adsorption properties of competing ions for Cs in the high adsorbent dose were consistent with the results obtained in the low adsorbent dose of Cs, and in the condition of high concentration of five cations, the Kd value of cesium ion still remain at a very high level (>8 × 10⁴ mL g−1), the results indicated that the CMC–KCuFC particles has good selectivity for cesium ion.
Table 4 Effect of adsorbent dose on the Kd value of cesium ion by the CMC–KCuFC particles [cesium concentration: 20 mg L−1, temperature: 298.15 K]
| Adsorbent dose (g) |
Waste volume (mL) |
Adsorption capacity (mg g−1) |
Kd (mL g−1) |
| 0.006 |
50 |
63.177 |
6030.873 |
| 0.007 |
50 |
63.280 |
7043.821 |
| 0.008 |
50 |
61.994 |
7779.583 |
| 0.009 |
50 |
60.727 |
8627.267 |
| 0.010 |
50 |
59.372 |
9493.094 |
| 0.020 |
50 |
43.927 |
1.099 × 10⁵ |
| 0.030 |
50 |
29.862 |
4.117 × 10⁵ |
| 0.040 |
50 |
22.438 |
4.533 × 10⁵ |
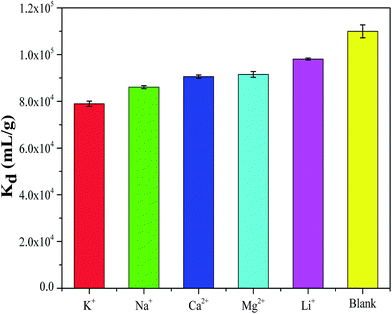 |
| | Fig. 13 Effect of competing ions on Kd by CMC–KCuFC particles (pH: 5, initial cesium concentration: 20 mg L−1, adsorbent dose: 0.02 g, temperature: 298.15 K). | |
3.1.7. Comparison with other adsorbents. Comparing the adsorption capacity of other cesium adsorbents with that of the CMC–KCuFC adsorbent,9,33,37–39 the result was listed in Table 5. It clearly revealed that the adsorption capacity of prepared adsorbent was much higher than most of cesium adsorbents. More important, this adsorbent was prepared only using environmental friendly and inexpensive materials at room temperature. Therefore, CMC–KCuFC adsorbent was a cost-effective adsorbent for cesium removal.
Table 5 Comparison of maximum adsorption capacity of adsorbents reported in literature for Cs+ adsorptiona
| Adsorbent |
pH |
T (K) |
qmax (mg g−1) |
References |
| Note: ‘—’ represented the information was not given in the references. |
| Whisker-supported composite |
6 |
298.15 |
32.90 |
38 |
| Pre-treated arca shell biomass |
5.5 |
— |
3.93 ± 0.11 |
33 |
| Prussian-blue-modified magnetite |
— |
— |
16.20 |
39 |
| Nickel hexacyanoferrate–walnut shell |
— |
298.15 |
4.94 ± 0.5 |
9 |
| Nanocrystalline mordenite |
— |
298.15 |
37.30 |
40 |
| CMC–KCuFC particles |
4–10 |
298.15 |
60.827 |
This study |
| CMC–Cu |
4–10 |
298.15 |
7.85 |
This study |
3.2. Adsorption experiments in a fixed bed column
3.2.1. Effect of bed height. Effect of bed height (2, 3 and 4 cm) on the breakthrough curve at a constant initial cesium concentration (10 mg L−1) and flow rate (2.4 mL min−1) was shown in Fig. 14. With an increase of the bed height, the breakthrough curve moves from left to right and both breakthrough point and the saturation point were obviously increased. The explanation was that more available adsorption binding sites at higher bed height, which meant that consequently the total adsorbed cesium ions increased. Moreover, an increase in the bed height resulted in a wide mass transfer zone,40 which made the breakthrough curves moderately steeper. In fact when the bed height increased, a longer time was required to reach the breakthrough point and saturation point. Therefore, for better performance of a fixed-bed column, a desirable bed height would be important for removal of the metal ions by CMC–KCuFC particles in the practical application.
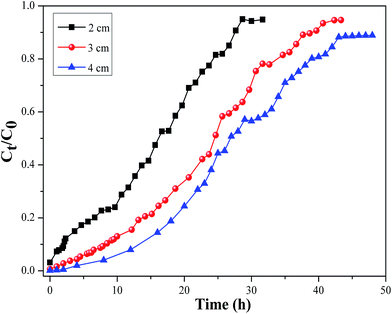 |
| | Fig. 14 Effect of bed height on the breakthrough curve of Cs adsorption onto CMC–KCuFC particles (pH 5 ± 0.02, influent concentration = 10 mg L−1, influent flow rate = 2.4 mL min−1, T = 298.15 K). | |
3.2.2. Effect of influent cesium concentration. Effect of influent cesium concentration (5, 10 and 20 mg L−1) on the breakthrough curve at a constant bed height (3 cm) and flow rate (2.4 mL min−1) was shown in Fig. 15. An increase in the influent cesium concentration can lead to the faster breakthrough point and saturation point and as a consequence the sharper breakthrough curves shifted to the left. The adsorption process reached saturation faster and the breakthrough time appeared earlier with increasing influent concentration. It might be for the reason that the more feeding of adsorbent on per unit surface area of the adsorbent caused the faster saturation of the column bed.41 On the other hand, it can be explained that a higher concentration gradient caused a faster transport due to an increase in the diffusion coefficient or mass transfer coefficient.42,43
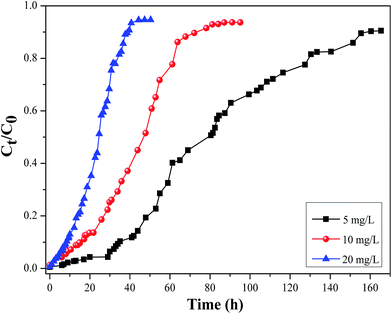 |
| | Fig. 15 Effect of influent cesium concentration on the breakthrough curve of Cs adsorption onto CMC–KCuFC particles (pH 5 ± 0.02, bed height = 3 cm, influent flow rate = 2.4 mL min−1, T = 298.15 K). | |
3.3. Characterization of the materials
3.3.1. SEM and BET analysis. SEM analysis of CMC–KCuFC adsorbent before and after adsorption were presented in Fig. 16. As shown in Fig. 16a, all the particles were of spherical shape, with a remarkably similar size of 2–3 mm after drying. It was observed that the outer surface of the dried CMC–KCuFC particles contained large porous channels, and large pores were visible in the SEM image (Fig. 16b). From highly magnified images of Fig. 16c, it was clearly showed that they were highly cross-linked. Lots of KCuFC particles were encapsulated in the network of CMC. Comparing with CMC–KCuFC particles before and after adsorption (Fig. 16c and d), it was obvious that there is no significant shape change. It can be demonstrated that CMC–KCuFC particles had excellent mechanical stability. Meanwhile, the results of multipoint BET analysis were shown in Table 6. It can be seen easily that the BET surface area of CMC–KCuFC particles was 55.275 m2 g−1, which was more than twice of CMC–Cu, and the total pore volumes of CMC–KCuFC particles was 0.024 cm3 g−1, while that of CMC–Cu was 0.0036 cm3 g−1. Therefore an increase in the total surface and pore volume in the CMC–KCuFC particles would have increased the possibility of internal diffusion.
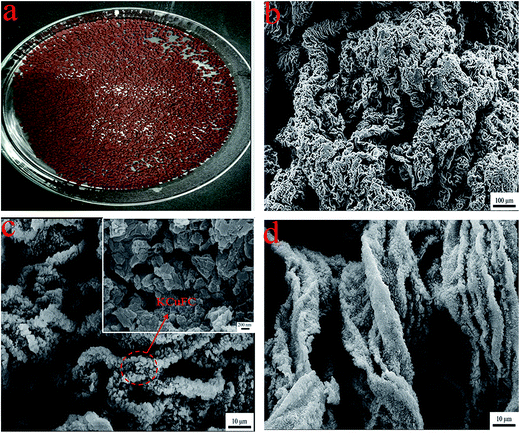 |
| | Fig. 16 SEM analyses of the samples: the digital photos of (a) CMC–KCuFC after drying (b) SEM of CMC–KCuFC before adsorption, (c) and inset are SEM of CMC–KCuFC particles after adsorption (higher magnification), (d) is SEM of CMC–KCuFC particles after adsorption. | |
Table 6 Pore structure parameters of CMC–Cu and CMC–KCuFC particles
| Sample |
Surface area (m2 g−1) |
Total pore volume (cm3 g−1) |
| CMC–Cu |
37.181 |
0.0086 |
| CMC–KCuFC |
55.275 |
0.0240 |
3.3.2. FT-IR analysis. Shown in Fig. 17a–c were the FT-IR spectra of CMC, CMC–KCuFC particles and CMC–KCuFC particles after adsorption, respectively. A broad absorption band at 3429–3432 cm−1 was relative to the –OH stretching vibration, while the bands around 2919–2923 cm−1 attributed to the C–H stretching vibration from –CH2 group. And the absorption band around 1611 cm−1, 1422 cm−1 and 1060 cm−1 were referred to the stretching vibration of COO– (asymmetric), COO– (symmetric) and C–O group, respectively.43 Comparing the spectrum of the CMC–KCuFC with that of the CMC, a sharp absorption band located at 2096 cm−1 appeared which was attributed to the C![[triple bond, length as m-dash]](https://www.rsc.org/images/entities/char_e002.gif) N stretching vibration.1 Compared Fig. 17a with 17b, two smaller peaks at 494.8 and 600.5 cm−1 were assigned to Fe2+–C
N stretching vibration.1 Compared Fig. 17a with 17b, two smaller peaks at 494.8 and 600.5 cm−1 were assigned to Fe2+–C![[triple bond, length as m-dash]](https://www.rsc.org/images/entities/char_e002.gif) N– and –C
N– and –C![[triple bond, length as m-dash]](https://www.rsc.org/images/entities/char_e002.gif) N–Cu2+ in-plane deformation vibration.16,19 All these characteristic peaks clearly suggested that the expected KCuFC particles in the CMC–KCuFC particles were successfully prepared.
N–Cu2+ in-plane deformation vibration.16,19 All these characteristic peaks clearly suggested that the expected KCuFC particles in the CMC–KCuFC particles were successfully prepared.
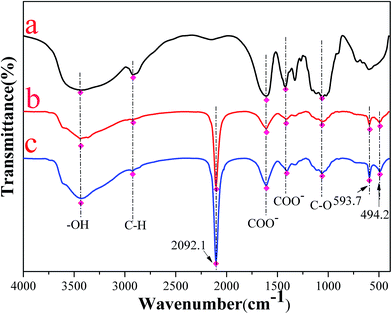 |
| | Fig. 17 FT-IR spectra of the samples: (a) CMC, (b) CMC–KCuFC particles, (c) CMC–KCuFC particles after adsorption. | |
3.3.3. EDX analysis. EDX analysis spectra of adsorbents were shown in Fig. 18. Comparing Fig. 18a and b, the element peaks of N, Fe, C, Cu and K were recorded in the EDX spectra of CMC–KCuFC particles (Fig. 18b). After the Cs+ adsorption, new peaks corresponding to cesium ion appeared (Fig. 18c), which elucidated that Cs+ was effectively adsorbed onto CMC–KCuFC adsorbent.
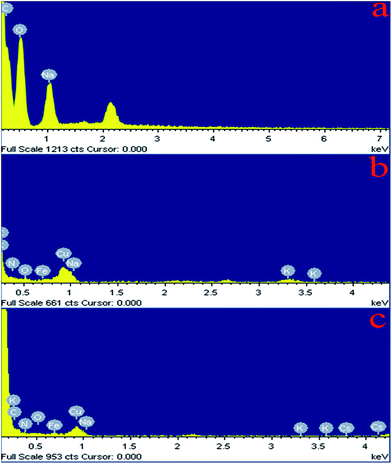 |
| | Fig. 18 EDX micrographs of (a) CMC, (b) CMC–KCuFC, (c) CMC–KCuFC–Cs. | |
The percentage of surface atomic concentration determined by EDX spectra is listed in Table 7. Element content of Na and Cu before and after reaction are changed from 7.53% and 0 to 0.26% and 6.09%, respectively. Which shows that Na+ along with Cu2+ participated in the ion exchange. Moreover, element content of K change from 2.30% to 0.06% before and after Cs adsorption, indicating that the K+ is exchanged with Cs+.
Table 7 Atomic concentrations on the absorbent surfaces obtained using EDX (data precision is ±5%)
| Sample |
Atomic concentration (%) |
| Na |
Cu |
Fe |
K |
Cs |
| CMC |
7.53 |
0 |
0 |
0 |
0 |
| CMC–KCuFC |
0.26 |
6.09 |
7.36 |
2.30 |
0 |
| CMC–KCuFC–Cs |
0.23 |
5.65 |
6.47 |
0.06 |
1.36 |
3.3.4. XRD analysis. XRD analysis of CMC, CMC–Cu and CMC–KCuFC were given in Fig. 19. The characteristic peaks for CMC–Cu were not observed, which was considered to be the amorphous structure of CMC–Cu. Similar result was obtained for the XRD profile for FPPB nanocomposite.44 After the growth of KCuFC, a few new diffraction peaks appeared at 44.8°, 40.0°, 35.7°, 24.9° and 17.6° were assigned to the (4 2 2), (4 2 0), (4 0 0), (2 2 0) and (2 0 0) plane, which agreed with KCuFC crystal (JCPDS card no. 53-0084). Taken together with the IR analysis, it can be inferred that presence of KCuFC was dispersed in the polymer matrix.
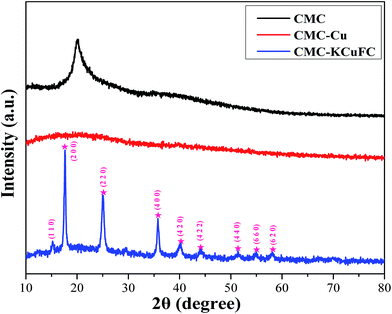 |
| | Fig. 19 XRD spectra of the samples: CMC, CMC–Cu and CMC–KCuFC particles. | |
3.3.5. TGA analysis. Thermogravimetric analysis (TGA) curves in the oxygen atmosphere of CMC, CMC–Cu and CMC–KCuFC were shown in Fig. 20. These composites showed the initial weight loss at 33–170 °C, was related to the evaporation water molecules. The major mass loss of CMC begun at 260 °C (11%), whereas the major mass loss of the composite CMC–Cu started at 160 °C (14%), and the composite CMC–KCuFC exhibited its major weight loss at 165 °C (22%). Between 339 °C and 441 °C, CMC–KCuFC particles showed a more obvious weight loss compared with CMC and CMC–Cu, corresponding to the decomposition of the cyanide group.45 The rapid weight loss in the range of 220–370 °C both in the CMC and CMC–KCuFC was attributed to polymer degradation. After heating up to 750 °C, about 27% residue was left as charred mass. As it can be observed from these results, the prepared composite was stable up to 180 °C.
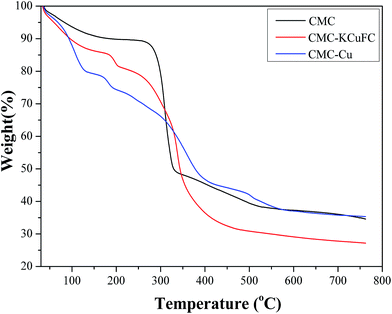 |
| | Fig. 20 TGA curves of the samples: CMC, CMC–Cu and CMC–KCuFC particles. | |
3.3.6. Mechanism of Cs adsorption. To understand the Cs+ adsorption mechanism of CMC–KCuFC particles, based on the adsorption models with the analysis of SEM, FT-IR, EDX discussed in the above sections, the mechanism of CMC–KCuFC particles formation and cesium adsorption by CMC–KCuFC particles can be proposed in Fig. 21. It could be conclude that ion-exchange reactions between Na+ and Cu2+. The process was shown in Fig. 21A.
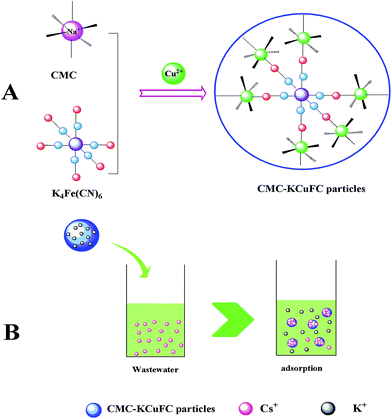 |
| | Fig. 21 (A) Schematic diagram of the fabrication process of CMC–KCuFC particles, (B) supposed mechanism of the adsorption of cesium. | |
KCuFC was a cubic, lattice-based, crystal with Cu2+ and Fe2+ atoms occupying alternate corners of the cubic lattice, and cyanide groups on the edges, the Cu2+ ions were octahedrally coordinated to the nitrogen from the cyanide bridge, and the Fe2+ linked to their carbon ends. Fe2+ was six fold carbon-coordinated, while Cu2+ was six fold nitrogen coordinated. In the adsorption process of Cs+ uptake by CMC–KCuFC, adsorption kinetic study showed that Cs adsorption on the CMC–KCuFC was controlled by chemisorption. That was to say, the adsorption process was dependent on the number of available adsorption sites on the adsorbent surface, and was eventually controlled by the binding of Cs+ to the surface or internal of the adsorbent. In addition, we investigated the changed values of the concentrations of Cs+ and K+ before and after adsorption, the results were shown in Table 8. It was observed that the amount of K+ in the solution increased from 0 to 0.031 mmol while the amount of Cs+ decreased from 0.038 to 0.025 mmol. Thus, as predicted, the exchange mechanism being the insertion of Cs ions into KCuFC crystal lattice, and concurrently displaced K ions from the lattice. The process was shown in Fig. 21B, and this is similar to the mechanism of cesium removal using K2CuFe(CN)6 adsorbent as ref. 46.
Table 8 The changed values before and after adsorption [initial concentration of Cs+: 100 mg L−1, dose: 0.05 g, T: 298.15 K]
| Material |
Cs+ (mmol) |
K+ (mmol) |
| CMC–KCuFC before adsorption |
0.038 |
0 |
| CMC–KCuFC after adsorption |
0.025 |
0.012 |
4. Conclusions
The CMC–KCuFC adsorbent was successfully synthesized via an syringe pump device and used for removal of cesium from water. Batch experiments were investigated for the adsorption property of CMC–KCuFC adsorbent, and the results showed a high adsorption capacity was 60.827 mg g−1 for Cs+. The adsorption behavior of CMC–KCuFC fitted well with Freundlich isotherm models and the pseudo-second-order kinetic model. In addition, studies with the effect of pH confirmed that these particles can be used effectively over the pH range of 5–10. Moreover, the CMC–KCuFC with adsorbed Cs+ was easily separated from water with filtration. Thus, the simple preparation method and excellent adsorption capacity enabled CMC–KCuFC adsorbent to be one of the promising candidates for efficient and sensitive removal of cesium in continuous operation.
Acknowledgements
This work was supported by the National Decommissioning of Nuclear Facilities and Radioactive Waste Management Research Projects Focus, SASTIND China (2014-806); Science and Technology Project of Qinghai Province (2014-GX-Q04) and key platform fund of Engineering Research Center of Biomass Materials, Ministry of Education (14tdsc01), National Natural Science Foundation of China (21406182). Analytical facilities were mainly provided by the Engineering Research Center of Biomass Materials, Ministry of Education.
References
- R. Yi, G. Ye and F. C. Wu, et al., Highly efficient removal of 137Cs in seawater by potassium titanium ferrocyanide functionalized magnetic microspheres with multilayer core-shell structure, RSC Adv., 2014, 4, 37600–37608 RSC.
- E. Calabrese, Improving the scientific foundations for estimating health risks from the Fukushima incident, Proc. Natl. Acad. Sci. U. S. A., 2011, 108, 19447–19448 CrossRef CAS PubMed.
- C. Dwivedi, A. Kumar and J. K. Ajish, et al., Resorcinol-formaldehyde coated XAD resin beads for removal of cesium ions from radioactive waste: synthesis, sorption and kinetic studies, RSC Adv., 2012, 2, 5557–5564 RSC.
- R. R. Sheha, Synthesis and characterization of magnetic hexacyanoferrate (II) polymeric nanocomposite for separation of cesium from radioactive waste solutions, J. Colloid Interface Sci., 2012, 388, 21–30 CrossRef CAS PubMed.
- T. Sangvanich, V. Sukwarotwat and R. J. Wiacek, et al., Selective capture of cesium and thallium from natural waters and simulated wastes with copper ferrocyanide functionalized mesoporous silica, J. Hazard. Mater., 2010, 182, 225–231 CrossRef CAS PubMed.
- A. Y. Zhang, W. W. Zhang and Y. N. Wang, et al., Effective separation of cesium with a new silica-calix [4] biscrown material by extraction chromatography, Sep. Purif. Technol., 2016, 171, 17–25 CrossRef CAS.
- E. Makrlik, P. Vanura and P. Selucky, Solvent extraction of cesium into nitrobenzene by using a synergistic mixture of hydrogen dicarbollylcobaltate and polypropylene glycol PPG 425, J. Radioanal. Nucl. Chem., 2011, 287, 981–985 CrossRef CAS.
- H. Rogers, J. Bowers and D. Gates-Anderson, An isotope dilution-precipitation process for removing radioactive cesium from wastewater, J. Hazard. Mater., 2012, 243, 124–129 CrossRef CAS PubMed.
- D. H. Ding, Y. X. Zhao and S. J. Yang, et al., Adsorption of cesium from aqueous solution using agricultural residue-walnut shell: equilibrium, kinetic and thermodynamic modeling studies, Water Res., 2013, 47, 2563–2571 CrossRef CAS PubMed.
- C. Dwivedi, A. Kumar and K. K. Singh, et al., Copper hexacyanoferrate-polymer composite beads for cesium ion removal: synthesis, characterization, sorption, and kinetic studies, J. Appl. Polym. Sci., 2013, 129, 152–160 CrossRef CAS.
- H. Faghihian, M. Moayed and A. Firooz, et al., Synthesis of a novel magnetic zeolite nanocomposite for removal of Cs+ and Sr2+ from aqueous solution: kinetic, equilibrium, and thermodynamic studies, J. Colloid Interface Sci., 2013, 393, 445–451 CrossRef CAS PubMed.
- A. M. El-Kamash, Evaluation of zeolite A for the sorptive removal of Cs+ and Sr2+ ions from aqueous solutions using batch and fixed bed column operations, J. Hazard. Mater., 2008, 151, 432–445 CrossRef CAS PubMed.
- S. P. Mishra, Removal behavior of hydrous manganese oxide and hydrous stannic oxide for Cs (I) ions from aqueous solutions, Sep. Purif. Technol., 2007, 54, 10–17 CrossRef CAS.
- R. G. Anthony, D. Gu and C. V. Philip, et al., Use of silicotitanates for removing cesium and strontium from defense waste, Ind. Eng. Chem. Res., 1994, 33, 2702–2705 CrossRef CAS.
- G. Murthy, M. Sivaiah and S. Kumar, et al., Adsorption of cesium on a composite inorganic exchanger zirconium phosphate-ammonium molybdophosphate, J. Radioanal. Nucl. Chem., 2004, 260, 109–114 CrossRef CAS.
- A. Nilchi, R. Saberi and M. Moradi, et al., Adsorption of cesium on copper hexacyanoferrate-PAN composite ion exchanger from aqueous solution, Chem. Eng. J., 2011, 172, 572–580 CrossRef CAS.
- J. Causse, A. Tokarev and J. Ravaux, et al., Facile one-pot synthesis of copper hexacyanoferrate nanoparticle functionalised silica monoliths for the selective entrapment of 137Cs, J. Mater. Chem., 2014, 2, 9461–9464 RSC.
- R. Chen, M. Asai and C. Fukushima, et al., Column study on electrochemical separation of cesium ions from wastewater using copper hexacyanoferrate film, J. Radioanal. Nucl. Chem., 2015, 303, 1491–1495 CrossRef CAS.
- T. Vincent, C. Vincent and Y. Barre, et al., Immobilization of metal hexacyanoferrates in chitin particles for cesium sorption: synthesis and characterization, J. Mater. Chem. A, 2014, 2, 10007–10021 CAS.
- M. A. Olatunji, M. U. Khandaker and H. N. M. E. Mahmud, et al., Influence of adsorption parameters on cesium uptake from aqueous solutions-a brief review, RSC Adv., 2015, 5, 71658–71683 RSC.
- S. Barkhordari and M. Yadollahi, Carboxymethyl cellulose capsulated layered double hydroxides/drug nanohybrids for cephalexin oral delivery, Appl. Clay Sci., 2016, 121, 77–85 CrossRef.
- W. W. Zhu, K. Liu and X. Q. Sun, et al., Mn2+-Doped Prussian Blue Nanocubes for Bimodal Imaging and Photothermal Therapy with Enhanced Performance, ACS Appl. Mater. Interfaces, 2015, 7, 11575–11582 CAS.
- S. S. Feng, X. D. Li and F. Ma, et al., Prussian blue functionalized microcapsules for effective removal of cesium in a water environment, RSC Adv., 2016, 6, 34399–34410 RSC.
- A. Shukla, Y. H. Zhang and P. Dubey, et al., The role of sawdust in the removal of unwanted materials from water, J. Hazard. Mater., 2002, 95, 137–152 CrossRef CAS PubMed.
- A. K. Vipin, B. Y. Hu and B. Fugetsu, Prussian blue caged in alginate/calcium particles as adsorbents for removal of cesium ions from contaminated water, J. Hazard. Mater., 2013, 258, 93–101 CrossRef PubMed.
- L. Kong, L. L. Yan and Z. Qu, et al., β-Cyclodextrin stabilized magnetic Fe3S4 nanoparticles for efficient removal of Pb(ii), J. Mater. Chem. A, 2015, 3, 15755–15763 CAS.
- B. El-Gammal, G. M. Ibrahim and I. M. El-Naggar, Preparation of some resorcinol formaldehyde resins for the separation of 134Cs from acidic waste streams, Desalin. Water Treat., 2014, 52, 4721–4733 CrossRef CAS.
- Y. S. Ho and G. Mckay, Pseudo-second order model for sorption processes, Process Biochem., 1999, 34, 451–465 CrossRef CAS.
- C. Dwivedi, S. K. Pathak and M. Kumar, et al., Preparation and characterization of potassium nickel hexacyanoferrate-loaded hydrogel particles for the removal of cesium ions, Environ. Sci.: Water Res. Technol., 2015, 1, 153–160 CAS.
- G. Vijayakumar, C. K. Yoo and K. G. P. Elango, et al., Adsorption characteristics of rhodamine B from aqueous solution onto baryte, Clean: Soil, Air, Water, 2010, 38, 202–209 CrossRef CAS.
- H. J. Yang, H. Y. Li and J. L. Zhai, et al., Magnetic Prussian blue/graphene oxide nanocomposites caged in calcium alginate microparticles for elimination of cesium ions from water and soil, Chem. Eng. J., 2014, 246, 10–19 CrossRef CAS.
- Z. L. Zhang, X. H. Xu and Y. S. Yan, Kinetic and thermodynamic analysis of selective adsorption of Cs (I) by a novel surface whisker-supported ion-imprinted polymer, Desalination, 2010, 263, 97–106 CrossRef CAS.
- S. Dahiya, R. M. Tripathi and A. G. Hegde, Biosorption of heavy metals and radionuclide from aqueous solutions by pre-treated arca shell biomass, J. Hazard. Mater., 2008, 150, 376–386 CrossRef CAS PubMed.
- H. Long, P. Wu and N. Zhu, Evaluation of Cs+ removal from aqueous solution by adsorption on ethylamine-modified montmorillonite, Chem. Eng. J., 2013, 225, 237–244 CrossRef CAS.
- J. Wu, B. Li and J. Liao, et al., Behavior and analysis of cesium adsorption on montmorillonite mineral, J. Environ. Radioact., 2009, 100, 914–920 CrossRef CAS PubMed.
- A. Shukla, Y. H. Zhang and P. Dubey, et al., The role of sawdust in the removal of unwanted materials from water, J. Hazard. Mater., 2002, 95, 137–152 CrossRef CAS PubMed.
- Z. L. Zhang, X. H. Xu and Y. S. Yan, Kinetic and thermodynamic analysis of selective adsorption of Cs (I) by a novel surface whisker-supported ion-imprinted polymer, Desalination, 2010, 263, 97–106 CrossRef CAS.
- T. Sasaki and S. Tanaka, Magnetic separation of cesium ion using Prussian blue modified magnetite, Chem. Lett., 2012, 41, 32–34 CrossRef CAS.
- K. Y. Lee, M. Park and J. Kim, et al., Equilibrium, kinetic and thermodynamic study of cesium adsorption onto nanocrystalline mordenite from high-salt solution, Chemosphere, 2016, 150, 765–771 CrossRef CAS PubMed.
- E. Oguz and M. Ersoy, Removal of Cu2+ from aqueous solution by adsorption in a fixed bed column and neural network modelling, Chem. Eng. J., 2010, 164, 56–62 CrossRef CAS.
- J. M. Salman, V. O. Njoku and B. H. Hameed, Batch and fixed-bed adsorption of 2,4-dichlorophenoxyacetic acid onto oil palm frond activated
carbon, Chem. Eng. J., 2011, 174, 33–40 CrossRef CAS.
- I. Kavianinia, P. G. Plieger, N. G. Kandile and D. R. K. Harding, Fixed-bed column studies on a modified chitosan hydrogel for detoxification of aqueous solutions from copper (II), Carbohydr. Polym., 2012, 90, 875–886 CrossRef CAS PubMed.
- K. H. Chu, Fixed bed sorption: setting the record straight on the Bohart-Adams and Thomas models, J. Hazard. Mater., 2010, 177, 1006–1012 CrossRef CAS PubMed.
- H. J. Yang, H. Y. Li and J. L. Zhai, et al., In situ growth of Prussian blue nanocrystal within Fe3+ crosslinking PAA resin for radiocesium highly efficient and rapid separation from water, Chem. Eng. J., 2015, 277, 40–47 CrossRef CAS.
- J. H. Her, P. W. Stephens and C. M. Kareis, et al., Anomalous non-Prussian Blue structures and magnetic ordering of K2MnII[MnII(CN)6] and Rb2MnII[MnII(CN)6], Inorg. Chem., 2010, 49, 1524–1534 CrossRef CAS PubMed.
- C. L. Neskovic, S. Ayrault and V. Badillo, et al., Structure of copper-potassium hexacyanoferrate (II) and sorption mechanisms of cesium, J. Solid State Chem., 2004, 177, 1817–1828 CrossRef.
|
| This journal is © The Royal Society of Chemistry 2017 |
Click here to see how this site uses Cookies. View our privacy policy here.  Open Access Article
 *ab,
Xiaoyan Linab,
Dong Yeb,
Dan Qiaob and
Shuangneng Zengb
![[thin space (1/6-em)]](https://www.rsc.org/images/entities/char_2009.gif) qe − k1t/2.303
qe − k1t/2.303


![[thin space (1/6-em)]](https://www.rsc.org/images/entities/char_2009.gif) Kd = ΔSo/R − ΔHo/RT
Kd = ΔSo/R − ΔHo/RT
![[thin space (1/6-em)]](https://www.rsc.org/images/entities/char_2009.gif) Kd versus 1/T. The results were shown in Fig. 11. Meanwhile, the values of thermodynamic parameters for the adsorption of cesium at different temperatures were given in Table 3.
Kd versus 1/T. The results were shown in Fig. 11. Meanwhile, the values of thermodynamic parameters for the adsorption of cesium at different temperatures were given in Table 3.
![[thin space (1/6-em)]](https://www.rsc.org/images/entities/char_2009.gif) Kd
Kd![[triple bond, length as m-dash]](https://www.rsc.org/images/entities/char_e002.gif) N stretching vibration.1 Compared Fig. 17a with 17b, two smaller peaks at 494.8 and 600.5 cm−1 were assigned to Fe2+–C
N stretching vibration.1 Compared Fig. 17a with 17b, two smaller peaks at 494.8 and 600.5 cm−1 were assigned to Fe2+–C![[triple bond, length as m-dash]](https://www.rsc.org/images/entities/char_e002.gif) N– and –C
N– and –C![[triple bond, length as m-dash]](https://www.rsc.org/images/entities/char_e002.gif) N–Cu2+ in-plane deformation vibration.16,19 All these characteristic peaks clearly suggested that the expected KCuFC particles in the CMC–KCuFC particles were successfully prepared.
N–Cu2+ in-plane deformation vibration.16,19 All these characteristic peaks clearly suggested that the expected KCuFC particles in the CMC–KCuFC particles were successfully prepared.


