 Open Access Article
The removal of heavy metal ions from aqueous solutions by amine functionalized cellulose pretreated with microwave-H2O2
Cunzhi Zhang ab,
Jingjing Suab,
Hongxiang Zhu*ab,
Jianhua Xiongcd,
Xinliang Liuab,
Dongxue Liab,
Yangmei Chenab and
Yunhua Liab
aCollege of Light Industry and Food Engineering, Guangxi University, Nanning 530004, China. E-mail: zhx@gxu.edu.cn
bGuangxi Key Laboratory of Clean Pulp & Papermaking and Pollution Control, Nanning 530004, China
cSchool of Environment, Guangxi University, Nanning 530004, China
dDepartment of Paper and Bioprocess Engineering, State University of New York – College of Environmental Science and Forestry, Syracuse, NY 13210, USA
First published on 7th July 2017
Abstract
A new biosorbent (PEI/SA-MCCMV) with abundant amino and carboxyl groups was prepared by grafting polyethylenimine (PEI) onto carboxylated microcrystalline cellulose (SA-MCCMV), which was obtained through grafting succinic anhydride (SA) on pretreated microcrystalline cellulose (MCCMV) with microwave-H2O2. It was confirmed by Fourier transform infrared spectroscopy (FT-IR), scanning electron microscopy (SEM), X-ray photoelectron microscopy (XPS) and thermogravimetric (TG) that the amino and carboxyl groups were introduced onto the microcrystalline cellulose, and the amino and carboxyl groups content were 2.61 mmol g−1 and 4.64 mmol g−1, respectively. The effects of the contact time and pH on heavy metal ion uptake were investigated. The adsorption kinetic data was described well with the pseudo-second-order model (R2 > 0.99) and the adsorption isotherms were well fitted by the Freundlich isotherm model, demonstrating that chemisorption was the rate-controlling factor for heavy metal ion adsorption on the PEI/SA-MCCMV biosorbent. Furthermore, the remarkable adsorption capacity (217.3 and 357.1 mg g−1 for Cd(II) and Pb(II), respectively) obtained from the Langmuir isotherm indicated that this biomass adsorbent has a promising application in water treatment.
Introduction
Heavy metal ions from industrial wastewater are not biodegradable and easily accumulate in living organisms, causing various diseases and disorders, due to their toxic nature and other adverse effects.1 Lead and cadmium are the most toxic among heavy metal ions. Their removal from solutions is one of the most significant studies. Several technologies including both physical and chemical processes have been reported. Most of these methods require high operating costs and disposal of the resulting solid waste. Given the economical and environmental benefits, adsorption is the best technique for removing heavy metal ions.2Cellulose is the most abundant polymer in nature and a low cost and promising raw material used for the preparation of various functional materials. However, its low adsorption capacity, slow removal rate and limited solubility in common solvents are the main constraints for its applications. In order to solve the above problems and improve its physical and chemical properties, chemical modification is necessary.3 The complexity of the cellulose morphology and aggregated structure leads to its low reactivity and poor uniformity in chemical reactions. Therefore it is critical to improve the availability and accessibility of cellulose to reagents. A reduction in the crystallinity of cellulose via various methods would be a good way. Hydrogen peroxide (H2O2) is a green and chemical oxidant. Water and oxygen as the oxidant products of H2O2 result in minimal environmental damage.4,5 Hydrogen peroxide (H2O2) can produce the hydroxyl radical ˙OH, which has a strong oxidizing potential. This can effectively break the long chains and the crystalline structure of cellulose. Compared with traditional heat-treatment, microwave (MV) pretreatment has the merits of rapid heating and minimal energy loss.6,7 Microwave irradiation with H2O2 (MV-H2O2) is characteristically well-distributed, and an efficient and highly penetrable pretreatment method. According to the literature, this method is recommended for the hydrolysis of cellulose8 and the pretreatment of cotton fabrics.9 However, microwave irradiation (with H2O2) as a pretreatment of cellulose to obtain a modified material has not been fully investigated.
The abundant hydroxyl groups on the surface of microcrystalline cellulose allow the introduction of several heavy metal adsorption groups onto the cellulose structure.10 The modification of cellulose hydroxyl groups includes esterification, etherification and graft co-polymerization. Polyamine materials, with various adsorption functional groups, have strong chelation properties towards metal ions. Currently, succinic anhydride esterification and graft co-polymerization with amine substances have been reported.3,11 However, the modification of cellulose with succinic anhydride and polyethylenimine has not been reported to date.
In this study, pretreated microcrystalline cellulose (MCCMV) with microwave-H2O2 was modified using succinic anhydride (SA) in N,N-dimethylformamide (DMF) solution to obtain carboxylated microcrystalline cellulose (SA-MCCMV) and the new PEI/SA-MCCMV biosorbent with abundant amino and carboxyl groups was prepared by grafting PEI onto SA-MCCMV. The adsorption ability and adsorption efficiency of PEI/SA-MCCMV were increased due to the introduction of carboxyl and amino functional groups. This study may be useful for further research in the production of advanced biosorbents from cellulose.
Materials and methods
Materials
Microcrystalline cellulose (25 μm, AR), succinic anhydride (99%, AR) and polyethylenimine (Mw = 600, 99%, AR) were purchased from Aladdin Corporation of China. CdCl2 (AR) and Pb (NO3)2 (AR) were provided by Tianjin Bodi Chemical Reagent Co., Ltd., China. Solutions of Cd(II) and Pb(II) were prepared by dissolving weighed amounts of the abovementioned chemicals in deionized water. N,N-Dimethylformamide (AR), glutaraldehyde (AR) and hydrogen peroxide (AR) used in the synthesis process were obtained from Chengdu Kelon chemical reagent factory, China. NaOH solution (0.1 and 0.01 mol L−1) and HNO3 solution (0.1 and 0.01 mol L−1) were prepared using sodium hydroxide (AR) and nitric acid (AR) to adjust the pH of aqueous media. All reagents were analytical reagent grade.Synthesis of PEI/SA-MCCMV
At full power, the microwave reactor delivered approximately 1800 W of microwave energy at a frequency of 2450 MHz and was controlled by a microcomputer that monitored the operation.12 Pre-processing was performed in a digestion tank with H2O2 solution (9%) and MCC (solid–liquid ratio 1![[thin space (1/6-em)]](https://www.rsc.org/images/entities/char_2009.gif) :
:![[thin space (1/6-em)]](https://www.rsc.org/images/entities/char_2009.gif) 20) at 90 °C for 5 min. The microwave reactor was digitally programmed to control the experimental conditions, which included a detection system to measure the real-time temperature and power. After the reaction was complete, the mixture was cooled, centrifuged, and dried to a constant weight in an oven. The obtained microcrystalline cellulose was denoted as MCCMV.
20) at 90 °C for 5 min. The microwave reactor was digitally programmed to control the experimental conditions, which included a detection system to measure the real-time temperature and power. After the reaction was complete, the mixture was cooled, centrifuged, and dried to a constant weight in an oven. The obtained microcrystalline cellulose was denoted as MCCMV.
The MCCMV was grafted with succinic anhydride via an esterification reaction at a mass ratio of MMCCMV![[thin space (1/6-em)]](https://www.rsc.org/images/entities/char_2009.gif) :
:![[thin space (1/6-em)]](https://www.rsc.org/images/entities/char_2009.gif) MSA = 1
MSA = 1![[thin space (1/6-em)]](https://www.rsc.org/images/entities/char_2009.gif) :
:![[thin space (1/6-em)]](https://www.rsc.org/images/entities/char_2009.gif) 4 for 6 h in order to obtain the SA-MCCMV. The reaction was carried out at 120 °C in the microreaction kettle under reflux in DMF (1 g of MCC: 10 mL of DMF) after grinding and mixing. Continuous stirring was always applied in the reaction process. The modified cellulose was washed in a soxhlet apparatus with ethanol for 6 h to remove the unreacted SA and finally washed in sequence with ethanol, deionized water, saturated sodium bicarbonate deionized water, ethanol, and acetone. Furthermore, 5.0 g of SA-MCCMV and 25 mL of PEI (20 wt%) (5 equiv. m/v) were placed into the flask within 50 mL of dimethylformamide (DMF), and then 50 mL of glutaraldehyde (2.5 wt%) (1
4 for 6 h in order to obtain the SA-MCCMV. The reaction was carried out at 120 °C in the microreaction kettle under reflux in DMF (1 g of MCC: 10 mL of DMF) after grinding and mixing. Continuous stirring was always applied in the reaction process. The modified cellulose was washed in a soxhlet apparatus with ethanol for 6 h to remove the unreacted SA and finally washed in sequence with ethanol, deionized water, saturated sodium bicarbonate deionized water, ethanol, and acetone. Furthermore, 5.0 g of SA-MCCMV and 25 mL of PEI (20 wt%) (5 equiv. m/v) were placed into the flask within 50 mL of dimethylformamide (DMF), and then 50 mL of glutaraldehyde (2.5 wt%) (1![[thin space (1/6-em)]](https://www.rsc.org/images/entities/char_2009.gif) :
:![[thin space (1/6-em)]](https://www.rsc.org/images/entities/char_2009.gif) 10 m/v) was added dropwise to the above mixture over 30 min. Continuous stirring was always applied in the reaction process. After 3 h, the reaction mixture was separated using a table centrifuge and the product was washed with ethanol/water (80/20 v/v) and deionized water to obtain PEI/SA-MCCMV. The obtained product was ground into a powder for the experiments.
10 m/v) was added dropwise to the above mixture over 30 min. Continuous stirring was always applied in the reaction process. After 3 h, the reaction mixture was separated using a table centrifuge and the product was washed with ethanol/water (80/20 v/v) and deionized water to obtain PEI/SA-MCCMV. The obtained product was ground into a powder for the experiments.
Characterization of PEI/SA-MCCMV
An FTIR type Vertex 70 by Bruker Optics (Germany) was used to identify the surface groups of the synthesized biosorbent. The FTIR spectra were recorded at a resolution of 4 cm−1 from 400 to 4000 cm−1 and 100 scans per sample.The surface and fracture section of the biosorbent was observed using a scanning electron microscope (SEM) by Phenom (Netherlands). The surface of the biosorbent was coated with gold to be observed and photographed.
Thermogravimetric (TG) analysis (NETZSCH, Germany) was carried out in an N2 atmosphere with a flow rate of 20 mL min−1 using 10 mg of the sample over a temperature range of 25–600 °C at a heating rate of 10 °C min−1.
X-ray photoelectron spectroscopy (XPS) measurements were performed on a Lebold Max200 instrument (Thermo Fisher Scientific, American) using monochromatic 12 (or 15) kV, 15–25 mA Al K radiation to determine the elemental compositions of the samples.
The degree of amination was investigated by measuring the amount of introduced amine functional groups.13,14 The content of amine groups was investigated using a back titration method. The sample (0.1000 g) was treated with a standard solution of 10 mmol L−1 aqueous HCl (100.0 mL) in a 250 mL Erlenmeyer for 1 h under mechanic stirring. Soon after, the mixture was separated by a single filtration step, and three 25.00 mL samples were titrated to a phenolphthalein end-point with a standard solution of 10 mmol L−1 aqueous NaOH. The concentration of amine groups was calculated using eqn (1):
 | (1) |
Batch adsorption experiments
In order to investigate the adsorption performance of the adsorbent towards Cd(II) and Pb(II), the effects of pH, the adsorption time and initial concentration were explored. Furthermore, 0.1 g of the biosorbent was added into 100 mL of a solution containing the metal ions in a 250 mL flask and then, the flask was placed in a WY103-B constant temperature shaker and stirred for a set time. The adsorption experiment was averaged three times. The metal ion concentration was analyzed using inductively coupled plasma optical emission spectroscopy (ICP-OES) (Agilent Technologies 7000, USA). Adsorption capacity of modified cellulose (mg g−1) was calculated as follows:
 | (2) |
The adsorbent was added into a heavy metal ion solution at a certain concentration (Cd(II) 200 mg L−1 and Pb(II) 300 mg L−1) at 298 K and the pH was adjusted to the set value. To completely dissolve the Cd(II) and Pb(II) ions in water, the pH was designed to range from pH 1 to 6. The pH was adjusted via the addition of drops of aqueous NaOH and/or HCl solution (0.1–1.0 mol L−1). The metal ion uptake capacities were measured as a function of time to determine the optimum contact times for the adsorption of Cd(II) and Pb(II) ions. The contact times in the present study were from 15 to 120 min for Cd(II) and 15 to 180 min for Pb(II). While performing the experiments, the samples were withdrawn at pre-determined time intervals and analyzed for metal adsorption. The effect of common co-existing ions (K(I), Na(I), Ca(II), Mg(II)) on the Pb(II) and Cd(II) adsorption was investigated by maintaining the concentration of Pb(II) and Cd(II) and each of the co-existing ion concentration ranges from 0 mg L−1 to 500 mg L−1 [Cd(II) 200 mg L−1 and Pb(II) 300 mg L−1].
The adsorbent after the first adsorption process was dried following its filtration and isolation and added to a conical flask with 0.1 mol L−1 HNO3 solution. Desorption was performed under ultrasonication for 30 min and then, and washings were repeatedly carried out with water until neutral. The adsorbent was dried and reused for the next adsorption experiment.
Results and discussion
Synthesis and characterization of the adsorbent
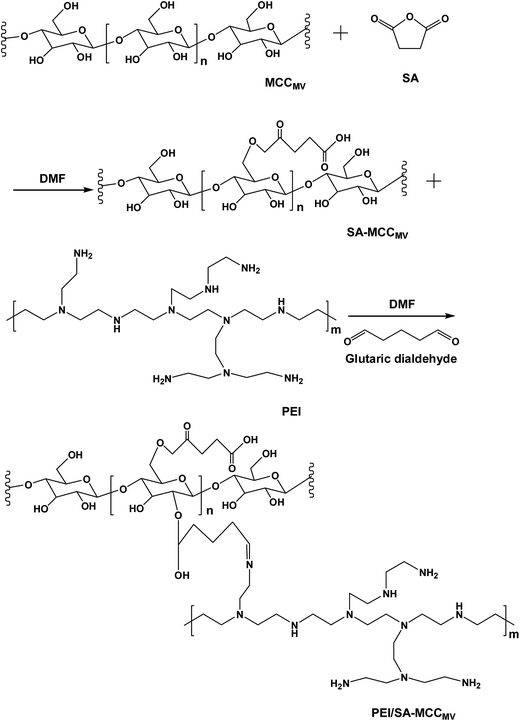
The synthesis route used to prepare PEI/SA-MCCMV is shown in Fig. 1. The carboxylic acid functional group was introduced into the cellulose skeleton via an esterification reaction in the first step. The carboxylated cellulose (SA-MCCMV) was used to synthesize the PEI/SA-MCCMV sample. In this pathway, glutaraldehyde was used as a coupling agent to graft the hydroxyl groups with polyethyleneimine (PEI). The concentration of the amine functionalities and nitrogen percentage were 2.61 mmol g−1 and 4.88%, respectively, and 2.39 mmol g−1 and 4.71% individually for the mercerizing pretreatment (for more than 12 h) experiment. Table 1 gives details for the elemental and amino contents of PEI/SA-MCCMV and PEI/SA-MMCC compared with the PEI/SA-MCC sample with no-pretreatment. The standard deviation was less than 0.5 in these values.| Sample | C 1s (wt%) | O 1s (wt%) | N 1s (wt%) | Amino content (mmol g−1) |
|---|---|---|---|---|
| a PEI/SA-MCC: no pretreatment, PEI/SA-MMCC: mercerizing pretreatment. | ||||
| MCCMV | 73.22 | 26.78 | — | — |
| PEI/SA-MCC | 79.81 | 17.60 | 2.59 | 1.27 |
| PEI/SA-MMCC | 74.66 | 20.63 | 4.71 | 2.39 |
| PEI/SA-MCCMV | 75.83 | 19.29 | 4.88 | 2.61 |
Therefore, it is possible that the MV-H2O2-assisted preparation (5 min) used for the preparation of PEI/SA-MCCMV was efficient and represented an alternative pathway to anchor the amine functional groups onto the succinylated cellulose to form the new adsorbent.
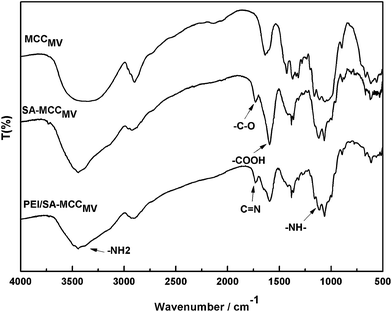
Fig. 2 shows the FT-IR spectra of MCCMV, SA-MCCMV and PEI/SA-MCCMV. The absorption peaks at 3349 cm−1, 2900 cm−1, 1634 cm−1, 1373 cm−1, 1160 cm−1, 1046 cm−1 and 894 cm−1 are associated with MCC.15 The strong adsorption at 3349 cm−1 was due to the stretching of –OH and at 2900 cm−1 due to aliphatic C–H stretching. The peak at 1634 cm−1 was attributed to the bending mode of the absorbed water and 1373 cm−1 to O–H bending. The absorption band at 1160 cm−1 corresponds to the C–O anti-symmetric bridge stretching of cellulose, 1046 cm−1 arises from the pyranose ring skeletal vibrations and 894 cm−1 is due to the β-glucosidic linkages between the sugar units.16,17 In the spectrum of succinylated cellulose, SA-MCCMV, the new peak at 1725 cm−1 was assigned to the asymmetric and symmetric stretching of the ester C–O bond, indicating the occurrence of the esterification reaction between cellulose and succinic anhydride during the synthesis. Furthermore, after the modification step, the appearance of the bands at 1598 cm−1, corresponding to the asymmetric stretching vibrations of the ionic carboxylic groups, verified the introduction of carboxylic groups on the surface18 (Zhao et al., 2007). Compared with MCC, the FTIR spectra of PEI/SA-MCCMV gives weaker peak intensities at 3438 and 2902 cm−1, which was attributed to the overlap of the stretching vibrations of NH2 (3400 and 3200 cm−1) with the characteristic peak of cellulose at 3349.19 Another peak at 1130 cm−1 indicated the stretching frequency of the secondary amine group from PEI.
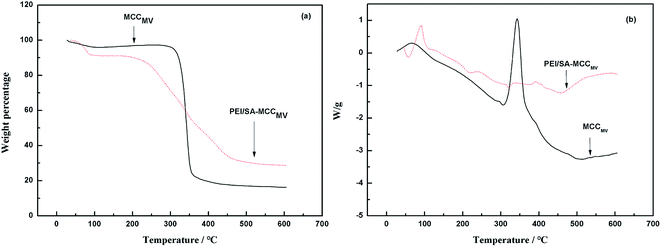
The TG curve obtained for MCCMV shows three stage decompositions. A 6% mass loss because of the evaporation of moisture, including free water, physically absorbed water and bound water at the initial stage before 100 °C.19 The second stage was the main stage of the decomposition, and an 80.5% mass loss at 320–450 °C was attributed to the carbonization-cracking of cellulose and the formation of carbonaceous residues. The long chains of cellulose were broken and the structure was split into low molecules. Moreover, 350 °C was the temperature characteristic of weightlessness of microcrystalline cellulose. For PEI/SA-MCCMV, an 11% weight loss was observed in the initial stage. The second stage occurred in the range of 320–500 °C with a mass loss of 63.05% due to the pyrolytic decomposition of the PEI polymer as well as the chain scissions of the grafted polymer. In the process of weightlessness, two inflection points at 350 °C and 500 °C were observed in the curve, and the thermal degradation temperature was elevated, indicating that the graft polymerization reaction was successful, and the adsorbent had a higher thermal stability than the parent compounds (Fig. 3).
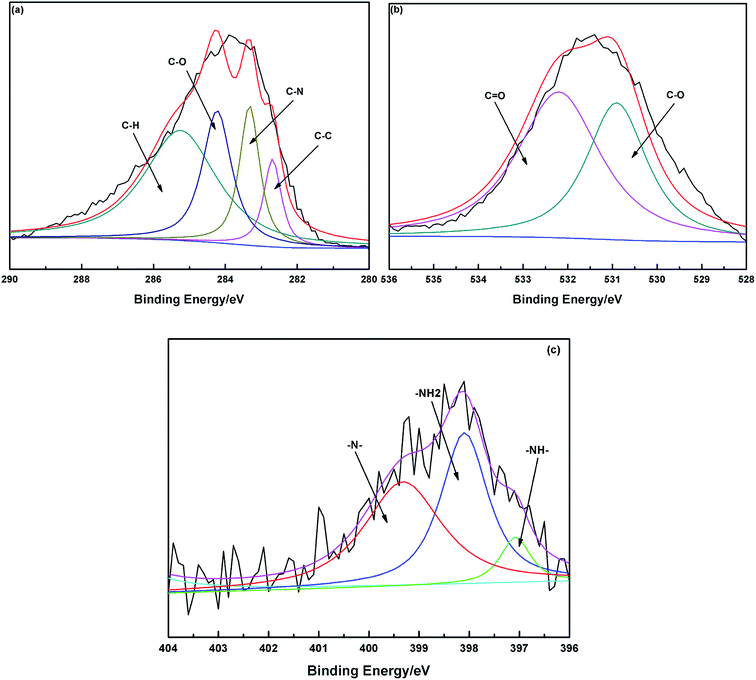
The C 1s peak corresponds to two main components, C–N and C–O, with the binding energy peaks at 283.4 and 284.8 eV.3 The emergence of C–N demonstrates that PEI already existed in the chelating materials. The N 1s XPS spectrum can be fitted into three peaks with the binding energy peaks at 397.1, 398.1 and 399.9 eV due to the R2NH, RNH2 and R3N groups, respectively.20 The oxygen-containing groups were determined by the O 1s XPS spectra. These could be fitted into two peaks with the binding energy at 531.1 and 532.2 eV, which were attributed to the C![[double bond, length as m-dash]](https://www.rsc.org/images/entities/char_e001.gif) O and C–O groups.21 These also indicated that MCC had been modified with PEI by cross-linking the RNH2 groups of PEI with the –OH groups of cellulose, which was consistent with the FTIR spectra of PEI/SA-MCCMV (Fig. 4).
O and C–O groups.21 These also indicated that MCC had been modified with PEI by cross-linking the RNH2 groups of PEI with the –OH groups of cellulose, which was consistent with the FTIR spectra of PEI/SA-MCCMV (Fig. 4).
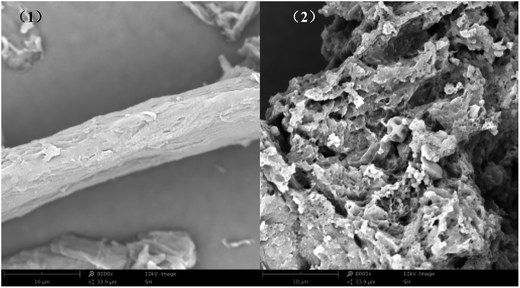
The SEM images of MCC (1; ×8000) and PEI/SA-MCCMV (2; ×8000) in Fig. 5 clearly show that the surface morphology of MCC had changed greatly after the modification step. For MCC (1; ×8000), its surface was relatively smooth, while for PEI/SA-MCCMV (2; ×8000), its surface was more rough and displayed a gap of honeycomb structure. The rough surface of PEI/SA-MCCMV (2; ×8000) revealed that the order of MCC was reduced during its synthesis.
Adsorption studies of Cd(II) and Pb(II)
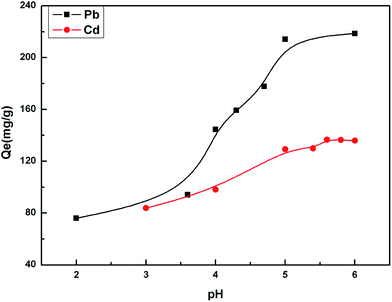
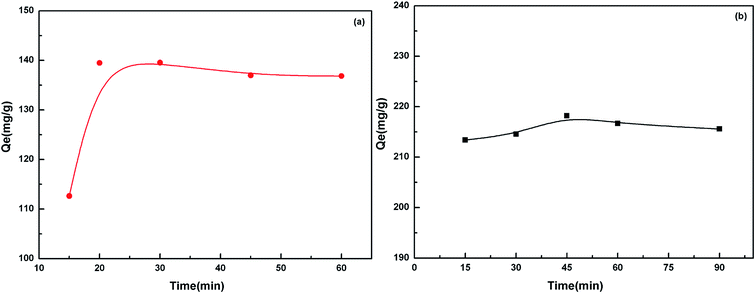
The pH value impacted the adsorption equilibrium and adsorption kinetics of heavy metals in water because the pH of the solution not only affects the hydrogen ion concentration of the surface functional groups but also has a great influence on the metal ions ionization.18 Therefore, it is necessary to find the optimum pH value in order to maximize the adsorption capacity of the adsorbents. The effect of pH on the adsorption of Cd(II) and Pb(II) is shown in Fig. 6. When the pH values were at pH 2–5 for Pb(II) and pH 3–6 for Cd(II), the higher the pH value was, the stronger the equilibrium adsorption capacity was. This can be attributed to the production of competitive adsorption between H+ and the metal ions for the active sites. At lower pH values, the high H+ concentration would intensify the competition and repulsion between H+ and the metal ions for the active sites on the surface of the biosorbent. At higher pH, the active sites passivated by H+ were released, and the adsorption was enhanced. The optimal pH value was 5.0 for Pb(II) and 5.6 for Cd(II).The adsorption equilibrium was investigated. The results in Fig. 7 show that the adsorption equilibrium was attained after 20 min for Cd(II) and 45 min for Pb(II). During this short contact time, the adsorption was very fast due to the presence of numerous active sites on the adsorbent surface. The adsorption effect was not significantly improved after the equilibrium time because the active sites were almost occupied by the metal ions on the surface of the adsorbent. However, the adsorption rate still had a small increase. This indicated that some of the metal ions were instantly adsorbed and after further mixing, new adsorption sites became available possibly due to the diffusion of metal ions inside the pores of the cellulosic material.
Adsorption kinetic study
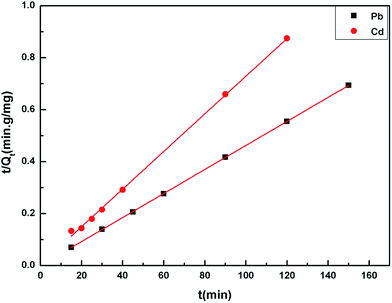
The adsorption kinetic experimental results for Pb(II) and Cd(II) are illustrated in Fig. 8. The pseudo second-order model was adopted to investigate the kinetic mechanism. The correlation coefficients (R2) for Pb(II) and Cd(II) were both larger than 0.99, which indicated that this model can depict the adsorption processes well. In addition, the results also suggest that the adsorption process was chemical adsorption. Table 2 shows the results of the different fitting models. The practical value (Qe-exp) was consistent with the theoretical value (Qe-model). The pseudo first-order model and pseudo second-order model equations are as follows:22| Qt = Qe(1 − e−K1t) | (3) |
 | (4) |
| Kinetic model | Parameter | Value | R2 | ||
|---|---|---|---|---|---|
| Pb(II) | Cd(II) | Pb(II) | Cd(II) | ||
| Pseudo-first-order | K1 | 0.2879 | 0.1350 | 0.3893 | 0.5709 |
| Qe | 216.2304 | 139.5909 | |||
| Pseudo-second-order | K2 | 0.2100 | 0.0102 | 0.9999 | 0.9995 |
| Qe | 217.3913 | 138.8888 | |||
Adsorption isotherms study
Adsorption isotherms, which describe how an adsorbate interacts with the adsorbent are critical for optimizing the application of an adsorbent. The adsorption process was fitted by the Langmuir, Freundlich and Temkin models. The Langmuir isotherm model describes a type of ideal monolayer adsorption and has some assumptions; for example, the active sites are uniformly distributed, the adsorbate molecules are very small compared with the active sites and the interactions between the adsorbed molecules and adsorbent are homogeneous. The Langmuir isotherm is widely applied in physical adsorption and chemical adsorption processes. It can be expressed by eqn (5) and can be rearranged to obtain its linearized form, as shown in eqn (6).
 | (5) |
 | (6) |
However, for non-ideal adsorption phenomenon, the Langmuir model is usually too simple to describe11 because the surface active sites of non-ideal adsorption are not evenly distributed, and the interactions between the adsorbent and adsorbate are uneven. For the Freundlich isotherm model, the heterogeneous absorptive energies are considered on the surface of the absorbent and describe the adsorption on a homogeneous surface using a multi-layer adsorption mechanism. The Freundlich isotherm model is described by eqn (7) and can be rearranged to obtain its linearized form, as shown in eqn (8).
 | (7) |
 | (8) |
Moreover, in the Tempkin model of adsorption and the adsorbent–adsorbate interactions on the adsorption isotherms were studied by Tempkin and Pyzhev, who suggested that because of these interactions, the energy of adsorption of all the molecules decreases linearly with coverage. The Temkin isotherm is represented by following equation:
Qe = B![[thin space (1/6-em)]](https://www.rsc.org/images/entities/char_2009.gif) ln ln![[thin space (1/6-em)]](https://www.rsc.org/images/entities/char_2009.gif) A + B A + B![[thin space (1/6-em)]](https://www.rsc.org/images/entities/char_2009.gif) ln ln![[thin space (1/6-em)]](https://www.rsc.org/images/entities/char_2009.gif) Ce Ce
| (9) |
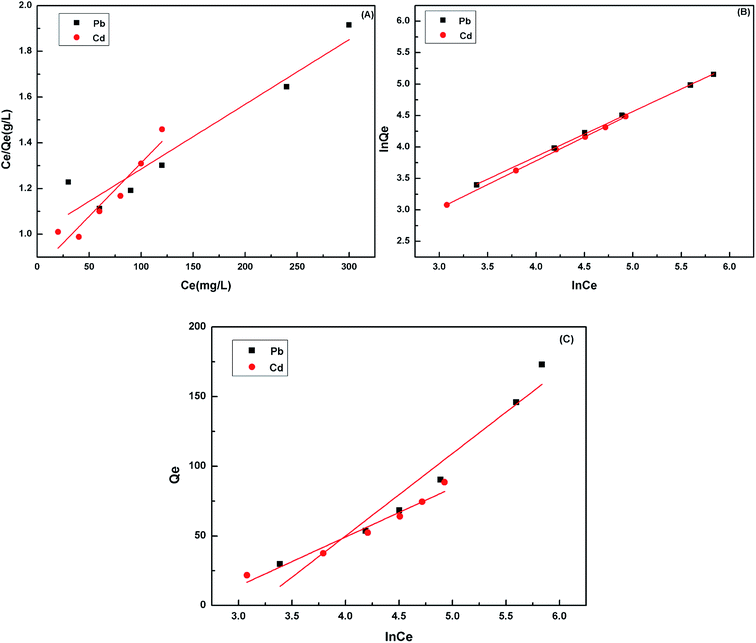
The linearized plots of Ce/Qe versus Ce and ln![[thin space (1/6-em)]](https://www.rsc.org/images/entities/char_2009.gif) Qe versus ln
Qe versus ln![[thin space (1/6-em)]](https://www.rsc.org/images/entities/char_2009.gif) Ce were obtained from the models and are shown in Fig. 9. The parameters Qm, KL, n and KF, and A and B are given in Table 3. The degrees of freedom for the two models were both four. The correlation coefficient was comparable. The correlation coefficient indicated that the Freundlich mode (R2 > 0.999) could explain the adsorption process for the Cd(II) and Pb(II) ions better. The sum of the squared residuals was smaller, and hence the fitting effect was better. The residual sum of squares in the Freundlich model was smaller than that in the Langmuir model, which also indicated that the former was more appropriate. For a further explanation, it is necessary to consider the coordination chemistry of the ligand groups contained in the adsorbent. During the chelation process, a metal ion forms a coordination bond with the electron pair of the negatively charged oxygen atom in the carboxylate groups to satisfy its primary valence as well as with the unshared electron pair of the nitrogen atom in the polyamine to satisfy its secondary valence.
Ce were obtained from the models and are shown in Fig. 9. The parameters Qm, KL, n and KF, and A and B are given in Table 3. The degrees of freedom for the two models were both four. The correlation coefficient was comparable. The correlation coefficient indicated that the Freundlich mode (R2 > 0.999) could explain the adsorption process for the Cd(II) and Pb(II) ions better. The sum of the squared residuals was smaller, and hence the fitting effect was better. The residual sum of squares in the Freundlich model was smaller than that in the Langmuir model, which also indicated that the former was more appropriate. For a further explanation, it is necessary to consider the coordination chemistry of the ligand groups contained in the adsorbent. During the chelation process, a metal ion forms a coordination bond with the electron pair of the negatively charged oxygen atom in the carboxylate groups to satisfy its primary valence as well as with the unshared electron pair of the nitrogen atom in the polyamine to satisfy its secondary valence.
| Isotherm model | Parameter | Value | R2 | ||
|---|---|---|---|---|---|
| Pb(II) | Cd(II) | Pb(II) | Cd(II) | ||
| Langmuir | KL | 0.0028 | 0.0054 | 0.9113 | 0.9000 |
| Qm | 357.14 | 217.39 | |||
| Freundlich | KF | 4.0386 | 3.7558 | 0.9994 | 0.9995 |
| n | 1.3959 | 1.3233 | |||
| Temkin | B | 59.251 | 35.287 | 0.93475 | 0.9516 |
| A | 0.0426 | 0.0740 | |||
The adsorption capacities of cell 5 on Pb(II) and Cd(II) calculated using the Langmuir model were 357.14 and 217.39 mg g−1 at 298 K, respectively (Table 3), all of which were much higher than those of raw microcrystalline cellulose (27.0 and 16.0 mg g−1). Interestingly, the Qmax towards Pb(II) was higher than Cd(II), which was due to the fact that the lower hydration energy of Pb(II) could help the ions react with the activated sites of the biosorbent.
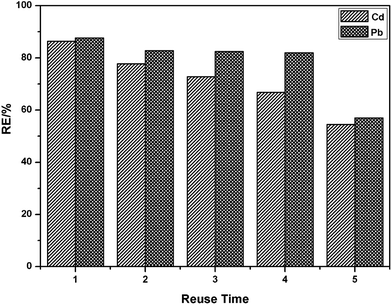
The reusability of an adsorbent is one of the most important parameters for its practical application. Desorption experiments were also conducted using the bath method. The adsorption–desorption cycle of PEI/SA-MCCMV was repeated five times, and the results are shown in Fig. 10. It can be seen that PEI/SA-MCCMV retains a good adsorption performance (56% removal efficiency of Pb(II), 54% removal efficiency of Cd(II)) after five recycles.
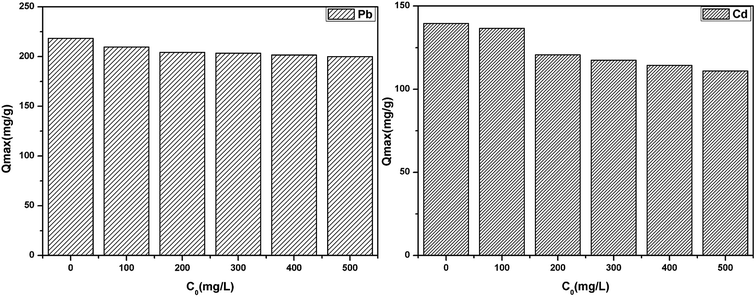
The effect of common co-existing ions (K(I), Na(I), Ca(II) and Mg(II)) on the adsorption of Pb(II) and Cd(II) was investigated by maintaining the concentration of Pb(II) and Cd(II) and each of the co-existing ions concentration ranged from 0 to 500 mg L−1, as shown in Fig. 11. It was clear that the co-existing ions exhibited a slight competition for the active sites due to the high affinity between the co-existing ions and the active sites. The active sites of the adsorbent surface are limited, which results in the competitive adsorption.
In addition, comparative experiments between PEI/SA-MCCMV and other previously reported adsorbents were investigated to illustrate the excellent adsorption performance of PEI/SA-MCCMV, as shown in Table 4. The results indicate that the maximum adsorption capacities of PEI/SA-MCCMV for Pb(II) and Cd(II) were significantly higher those reported for the other previously reported adsorbents. The simple synthesis method and efficient removal efficiency will lead to a broad range of potential applications.
Adsorption mechanism
According to the aforementioned results, the enhanced metal ion adsorption capacity of PEI/SA-MCCMV may be attributed to the introduction of –NH2 and –COOH groups on the cellulose surface, and the main mechanism for Cd(II) and Pb(II) removal is chelating adsorption. The amino groups are mainly responsible for the uptake of metal ions as follows:25| M2+ + RNH2+ → M (RNH2)2+ | (10) |
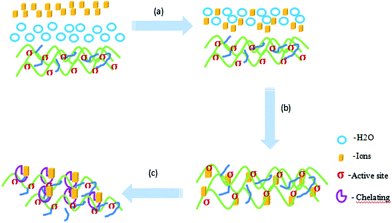
In consideration of the main existing forms of these heavy metal ions in an aqueous solution, the probable adsorption mechanism can be expressed in three steps26,27 (Liu, 2015a; Liu, 2015b), as shown in Fig. 12: (a) the adsorbate molecule Mn+ in the bulk fluid phase diffuses (through the solvent or mixture) to the external surfaces of the solid matrices; (b) the adsorbate molecule Mn+ diffuses through the internal pores of the solid matrix, reaching the ‘‘active centre’’ σ on the solid material becoming attached or ‘‘fixed’’ on the solid material through electrostatic adsorption and (c) the adsorbate molecule Mn+ and adsorption groups on the active site form a stable adsorption through chelation. To illustrate the adsorption process for a qualitative description, Fig. 12 exemplifies the steps in the adsorption process. The action of a free adsorbate molecule Mn+ in the fluid phase becoming ‘‘fixed’’ on the solid surface is called adsorption. The kinetics of adsorption is thus controlled by both the mass transport (of the adsorbate to the active center) and the “attachment’’ (adsorption).
Conclusions
An amino modified cellulose adsorbent for heavy metals was pretreated using a very fast and environmentally-friendly method. The kinetic study demonstrated that the kinetic mechanism for the adsorption of metal ions followed the pseudo-second-order model, which provided the best correlation with the experimental data. The adsorption behavior of PEI/SA-MCCMV was fitted better with the Freundlich isotherm model (R2 > 0.99) with a remarkably higher adsorption capacity. The mechanism studies confirmed that the adsorption process of heavy metal ions was a chelating process.Acknowledgements
This project was sponsored by the Guangxi Youth Natural Science Fund (GXNSFBA053025), the National High Technology Research and Development Program (“863”Program) of China (2009AA06A416), the National Natural Science Foundation of China (51108261), the Guangxi Science and Technology Research Program (14251009), and the Natural Science Foundation of Guangxi (2013GXNSFFA019005).References
- L. Lü, L. Chen, W. Shao and F. Luo, J. Chem. Eng. Data, 2010, 55, 4147–4153 CrossRef.
- D. W. O'Connell, C. Birkinshaw and T. F. O'Dwyer, Bioresour. Technol., 2008, 99, 6709–6724 CrossRef PubMed.
- B. Qiu, C. Xu, D. Sun, H. Yi, J. Guo, X. Zhang, H. Qu, M. Guerrero, X. Wang and N. Noel, ACS Sustainable Chem. Eng., 2014, 2, 2070–2080 CrossRef CAS.
- T. Hartman, J. Sturala and R. Cibulka, Adv. Synth. Catal., 2015, 47, 3573–3586 CrossRef.
- R. A. Sheldon, Catal. Today, 2015, 247, 4–13 CrossRef CAS.
- J. Ni, H. Na, Z. She, J. Wang, W. Xue and J. Zhu, Bioresour. Technol., 2014, 167, 69 CrossRef CAS PubMed.
- V. K. Tyagi and S. L. Lo, Renewable Sustainable Energy Rev., 2013, 18, 288 CrossRef CAS.
- J. Ni, N. Teng, H. Chen, J. Wang, J. Zhu and H. Na, Bioresour. Technol., 2015, 191, 229–233 CrossRef CAS PubMed.
- M. Hashem, M. A. Taleb, F. N. El-Shall and K. Haggag, Carbohydr. Polym., 2014, 103, 385–391 CrossRef CAS PubMed.
- H. Liimatainen, J. Sirviö, A. Haapala, O. Hormi and J. Niinimäki, Carbohydr. Polym., 2011, 83, 2005–2010 CrossRef CAS.
- S. Hokkanen, E. Repo, T. Suopajärvi, H. Liimatainen, J. Niinimaa and M. Sillanpää, Cellulose, 2014, 21, 1471–1487 CrossRef CAS.
- J. Su, H. Zhu, L. Wang, X. Liu, S. Nie and J. Xiong, BioResources, 2016, 11, 7416–7430 CrossRef CAS.
- L. V. A. Gurgel, R. P. d. Freitas and L. F. Gil, Carbohydr. Polym., 2008, 74, 922–929 CrossRef CAS.
- L. V. Gurgel, O. K. Junior, R. P. Gil and L. F. Gil, Bioresour. Technol., 2008, 99, 3077–3083 CrossRef CAS PubMed.
- S. Hokkanen, E. Repo and M. Sillanpä, Chem. Eng. J., 2013, 223, 40–47 CrossRef CAS.
- W. Y. Li, A. X. Jin, C. F. Liu, R. C. Sun, A. P. Zhang and J. F. Kennedy, Carbohydr. Polym., 2009, 78, 389–395 CrossRef CAS.
- Z. Du, T. Zheng, P. Wang, L. Hao and Y. Wang, Bioresour. Technol., 2016, 201, 41–49 CrossRef CAS PubMed.
- L. V. A. Gurgel and L. F. Gil, Carbohydr. Polym., 2009, 77, 142–149 CrossRef CAS.
- T. S. Anirudhan, T. A. Rauf and S. R. Rejeena, Desalination, 2012, 285, 277–284 CrossRef CAS.
- H. He, X. Hou, B. Ma, L. Zhuang, C. Li, S. He and S. Chen, Cellulose, 2016, 23, 2539–2548 CrossRef CAS.
- B. Qiu, G. Jiang, Z. Xi, D. Sun, H. Gu, W. Qiang, H. Wang, X. Wang, Z. Xin and B. L. Weeks, ACS Appl. Mater. Interfaces, 2014, 6, 19816–19824 CAS.
- A. Roy, S. Chakraborty, S. P. Kundu, B. Adhikari and S. B. Majumder, Ind. Eng. Chem. Res., 2012, 51, 12095–12106 CrossRef CAS.
- G. Zhang, R. Qu, C. Sun, C. Ji, C. Hou, C. Wang and Y. Niu, J. Appl. Polym. Sci., 2008, 110, 2321–2327 CrossRef CAS.
- M. D. Meitei and M. N. V. Prasad, J. Environ. Chem. Eng., 2013, 1, 200–207 CrossRef CAS.
- E. Repo, J. K. Warchol, T. A. Kurniawan and M. E. T. Sillanpää, Chem. Eng. J., 2010, 161, 73–82 CrossRef CAS.
- S. Liu, J. Colloid Interface Sci., 2015, 450, 224–238 CrossRef CAS PubMed.
- S. Liu, Sep. Purif. Technol., 2015, 144, 80–89 CrossRef CAS.
| This journal is © The Royal Society of Chemistry 2017 |

