 Open Access Article
A graphene oxide surface–molecularly imprinted polymer as a dispersive solid-phase extraction adsorbent for the determination of cefadroxil in water samples
Xinwei Chen and
Nengsheng Ye *
*
Department of Chemistry, Capital Normal University, Beijing 100048, P. R. China. E-mail: yensh@cnu.edu.cn
First published on 6th July 2017
Abstract
In this work, a graphene oxide (GO)–functionalized molecularly imprinted polymer (MIP) (GO–MIPs) was prepared using a non-covalent molecular imprinting approach and applied to dispersive solid-phase extraction (DSPE) coupled with ultra-high-performance liquid chromatography with photodiode array detection (UPLC-PDA) to sensitively detect cefadroxil (FAD) in aqueous solution. FAD was used as a template to synthesize GO–MIPs, with 2-(trifluoromethyl) acrylic acid (TFMAA) and ethylene glycol dimethacrylate (EGDMA) as the monomer and cross-linker, respectively, in methanol. The GO–MIPs was eluted with acetic acid–methanol (20/80, v/v) and then characterized by scanning electron microscopy (SEM), transmission electron microscopy (TEM), thermal gravimetric analysis (TGA) and Raman spectroscopy. The selectivity of the GO–MIPs versus a graphene oxide–functionalized non-imprinted polymer (GO–NIPs) was confirmed based on the selectivity factors (SFs) using cefixime, cefoxitin sodium and ceftiofur hydrochloride as structural analogues of FAD. The efficiency of the synthesized GO–MIPs was evaluated through application of the proposed DSPE procedure. The influencing factors of DSPE, such as the sample pH, extraction time, desorption reagents and desorption time, were optimized, and the analytical performance of the developed DSPE-UPLC-PDA method was evaluated under the optimized conditions. Good linearity was obtained over 0.04–6.0 μg mL−1 (R2 = 0.9979), with a detection limit (S/N = 3) of 0.01 μg mL−1. Finally, the developed method was applied to determine the concentration of FAD in water samples, and the spiked average recoveries ranged between 72.5% and 104.8%. The GO–MIPs served as good carriers for the selective adsorption of FAD and showed promise for the preconcentration of FAD in complex samples.
1. Introduction
Consumers have recently shown increasing awareness of food safety. Public control agencies and the food industry work to ensure high levels of control of food for human consumption. Among man-made contaminants, antibiotics are of particular concern because of the development of antibiotic resistance, which has long been attributed to their overuse in human medicine and recently to their use in animal breeding with possible contamination of foodstuffs.1 Therefore, antibiotic residues are frequently monitored in a wide range of sample matrices, such as foodstuffs and their surroundings.The term antibiotic refers to a diverse range of chemical substances that possess antibacterial activity and can be either broad or narrow spectrum.2 β-Lactam antibiotics constitute one of the most widely used antimicrobial drugs in veterinary medicine, especially in the treatment and prevention of bacterial infections (respiratory, urinary, mammary gland and skin infections) in dairy cattle. This group of antibiotics can be classified into several groups according to their structural characteristics: penicillins, cephalosporins, and, more recently, carbapenems.3 Among these antibiotics, cephalosporins are generally unstable in solution and in the solid state.4 Cephalosporins are frequently used to treat infections caused by Gram-positive and Gram-negative bacteria. Because cephalosporins with a β-lactam ring interfere with the synthesis of the bacterial cell wall, they are one of the most effective antimicrobial agents.5,6 In fact, these cephalosporins have been used in livestock farming as prophylactic and therapeutic agents and as feed additives for growth promotion.7 At the same time, cephalosporin residues pose a risk to human health because they can cause allergic reactions in hypersensitive individuals and can lead to the emergence of drug-resistant bacteria. Moreover, cephalosporins are the most prescribed for example cefadroxil, cefixime, cefoxitin and so on.8,9 To probe the potential benefits and adverse effects of cephalosporin consumption more efficiently, a suitable sample pretreatment method is necessary to decrease matrix interferences and facilitate the detection of cephalosporins at trace levels. Dispersive solid-phase extraction (DSPE) is based on SPE methodology, but the sorbent is added directly to the sample solution, followed by centrifugation after extraction.10,11 Compared with conventional SPE methods,12 the main advantage of DSPE is the effective increase in active surface area between the analytes and sorbent. Thus, a novel molecularly imprinted polymer (MIPs) with a graphene oxide (GO)–functionalized surface was synthesized as an adsorbent for coupling with DSPE to preconcentrate cefadroxil (FAD). The advantage of GO–MIPs particles is to demonstrate the good ability for specific selective extraction of FAD in environmental water samples.
Graphene reportedly possesses a high theoretical specific surface area (2630 m2 g−1), which suggests a high sorption capacity. In addition to graphene, GO, a two-dimensional monolayer of carbon atoms arranged in a honeycomb lattice has attracted much attention in recent years because of its ultrahigh specific surface area.13,14 GO, a precursor to graphene after reduction, contains a range of reactive hydroxyl, carboxyl, and epoxide functional groups on its basal plane, making it a good candidate for use in chemical functionalization reactions,15,16 including the synthesis of MIPs on the surface of GO.17,18 Moreover, GO sheets can greatly improve the chemical and physical properties when incorporated in composite materials.19,20 Due to its ultrahigh surface area and excellent chemical properties, GO has been explored as a supporting material of adsorbents (MIPs) for the preconcentration of small molecules.17,21
Molecular imprinting is a new molecular recognition technology that, compared with natural receptors, not only offers specific molecular recognition sites for molecular targets but also has distinct advantages such as high chemical stability, easy and inexpensive preparation, and potential reusability.22,23 Molecular imprinting has been widely recognized as a potential technique for the synthesis of tailor-made recognition materials through the formation of a polymer network around a template molecule. Owing to these fantastic properties, MIPs have been widely used in the fields of biosensors, chromatographic separation, catalysis, drug delivery and SPE.24–26 MIPs, which are synthetic polymers that enable simultaneous pretreatment and enrichment, exhibit high selectivity for and specific recognition of a given analyte or a group of structurally related species. MIPs are often coupled with SPE as molecularly imprinted SPE (MISPE), which has high selectivity and specificity and a strong separation capacity.27 Because of its higher chemical stability and selectivity and more facile preparation, MISPE has been widely applied in food analysis,28,29 biochemical analysis,30,31 environmental analysis,32 etc. Although MIPs have unique advantages, challenges involving the imperfect removal of template molecules and recognition site destruction remain after polymerization.33 Therefore, surface imprinting has emerged to overcome such drawbacks, in which recognition sites are formed on the material surface.34 Some studies have reported molecular imprinting methods that utilize the surface of support substrates, including GO and nano-alumina etc.35 The imprinted film prepared on the surface of GO via imprinting can enable the rebinding and extraction of the template molecules, increase the response kinetics, and improve access to the surface binding sites.36
The present study built upon our previous research to prepare a surface-imprinted polymer through the self-polymerization of FAD on the surface of GO.18 GO–MIPs–DSPE combined with ultra-high-performance liquid chromatography (UPLC) was used for the preconcentration and determination of FAD. The morphology of the surface-imprinted polymer was characterized using several techniques. The chromatographic conditions were successfully optimized using a gradient elution method. The DSPE optimization and analyte stability are also discussed, and the accuracy and precision of the UPLC analysis and method detection limits are described. The GO–MIPs–DSPE–UPLC method was validated using river and tap water samples.
2. Experimental
2.1 Reagents and materials
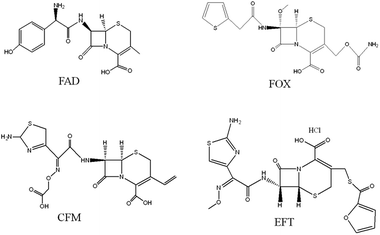
GO was purchased from XFNano Materials Tech. Co., Ltd. (Nanjing, China). FAD, cefixime (CFM), cefoxitin sodium (FOX), ceftiofur hydrochloride (EFT) (chemical structures shown in Fig. 1) ethylene glycol dimethacrylate (EGDMA) and 2-(trifluoromethyl) acrylic acid (TFMAA) were obtained from Sigma-Aldrich (Shanghai, China). N,N-Dimethyl formamide (DMF) and acetic acid were purchased from the Beijing Chemical Plant (Beijing, China). 2,2-Azobisisobutyronitrile (AIBN) was supplied by the Aladdin Reagent Co., Ltd. (Shanghai, China). Deionized water (18.2 MΩ) was obtained from a Milli-Q system (Billerica, MA. USA). All other reagents were of analytical grade and used without further purification. All solutions were filtered through filters with a 0.22 μm pore size (Tianjin, China). Chromatographic-grade methanol, acetonitrile and acetone were purchased from Merck Co. (Darmstadt, Germany).To prepare the surfactant-stabilized GO dispersions, 120.0 mg of GO was sonicated in 40 mL of DMF for 2 h, after which the GO was evenly dispersed in the DMF at a concentration of 3.0 mg mL−1 GO.
2.2 Instruments and chromatographic conditions
All the chromatographic analyses were performed on a Waters Acquity UPLC™ system with a quaternary solvent manager, a sample manager and a photodiode array (PDA) detector. A Waters UPLC BEH C18 column (50 mm × 2.1 mm i.d., 1.7 μm) was used as the analytical column. System control and chromatographic data acquisition were carried out using Empower software (Waters Technologies, USA). Gradient elution was performed with acetonitrile (solvent A) and a sodium acetate–acetic acid (NaAC–HAC) buffer solution (pH = 3.4, solvent B). The elution program was as follows: 0.0–2.5 min, solvent A/solvent B (5/95, v/v); 2.5–3.0 min, solvent A/solvent B (25/75, v/v); and 3.0–5.0 min, solvent A/solvent B (5/95, v/v). The flow rate, injection volume, and UV wavelength were 0.45 mL min−1, 10 μL, and 270 nm, respectively. All of the mobile phases were filtered through a 0.22 μm filter membrane and degassed for 30 min before use. The centrifuge was purchased from Sigma (3K15, Germany), and centrifugation was performed at 25 °C.Scanning electron microscopy (SEM) images were obtained using an S-4800 field scanning electron microscope (Hitachi, Japan) operating at 15 kV. Transmission electron microscopy (TEM) images were obtained using a JEM 1200 EX transmission electron microscope (JEOL, Japan). Nitrogen adsorption/desorption isotherms images were measured by MicroActive for ASAP 2460 (Micromeritics, USA). Raman spectra were collected using a Raman spectrometer (Renishaw, UK) with a 633 nm excitation wavelength. Thermal gravimetric analysis (TGA) was conducted on an HCT-1 instrument (Beijing Henven Scientific Instrument Factory, Beijing) from room temperature to 800 °C at a heating rate of 10 °C min−1 under nitrogen flow.
2.3 Preparation of stock solutions and real samples
Stock solutions of FOX, CFM, FAD and EFT were prepared in acetonitrile and stored at 4 °C until use. Working solutions of different concentrations were freshly prepared by appropriate dilution of the stock solution with deionized water. River water samples were collected from the Huaisha River (Beijing, China), and tap water samples were collected from a water tap in our laboratory (Beijing, China). The water samples were filtered through a 0.22 μm filter before use without any additional pretreatment. After filtration through a 0.22 μm membrane filter, the sample solution was subjected to GO–MIPs–DSPE–UPLC.2.4 Synthesis of GO–MIPs
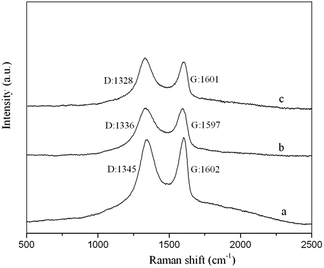
GO–MIPs were prepared by the non-covalent approach according to the developed strategy, with slight modifications. A MIPs was prepared using FAD as the template molecule and TFMAA as the functional monomer by adding 1 mmol of FAD and 4 mmol of TFMAA to 5 mL of methanol. After the FAD had completely dissolved, 20 mL of a GO dispersion (3 mg mL−1), 20 mmol of the cross-linking agent EGDMA and 40 mg of the initiator AIBN were added. The mixture was degassed by sonication for 10 min and then bubbled with nitrogen for 10 min. Degassing and bubbling were repeated three times. Next, the temperature was held at 60 °C for 24 h for polymerization. Polymerization occurred via non-covalent binding, including ionic interactions, hydrogen bonds, and π–π stacking, making preparation of the FAD GO–MIPs possible (schematic of the GO–functionalized MIPs procedure is shown in Fig. 2). The effective charge transfer between the template monomer and GO agreed with the Raman spectral analysis. After the reaction, the bulk GO–MIPs were ground to obtain a suitable size range of the GO–MIPs particles with different size ranges (20–80 μm, 80–100 μm and 100–140 μm). The resulting particles were washed with acetic acid–methanol (20/80, v/v) until FAD was no longer detected in the eluent by UPLC-PDA. The particles were then washed with distilled water and dried to a constant weight at 60 °C.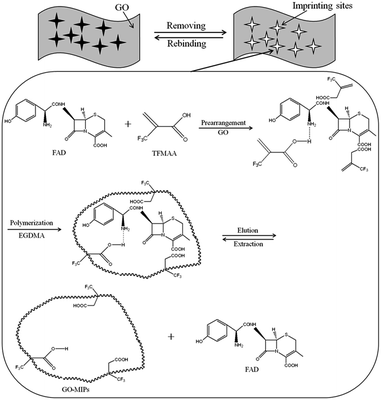 | ||
| Fig. 2 Illustration of the preparation of graphene oxide functionalized surface–imprinted polymer (GO–MIPs). | ||
Reference GO–functionalized-non-imprinted polymers (GO–NIPs) were prepared using the same procedure but without the addition FAD as the template during polymerization.
2.5 Dispersive solid-phase extraction
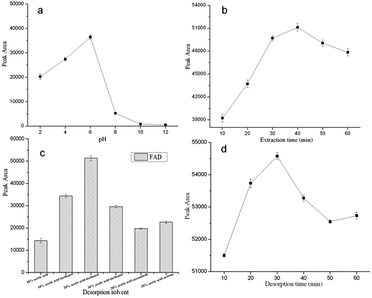
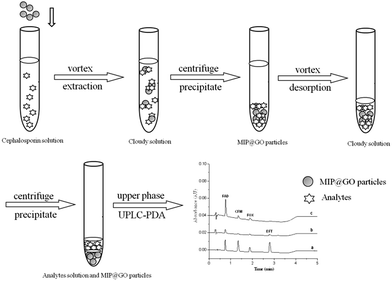
Ten milliliter samples spiked with 1 μg mL−1 FAD, CFM, FOX and EFT were adjusted to pH 6.0 and transferred to a centrifuge tube containing 100 mg of GO–MIPs particles. The mixture was extracted for 40 min under agitation at 1500 rpm and subsequently centrifuged for 5 min at 6000 rpm. The upper phase was discarded. Then, the mixture was desorbed for 30 min by 1 mL of acetic acid–methanol (20/80, v/v) under agitation at 1500 rpm and centrifuged for 5 min at 6000 rpm. Finally, acetic acid–methanol layer was filtered through a 0.22 μm filter membrane and analyzed by UPLC-PDA. The whole extraction process is shown in Fig. 3.3. Results and discussion
3.1 Characterization of GO, GO–NIPs and GO–MIPs
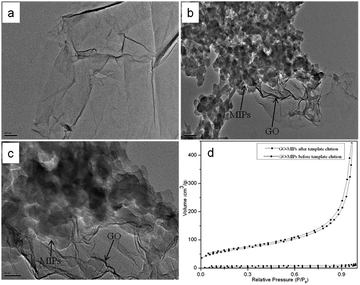
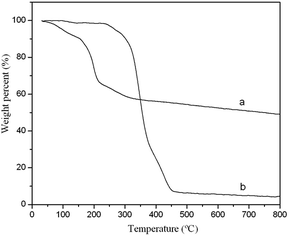
In this research, GO–MIPs and GO–NIPs were synthesized on the surface of GO. GO–MIPs with different size ranges were obtained, and GO–MIPs particles in the size range of 80–100 μm were chosen for the further study because of its higher adsorption capability. These materials were characterized with SEM, TEM, TGA and Raman spectroscopy.The morphological structure of GO and the GO–MIPs was examined by TEM. From the TEM image in Fig. 5a, GO was very thin and contained some wrinkles, similar to wrinkled paper. These wrinkles may be important for preventing the aggregation of GO and maintaining a high surface area.37 As observed in Fig. 5b and c, the approximate GO sheets were decorated by the MIPs, which indicated that the imprinted sites were generated in the GO–MIPs hybrid and that the GO–MIPs particles had been successfully synthesized.
3.2 Optimization of DSPE conditions
In order to select the optimal DSPE conditions for the extraction of the cefadroxil, 100 mg GO–MIPs particles and a series of sample solutions spiked with 1.0 μg mL−1 standard mixture were used to study the extraction performance of the DSPE under different experimental conditions. In this experiment, several parameters, including the sample pH, extraction time, and desorption conditions, were investigated to achieve the optimal extraction efficiency for FAD. All of the experiments were performed in triplicate, and the means of the results were used in the optimization evaluation.3.3 Comparison of GO–NIPs and GO–MIPs
In this work, the GO–NIPs and GO–MIPs particles were used separately to extract a 1.0 μg mL−1 standard solution mixture via the proposed DSPE laboratory procedure, and the results are compared in Fig. 9. As shown in the figure, the four target analytes were slightly but clearly detected without any preparation (curve a) but were almost not detected when using the proposed DSPE procedure with the GO (curve b) and GO–NIPs particles (curve c). Compared with the GO–NIPs particles, the FAD peak area increased and the GO–MIPs particles exhibited advantages in the extraction process after the GO–MIPs–DSPE procedure (curve d). The comparison indicates that the GO–MIPs particles exhibited better selective extraction than the GO–NIPs particles. The matching pore size and recognition sites of the GO–MIPs improved the extraction selectivity for the target FAD. However, its enrichment effect is less obvious, which may be due to GO–MIPs particles on the surface of the formation of three-dimensional cavity is not too much. Non-specific adsorption was dominant for the GO–NIPs. Because the molecular structures of the other three cephalosporins were substantially different from the structure of FAD, these three cephalosporins were less recognized by the GO–MIPs particles with FAD as the template, decreasing the extraction selectivity for these three cephalosporins.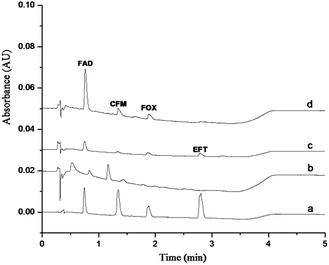 | ||
| Fig. 9 Chromatogram of a 1 μg mL−1 standard solution injected directly (a), treated by GO–DSPE (b), GO–NIPs–DSPE (c), and GO–MIPs–DSPE method (d). | ||
3.4 Selectivity of the GO–MIPs
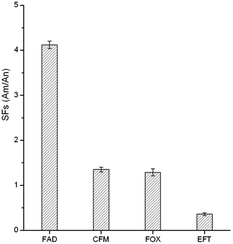
To evaluate the selectivity of the GO–MIPs particles for the target FAD molecule, CFM, FOX, and EFT were chosen for comparison due to their modalities, structural similarities and coexistence with FAD in real samples. The selectivity was calculated using the selectivity factors (SFs): SFs = AM/AN, where AM and AN are the peak areas obtained using the GO–MIPs and GO–NIPs particles treatments, respectively. As observed in Fig. 10, the GO–MIPs particles exhibited the highest SFs for FAD, with an average value of 4.12 and a relative standard deviation (RSD) of 8.2% (n = 3), whereas the average SFs for CFM, FOX and EFT were 1.35 (RSD = 4.8%, n = 3), 1.29 (RSD = 8.3%, n = 3), and 0.36 (RSD = 3.2%, n = 3), respectively. The different selectivity may be due to the combination of hydrogen bond, electrostatic interaction, π–π stacking interaction, and distinct stereo-selectivity. The extraction selectivity for FAD of the GO–MIPs particles was clearly better than that for other three cephalosporins, indicating that the GO–MIPs particles showed stable adsorption and a greater binding capacity for FAD. This increased capacity may have been attributable to the perfect fit of the shapes of the cavities in the polymers with the unique molecular structure of FAD. Thus, CFM, FOX and EFT cannot be adsorbed into the imprinted cavities via specific binding. These values, which are superior to unity, are proof of the specific interactions between FAD and the GO–MIPs particles. Therefore, the GO–MIPs particles showed good selectivity for the template molecule.3.5 Reusability of the GO–MIPs
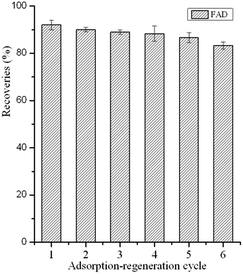
To investigate the reusability of the GO–MIPs particles, consecutive adsorption-regeneration cycles were performed with the same GO–MIPs particles. After each cycle, the GO–MIPs particles were consecutively regenerated with 15 mL of acetic acid–methanol (20/80, v/v) and 5 mL of methanol under vortex conditions. The substantial amounts of solvents were used to reduce carryover effects and interferences between each adsorption-regeneration process. The first desorption was used to investigate the carryover effects of the FAD. No FAD was detected. The GO–MIPs particles have been shown to be reusable up to 13 times. The first six adsorption-regeneration results are shown in Fig. 11. The results demonstrated that the GO–MIPs particles are stable and may become an ideal candidate for pretreatment of aqueous samples.3.6 Evaluation of the GO–MIPs–DSPE method
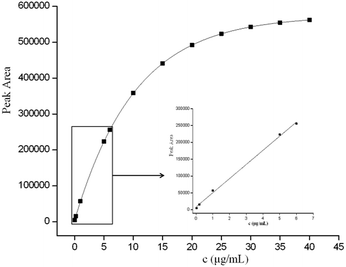
The performance of the optimized GO–MIPs–DSPE method was evaluated using UPLC-PDA. Quantitative parameters including the linear range, linear equations, correlation coefficients, limit of detection (LOD), and limit of quantification (LOQ) were evaluated for the extraction of FAD under the optimized extraction conditions. Calibration standard solutions of 0.04 μg mL−1 to 6.0 μg mL−1 were extracted using the GO–MIPs–DSPE method and analyzed by UPLC. A good linear relationship with a good correlation coefficient (R2 = 0.9979) was obtained. Moreover, the linear regression equation for FAD was y = 42061x + 8219, where y represents the peak area of FAD and x denotes the FAD concentration in the standard solution. The LOD and LOQ of FAD were determined in standard solutions to be 0.01 μg mL−1 and 0.03 μg mL−1, calculated as signal-to-noise ratios of 3 (S/N = 3) and 10 (S/N = 10), respectively. As shown in Fig. 12, as the concentration increased beyond the linear range, the peak areas slowly increased, indicating that the material had achieved saturation (maximum saturated adsorption amount is approximately 35 μg mL−1).40The precision of the GO–MIPs–DSPE–UPLC method was investigated by performing intra- and inter-day assays. The intra-assay precision was measured from six continuous injections performed on the same day, and the inter-day precision was calculated from measurements performed on three consecutive days. The RSD of the FAD peak area was 4.5% and 5.9% in the intra- and inter-assay precision assays, respectively. These data indicate that the proposed method is acceptable and stable for the selective extraction of FAD.
3.7 Real samples
To assess the accuracy of the established analytical method, real river and tap water samples were analyzed using the standard addition method. The filtered samples were spiked with cephalosporins at three different concentrations of 0.2 μg mL−1, 1.0 μg mL−1 and 5.0 μg mL−1 and were subsequently extracted using the optimized method.For the river water samples, the recoveries ranged from 79.6% to 104.8%, and the RSDs (n = 3) ranged from 4.9% to 10.1%. For the tap water samples, the recoveries ranged from 72.5% to 102.4%, and the RSDs (n = 3) ranged from 6.1% to 8.1% (Table 1). These satisfactory recoveries indicate negligible effects of coexisting species and matrix components in the environmental water samples.
| Analyte (FAD) | Real sample (μg mL−1) | Concentration added (μg mL−1) | Average recovery (%) | RSD (%) |
|---|---|---|---|---|
| River water | Not detected | 0.2 | 104.8 | 10.1 |
| 1.0 | 80.6 | 4.9 | ||
| 5.0 | 79.6 | 6.3 | ||
| 0.2 | 102.4 | 8.1 | ||
| Tap water | Not detected | 1.0 | 72.5 | 6.1 |
| 5.0 | 78.5 | 7.9 |
3.8 Comparison of the proposed method with previous reports
A comparison of the developed method with other methods for the extraction of FAD in water and other samples is presented in Table 2, which shows significant advantages of the proposed method in the extraction and determination of FAD from environmental water samples. A satisfactory linearity range, correlation coefficient, LOD, recovery and precision were obtained with the proposed GO–MIPs–DSPE–UPLC method compared to other methods.41–45 The GO–MIPs particles exhibited an excellent selective adsorption capacity. Thus, GO–MIPs particles-based DSPE could be used as a novel, simple and easy method for the effective extraction of analytes from complex matrices.| Sample | Sample preparation | Detection method | Linear range (μg mL−1, μg g−1) | R2 | LOD (μg mL−1, μg g−1) | Recovery (%) | RSD (%) | Ref. |
|---|---|---|---|---|---|---|---|---|
| a SPME solid-phase microextraction, MSPD matrix solid-phase dispersion extraction, HPLC-PDA high-performance liquid chromatography-photodiode array, HPLC-UV high-performance liquid chromatography-ultraviolet detection, SIA-PC sequential injection analysis-spectrophotometric, CZE-LIF capillary zone electrophoresis-laser-induced fluorescence detection. | ||||||||
| Milk | SPME | HPLC-PDA | 0.1–10 | 0.9995 | 0.02 | 83–92 | 5.5–8.3 | 37 |
| Human plasma | – | HPLC-UV | 0.5–30 | 0.9953 | 0.03 | 71–90.4 | 0.35–4.65 | 41 |
| Milk | MISPE | HPLC-UV | – | – | – | >60 | – | 28 |
| Milk | MSPD | HPLC-PDA | 0.0192–0.24 | 0.9984 | 0.0063 | 93.3–103.9 | 1.2–6.1 | 42 |
| Milk | MSPD | HPLC-UV | 0.0462–0.2 | 0.9916 | 0.0462 | 93.8–101.9 | 2.0–5.7 | 43 |
| Tablet | – | HPLC-UV | 15–90 | 0.9994 | 0.21 | 98.96–101.38 | 0.22–0.98 | 31 |
| Milk | SPE | HPLC-UV | 0.20–20.0 | 0.9907 | 0.08 | 95.0–101.4 | 1.5–3.1 | 12 |
| Water | – | SIA-PC | 1–10 | 0.9969 | 0.0178 | 100.2–101.7 | 0.57–1.98 | 44 |
| Water | SPE | CZE-LIF | 0.03–0.6 | 0.9990 | 0.0075 | 88.6–96.6 | 0.82–8.15 | 45 |
| Water | DSPE | UPLC-PDA | 0.04–6.0 | 0.9979 | 0.01 | 72.5–104.8 | 4.5–5.9 | This study |
4. Conclusions
In the current study, GO–MIPs particles were successfully synthesized for FAD extraction using a novel imprinting technique, and a DSPE method based on GO–MIPs particles combined with UPLC-PDA was developed for the determination of FAD in water samples. GO nanosheets are suitable supports for MIPs because of their high surface area and 2D layered structure with a variety of oxygen-containing groups. The GO–MIPs particles exhibited a high adsorption capacity, high selectivity, and rapid binding activity for FAD because of the combination of the large surface area of GO and the selectivity of the MIPs. Under the optimized conditions, this method demonstrated a low LOD and satisfactory repeatability but also exhibited certain disadvantages, such as a narrow linear range, because the material reached maximum adsorption. The synthesized GO–MIPs particles could be used for the separation and removal of FAD from environmental water samples. In conclusion, the newly developed method provides not only a simple, fast, accurate, reliable and sensitive analytical procedure but also a great potential adsorbent for the removal of FAD from more complex samples.Acknowledgements
This work was financially supported by the Beijing Natural Science Foundation (No. 2162008), the Beijing Municipal Science and Technology Commission (No. Z141100002614020) and the Importation and Development of High-Caliber Talents Project of Beijing Municipal Institutions (No. CIT&TCD 201504083).References
- D. Liu, N. Z. Song, W. Feng and Q. Jia, RSC Adv., 2016, 6, 11742–11748 RSC.
- E. N. Evaggelopoulou and V. F. Samanidou, Food Chem., 2013, 136, 1322–1329 CrossRef CAS PubMed.
- F. J. Lara, M. del Olmo-Iruela, C. Cruces-Blanco and C. Quesada-Molina, TrAC, Trends Anal. Chem., 2012, 38, 52–66 CrossRef CAS.
- A. M. Yehia, R. M. Arafa, S. S. Abbas and S. M. Amer, Spectrochim. Acta, Part A, 2016, 153, 231–240 CrossRef CAS PubMed.
- P. M. Shah, Int. J. Antimicrob. Agents, 2002, 19, 163–164 CrossRef CAS PubMed.
- J. D. Williams, K. G. Naber, A. Bryskier, N. Høiby, I. M. Gould, P. Periti, H. Giamarellou and B. Rouveix, Int. J. Antimicrob. Agents, 2001, 17, 443–450 CrossRef CAS PubMed.
- S. A. E. Kools, J. F. Moltmann and T. Knacker, Regul. Toxicol. Pharmacol., 2008, 50, 59–65 CrossRef CAS PubMed.
- S. Cox, A. Martin, M. Hamill, N. Pistole, J. Steeil and J. Schumacher, Biomed. Chromatogr., 2014, 28, 1126–1130 CrossRef CAS PubMed.
- R. Pérez-Burgos, E. M. Grzelak, G. Gokce, J. Saurina, J. Barbosa and D. Barron, J. Chromatogr. B: Biomed. Sci. Appl., 2012, 899, 57–65 CrossRef PubMed.
- W. H. Lu, W. N. Ming, X. S. Zhang and L. X. Chen, Electrophoresis, 2016, 37, 2487–2495 CrossRef CAS PubMed.
- X. Q. Wu, X. Y. Wang, W. H. Lu, X. R. Wang, J. H. Li, H. Y. You, H. Xiong and L. X. Chen, J. Chromatogr. A, 2016, 1435, 30–38 CrossRef CAS PubMed.
- W. Liu, Z. J. Zhang and Z. Q. Liu, Anal. Chim. Acta, 2007, 592, 187–192 CrossRef CAS PubMed.
- K. S. Kim, Y. Zhao, H. Jang, S. Y. Lee, J. M. Kim, K. S. Kim, J. H. Ahn, P. Kim, J. Y. Choi and B. H. Hong, Nature, 2009, 457, 706–710 CrossRef CAS PubMed.
- J. L. Shen, X. Xin, Y. J. Zhang, L. F. Song, L. Wang, W. Y. Tang and Y. J. Ren, Carbohydr. Polym., 2015, 117, 592–599 CrossRef CAS PubMed.
- S. Stankovich, D. A. Dikin, G. H. Dommett, K. M. Kohlhaas, E. J. Zimney, E. A. Stach, R. D. Piner, S. T. Nguyen and R. S. Ruoff, Nature, 2006, 442, 282–286 CrossRef CAS PubMed.
- Y. Y. Wen, Z. L. Niu, Y. L. Ma, J. P. Ma and L. X. Chen, J. Chromatogr. A, 2014, 1368, 18–25 CrossRef CAS PubMed.
- R. Z. Wang, D. L. Huang, Y. G. Liu, Z. W. Peng, G. M. Zeng, C. Lai, P. Xu, C. Huang, C. Zhang and X. M. Gong, RSC Adv., 2016, 6, 106201–106210 RSC.
- N. S. Ye and J. Li, J. Sep. Sci., 2014, 37, 2239–2247 CrossRef CAS PubMed.
- H. M. Qiu, C. N. Luo, M. Sun, F. G. Lu, L. L. Fan and X. J. Li, Carbon, 2012, 50, 4052–4060 CrossRef CAS.
- M. Y. Yen, M. C. Hisao, S. H. Liao, P. I. Liu, H. M. Tsai and C. C. M. Ma, Carbon, 2011, 49, 3597–3606 CrossRef CAS.
- C. Y. Shi, J. R. Meng and C. H. Deng, J. Mater. Chem., 2012, 22, 20778–20785 RSC.
- O. I. Parisi, C. Morelli, F. Puoci, C. Saturnino, A. Caruso, D. Sisci, G. E. Trombino, N. Piccia and M. S. Sinicropi, J. Mater. Chem. B, 2014, 2, 6619–6625 RSC.
- B. Pluhar, U. Ziener and B. Mizaikoff, J. Mater. Chem. B, 2015, 3, 6248–6254 RSC.
- Y. H. Wang, H. M. Duan, L. L. Li, X. J. Wang, J. B. Li, Y. A. Bu and C. A. Luo, RSC Adv., 2016, 6, 12391–12397 RSC.
- M. J. Lerma-García, M. Zougagh and A. Ríos, Microchim. Acta, 2013, 180, 363–370 CrossRef.
- Z. Terzopoulou, M. Papageorgiou, G. Z. Kyzas, D. N. Bikiaris and D. A. Lambropoulou, Anal. Chim. Acta, 2016, 913, 63–75 CrossRef CAS PubMed.
- Y. L. Hu, Y. F. Fan and G. K. Li, J. Chromatogr. A, 2012, 1228, 205–212 CrossRef CAS PubMed.
- C. Quesada-Molina, B. Claude, M. del Olmo-Iruela and P. Morin, Food Chem., 2012, 135, 775–779 CrossRef CAS PubMed.
- F. J. Ning, T. T. Qiu, Q. Wang, H. L. Peng, Y. B. Li, X. Q. Wu, Z. Zhang, L. X. Chen and H. Xiong, Food Chem., 2017, 221, 1797–1804 CrossRef CAS PubMed.
- S. Sharif, I. U. Khan, M. Ashfaq, M. S. Iqbal and S. Ahmad, J. Anal. Chem., 2010, 65, 1029–1034 CrossRef CAS.
- M. Javanbakht, M. M. Moein and B. Akbari-adergani, J. Chromatogr. B: Biomed. Sci. Appl., 2012, 911, 49–54 CrossRef CAS PubMed.
- M. Zarejousheghani, M. Möder and H. Borsdorf, Anal. Chim. Acta, 2013, 798, 48–55 CrossRef CAS PubMed.
- L. X. Chen, X. Y. Wang, W. H. Lu, X. Q. Wu and J. H. Li, Chem. Soc. Rev., 2016, 45, 2137–2211 RSC.
- J. X. Liu, Q. L. Deng, D. Y. Tao, K. G. Yang, L. H. Zhang, Z. Liang and Y. K. Zhang, Sci. Rep., 2014, 4, 5487–5492 CrossRef CAS PubMed.
- Y. M. Liang, L. L. Yu, R. Yang, X. Li, L. B. Qu and J. J. Li, Sens. Actuators, B, 2017, 240, 1330–1335 CrossRef CAS.
- J. H. Xu, Y. Z. Wang and S. S. Hu, Microchim. Acta, 2017, 184, 1–44 CrossRef CAS.
- J. X. Guo, Y. Z. Wang, Y. J. Liu, C. J. Zhang and Y. G. Zhou, Talanta, 2015, 144, 411–419 CrossRef CAS PubMed.
- K. Hemmati, R. Sahraei and M. Ghaemy, Polymer, 2016, 101, 257–268 CrossRef CAS.
- S. D. Pan, X. H. Chen, X. P. Li, M. Q. Cai, H. Y. Shen, Y. G. Zhao and M. C. Jin, J. Chromatogr. A, 2015, 1422, 1–12 CrossRef CAS PubMed.
- N. S. Ye, T. Gao and J. Li, Anal. Methods, 2014, 6, 7518–7524 RSC.
- N. Rahim, S. B. S. Naqvi, M. Alam, E. Iqbal and R. Bibi, Trop. J. Pharm. Res., 2014, 13, 975–979 CrossRef CAS.
- E. G. Karageorgou, V. F. Samanidou and I. N. Papadoyannis, J. Sep. Sci., 2012, 35, 2599–2607 CrossRef CAS PubMed.
- E. G. Karageorgou and V. F. Samanidou, J. Sep. Sci., 2010, 33, 2862–2871 CrossRef CAS PubMed.
- J. Makchit, S. Upalee and C. Thongpoon, Anal. Sci., 2006, 22, 591–597 CrossRef CAS PubMed.
- A. H. Rageh, K. F. Klein and U. Pyell, Chromatographia, 2016, 79, 225–241 CAS.
| This journal is © The Royal Society of Chemistry 2017 |

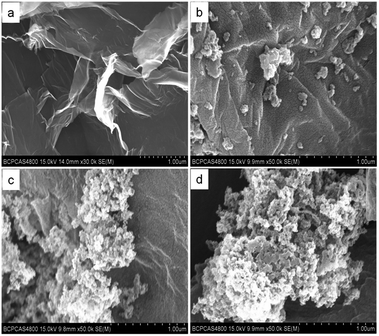
![[thin space (1/6-em)]](https://www.rsc.org/images/entities/char_2009.gif) 000; (b–d) ×50
000; (b–d) ×50