DOI:
10.1039/C7RA02918G
(Paper)
RSC Adv., 2017,
7, 25838-25847
Performances of an Al–0.15 Bi–0.15 Pb–0.035 Ga alloy as an anode for Al–air batteries in neutral and alkaline electrolytes
Received
10th March 2017
, Accepted 8th May 2017
First published on 15th May 2017
Abstract
Aluminum is a very good candidate anode for metal–air batteries due to its negative electrode potential, high theoretical electrochemical equivalent value, abundant reserves and environmental friendliness. The corrosion behavior and electrochemical properties of the Al–1.5Bi–1.5Pb–0.035Ga alloy were investigated by self-corrosion tests and electrochemical techniques, and compared with that of pure Al and Al–Bi–Pb alloys. The performances of Al–air batteries based on these alloy anodes were studied by constant current discharge and I–V discharge tests. The corrosion morphology and discharge surface were also investigated by scanning electron microscopy (SEM) and energy dispersive X-ray (EDX) analysis. The results show that the Al–Bi–Pb–Ga alloy provides a more negative potential and exhibits an enhanced activity in NaCl solution compared with pure Al and Al–Bi–Pb alloys, and gives high power density (253.4 ± 2.5 mW cm−2) and desirable anode efficiency (85.4 ± 0.5%) when used as an anode for Al–air batteries in KOH solution. Moreover, the dissolution mechanism of the Al–Bi–Pb–Ga alloy is also characterized based on the electrochemical measurements and microstructure observations.
1. Introduction
Aluminum (Al) has many interesting features such as its lightness, abundant reserves, and environmental friendliness. Al is also an excellent electrode material due to its negative electrode potential (−1.66 V vs. NHE), high energy density (8.1 kWh kg−1) and high theoretical electrochemical equivalent value (2.98 Ah g−1) which is much higher than that of zinc (Zn) (0.82 Ah g−1). These make Al a very good candidate for anodes in metal–air batteries.1–3 Al–air batteries are promising power generation and energy storage devices, which can be applied in fields such as electric vehicles, navigation and portable sources.4,5
However, the practical application of Al anodes in metal–air batteries has been hindered by some drawbacks, such as the presence of natural oxide films on the surface of aluminum, which make the corrosion potential of the Al anode much lower than its theoretical value.6,7 Thus, it needs to be activated to achieve higher power density. Although the oxide film can be removed in alkaline electrolyte, the aluminum will react with the electrolyte to generate hydrogen:8
| | |
Al + 4OH− = Al(OH)4− + 3e−
| (1) |
| | |
2H2O + 2e− = H2 + 2OH−
| (2) |
This reaction of the parasitic corrosion, or self-discharge, degrades the anode efficiency and must be suppressed in order to minimize the capacity loss. According to previous research, there are several ways to suppress the parasitic corrosion reaction of aluminum anode. One method is doping the minimal elements in Al, such as Mg, Zn, Pb, Sn, Ga, In, Mn, Hg and Tl, due to their low melting temperatures, high solubility degree in Al and high hydrogen evolution overpotential.9–12 Another way is adding some inhibitors into the electrolyte. Sodium stannate, zinc oxide, indium hydroxide, and citrate are found to be effective in inhibiting the self-corrosion of aluminum in alkaline solutions.13–16 The third approach is to modify the microstructures of Al anodes, such as refining the grain17,18 and tailoring the crystallographic orientation of Al anodes.19
Among them, doping the minimal elements in Al is considered as the most popular and effective one, and has been investigated intensively. It was reported that Bi, Pb and Ga are very important doping elements for Al anode. Bi can precipitate along the grain boundaries in the form of segregation phases that can activate the Al anode in alkaline solutions.20 Pb can effectively suppress the hydrogen evolution of Al anode due to its high hydrogen evolution overpotential. Also, Pb can accelerate the spalling of discharge products of anode, and then obviously improve its discharge activity.21 Ga can activate the surface of aluminum by thinning of the passivated oxide film.22
After testing several possible compositions, an excellent Al alloy anode based on Al–Bi–Pb–Ga was developed. The alloy anode exhibits the better electrochemical activity and high power density in both neutral salt and alkaline electrolytes. The aim of this study is to obtain an alloy with excellent comprehensive electrochemical properties for use in the Al–air battery, which would allow application as high performance power sources.
2. Experimental
2.1 Material preparation
Alloys were prepared from pure metals by the method of casting. Raw materials were pure aluminum (99.99%), bismuth (99.99%), lead (99.99%), and gallium (99.99%). The nominal composition of the Al–Bi–Pb–Ga alloy is 0.15wt%Bi–0.15wt%Pb–0.035wt%Ga–Al. Raw materials were melted in a graphite crucible heated by an induction furnace at 760 ± 10 °C. The molten alloy was poured into a graphite mold. After casting, the alloy was homogenized at 550 °C for more than 3 hours and then quenched in cold water. Then the alloy ingot was cold–rolled to 4 mm sheet and then annealing at 300 °C for 3 hours. The alloy Al–0.15 wt% Bi–0.15 wt% Pb and pure Al samples (99.99%) were manufactured with the same procedure. For comparison, the as-cast Al–Bi–Pb–Ga alloy (without rolling and annealing) was also prepared. The ultimate compositions of the alloys were analyzed by the direct reading spectrometer (MAXxLMM16, SPECTRO), and the results are shown in Table 1.
Table 1 Chemical compositions of Al–0.15Bi–0.15Pb and Al–0.15Bi–0.15Pb–0.035Ga alloys (wt%)
| Alloys |
Bi |
Pb |
Ga |
Si |
Fe |
Al |
| Al–Bi–Pb |
0.147 |
0.156 |
— |
0.009 |
0.014 |
Remainder |
| Al–Bi–Pb–Ga |
0.152 |
0.146 |
0.036 |
0.013 |
0.011 |
Remainder |
| As cast Al–Bi–Pb–Ga |
0.150 |
0.147 |
0.034 |
0.005 |
0.003 |
Remainder |
The microstructure of Al–Bi–Pb–Ga alloy was examined with scanning electron microscope (SEM; FEG 250 FEI Quanta) using backscattered electron (BSE) image. Before test, the sample was ground with emery paper, polished with diamond grinding paste and washed with acetone and deionized water. The composition of local area in the sample was analyzed with an energy dispersive analysis of X-ray (EDX).
2.2 Self-corrosion
The self-corrosion was investigated by hydrogen evolution tests using a set of hydrogen collection equipment. A similar apparatus for hydrogen collection was described elsewhere.9 The specimens for hydrogen evolution test were cut to little squares (10 mm × 10 mm × 4 mm). The squares were sealed with resin and only a surface of 1 cm2 was exposed. The exposed surface was ground with different grades of emery paper, then cleaned with acetone and distilled water. The tests of hydrogen evolution were performed for 1 h in 4 M KOH solution and 48 h in 2 M NaCl solution. The temperature of the solution was controlled at 25 °C using a thermostat water-bath. The hydrogen evolution rate was calculated by the formula:
| Hydrogen evolution rate = hydrogen volume/surface area/time of immersion (ml cm−2 min−1). |
The morphologies of the specimens after immersion for 1 h in 4 M KOH or 2 M NaCl solution were investigated by a scanning electron microscope (SEM). Energy dispersive X-ray (EDX) analysis was used to identify the precipitates on the surface of Al–Bi–Pb–Ga alloy.
2.3 Electrochemical measurements
The electrochemical tests were carried out with the conventional three-electrode system using an electrochemical workstation (660E, CH Instruments). The electrolytes in this study were 2 M NaCl or 4 M KOH solutions. The counter electrode was a platinum sheet with size of 20 × 20 mm2, and the reference electrode was an Hg/HgO electrode. The pure Al, Al–Bi–Pb and Al–Bi–Pb–Ga samples were encapsulated in epoxy with the exposed area of 1 cm2, ground with emery paper (grade 400-800-1500-2000), cleaned with distilled water, dried in air, and then immersed in the electrolyte for about 1 h until the open circuit potential (OCP) was steady. Potentiodynamic polarization was measured at a scan rate of 1 mV s−1. The electrochemical impedance spectroscopy (EIS) measurement was carried out in a frequency range of 100 kHz–0.1 Hz at OCP with a 5 mV sine perturbation. The results were fitted and evaluated using ZsimpWin electrochemical impedance spectroscopy analysis software.
2.4 Al–air battery test
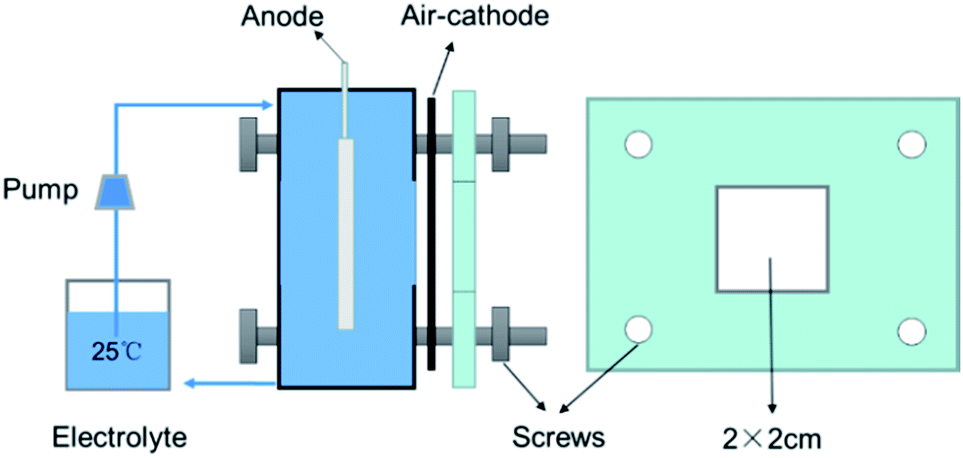
A self-designed battery system was shown in Fig. 1. A similar Al–air battery was described in our previous study.23 The system consists of the testing house, air cathode, anode, and electrolyte circulation unit. The air cathode with the active area of 2 × 2 cm2 used commercial MnO2 as the (oxygen reduction reaction) ORR catalyst. The electrolyte was 2 M NaCl or 4 M KOH solution. Discharge performances of the Al–air batteries were examined by means of constant current discharge at current densities of 25 mA cm−2 (in 2 M NaCl) or 100 mA cm−2 (in 4 M KOH) on a multichannel battery testing system (CT2001A, Land Company). The anode efficiency and fuel efficiency were calculated based on the measurement of weight change during discharge using the following formula:24
| Anode efficiency, η = Q/Q0 |
| Fuel efficiency, ηfuel = W/W0 |
where η, Q, Q0, ηfuel, W and W0 are the anode efficiency, actual capacity density, theoretical capacity density (2980 mA h g−1), fuel efficiency, actual energy density and theoretical energy density (8100 Wh kg−1), respectively. The weight of the samples before and after discharge was measured accurately by a high-sensitivity balance. The corrosion products were removed from a solution of 2% CrO3 and 5% H3PO4 at 80 °C for about 5 min and then rinsed by distilled water and ethanol. The corroded surfaces of the samples after discharge without the discharge products were observed with the SEM using secondary electron (SE) image. Moreover, the discharge products were identified with an X-ray diffraction meter (D8 Advance Davinci, Bruker) using Cu Ka radiation (λ = 0.15406 nm). The scan rate was 4° min−1 in the range of 2θ from 10° to 70°, and the angular resolution was 0.02°. The tube voltage and current were maintained at 40 kV and 40 mA, respectively. I–V discharge curves of Al–air batteries based on the different anodes in neutral or alkaline electrolytes were also measured. All measurements were taken at 298 ± 2 K. All electrochemical measurements and battery tests were performed three times to ensure the good reproducibility. The representative curves were given in the paper. Moreover, the results of corrosion current density, discharge potential, and anodic efficiency of each specimen obtained via the electrochemical methods were the average values of three parallel experiments with the standard deviations.
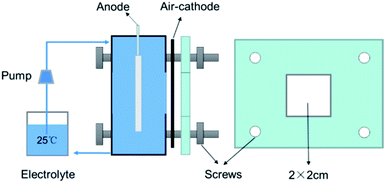 |
| | Fig. 1 Schematic diagram of Al–air battery system. | |
3. Results and discussion
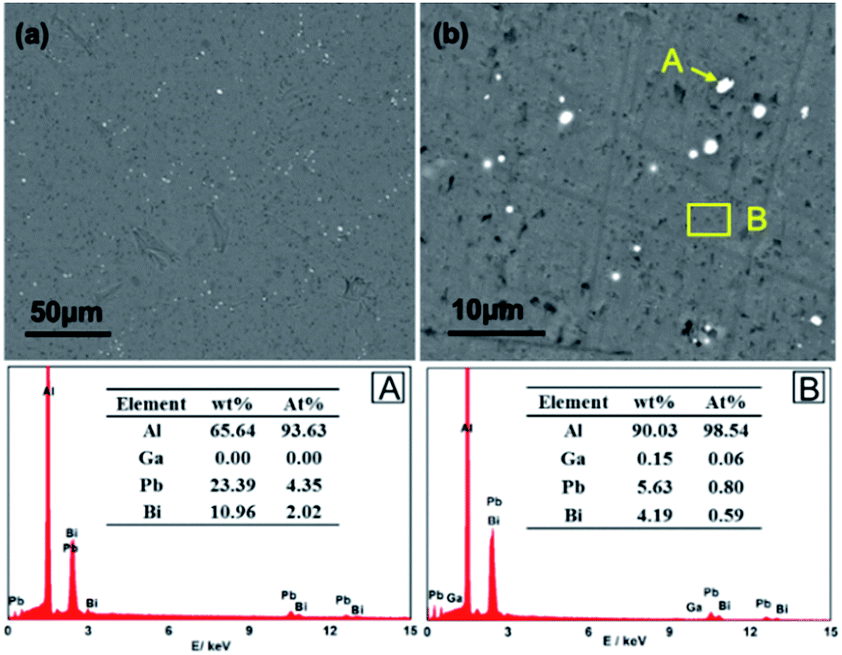
3.1 Microstructure
Microstructure of the as-prepared Al–Bi–Pb–Ga alloy was observed by SEM using the backscatter electron (BSE) detector. Fig. 2a and b show the BSE images of the alloy. Obviously, the microstructure of the alloy consists of gray α-Al matrix and white segregative phases. As shown in Fig. 2a, the segregative phases distribute unevenly in the α-Al matrix. According to the previous research, the elements with low melting points, such as Bi, Zn and Sn prefer to form the segregation at the grain boundaries during the solidification process.25
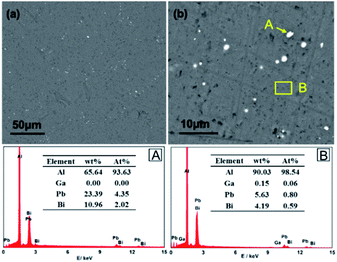 |
| | Fig. 2 Backscattered electron (BSE) image of Al–Bi–Pb–Ga alloy (a), close-up view (b), and the corresponding EDX results. | |
EDX analysis was performed on the segregative phase (point A) and the Al matrix (region B). The results reveal that the white spots mainly contain Al, Bi, and Pb elements. For point A, the contents of bismuth and lead are 23.39 wt% and 10.96 wt% respectively, which are much higher than those of the Al matrix. Thus, the white spots can be referred as bismuth and lead-enriched areas. In addition, the element Ga mainly exists in Al matrix in the form of solid solution, because the content of gallium in the segregative phases is too low to be identified according to the EDX analysis results.
3.2 Self-corrosion
Fig. 3 shows the hydrogen evolution rates of the pure Al, Al–Bi–Pb and Al–Bi–Pb–Ga alloys in 4 M KOH and 2 M NaCl solutions. The hydrogen evolution rate is almost liner with the increase of time in 4 M KOH solution. Compared with pure Al, the hydrogen evolution rates of Al–Bi–Pb or Al–Bi–Pb–Ga alloys are much lower, which is beneficial for the anodic efficiency of Al–air battery. This can be attributed to the addition of Bi and Pb elements, which can deposit on the aluminum surface via the dissolution–deposition process and finally increase the hydrogen evolution overpotential in the alkaline electrolyte. The hydrogen evolution rate was enhanced when adding Ga in the Al–Bi–Pb alloy, which was consistent with the results in literatures.26,27 The reason maybe that, Ga has a relatively high solid solubility in aluminum (6% at 600 °C), it can dissolve in the electrolyte together with the Al matrix, and then cause more corrosion sites in the Al substrate. The alloy samples exhibit very low hydrogen evolution rates in 2 M NaCl solution, because the oxide film on Al surface exerts a strong passivation effect in NaCl solutions.28 Whereas, it releases more hydrogen gas for Al–Bi–Pb–Ga alloy compared with the other two alloys after 48 h immersion, implying that the passive oxide film on the surface of alloys is chemically attacked more easily in NaCl solution, in the presence of Ga. The hydrogen evolution rate of the as-cast Al–Bi–Pb–Ga alloy was much higher than that of the rolled Al–Bi–Pb–Ga alloy in 4 M KOH solution, which may be attributed to the casting defects formed during solidification, such as non-uniform composition, shrinkage, loose, and bubbles.29
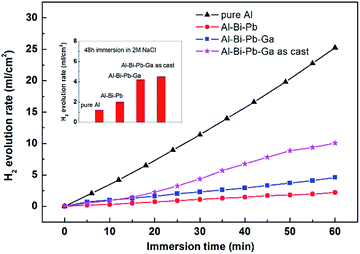 |
| | Fig. 3 Hydrogen evolution rates of experimental alloys in 4 M KOH and 2 M NaCl solutions. | |
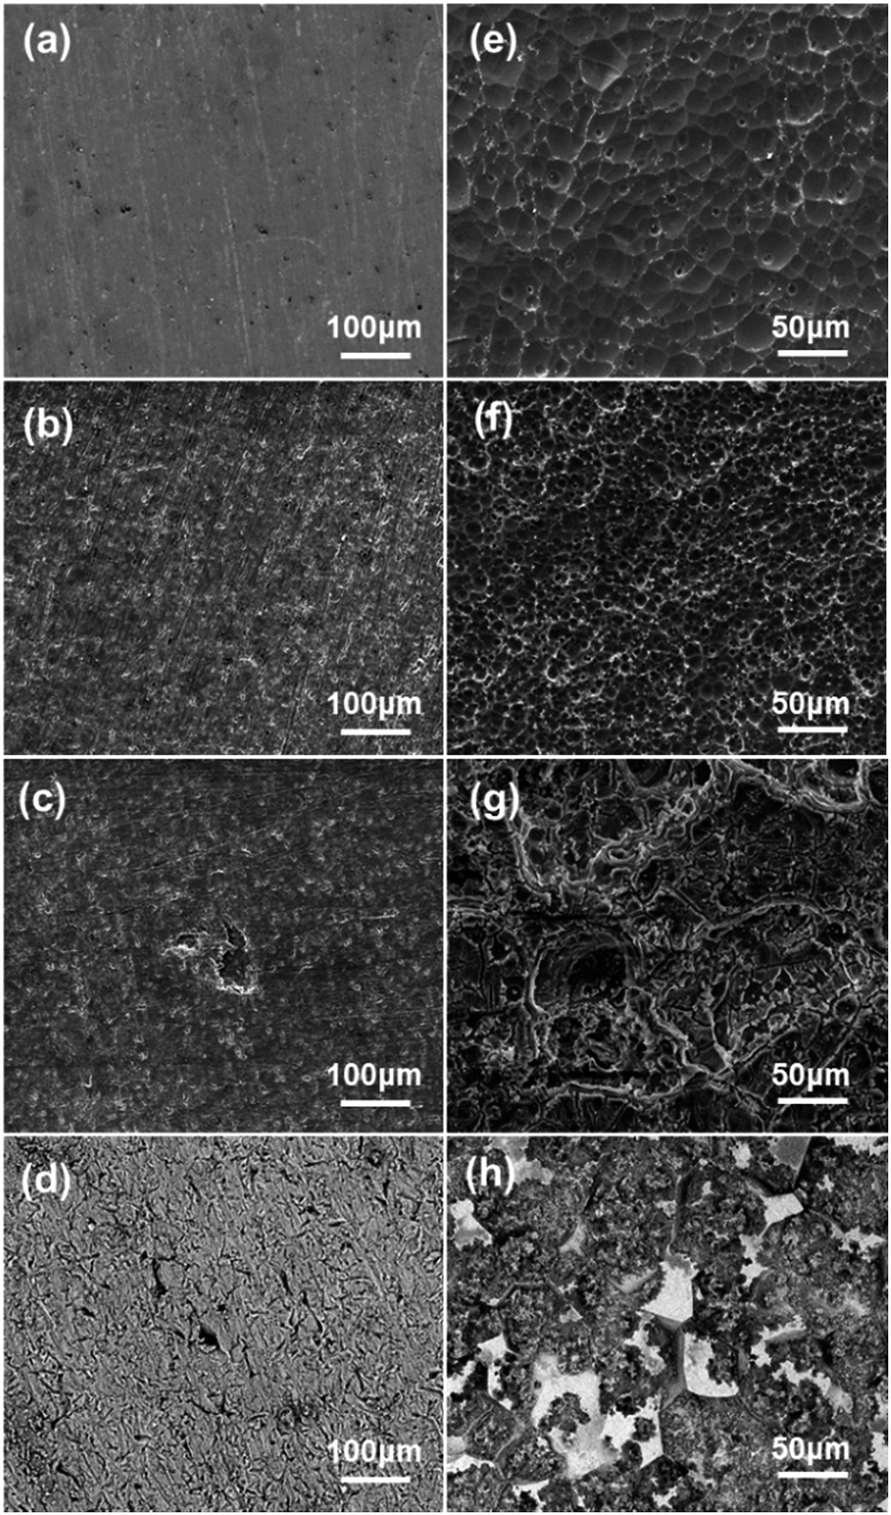
Fig. 4 shows the corrosion morphologies of different samples after immersed in 2 M NaCl or 4 M KOH solutions for 1 h. The micrograph of pure Al in 2 M NaCl shows a fairly smooth surface, while Al–Bi–Pb alloy exhibits a rough surface with large number of distributed pits. For Al–Bi–Pb–Ga alloy, besides the small pits, localized attack occurred and the oxide film was breakdown. This can be attributed to the addition of gallium. Because of its low melting point (303 K), it is likely to be very mobile within the aluminum alloy structure even at ambient temperature, thus the oxide film on the aluminum surface is not compact and easily to be attacked. The corrosion surface of as-cast Al–Bi–Pb–Ga alloy has many cracks due to the casting defects existing in the metal ingot. The self-corrosion morphology of pure Al in KOH shows large circular pits with the bare aluminum substrate, which can be easily etched by the alkaline electrolyte. For Al–Bi–Pb and Al–Bi–Pb–Ga alloys, the surfaces are adhered by many white precipitates. An intergranular corrosion morphology was observed in the picture of the as-cast Al–Bi–Pb–Ga alloy, indicating that the added Bi and Pb elements mainly gathered at the grain boundaries and distributed unevenly in the metal ingot,.
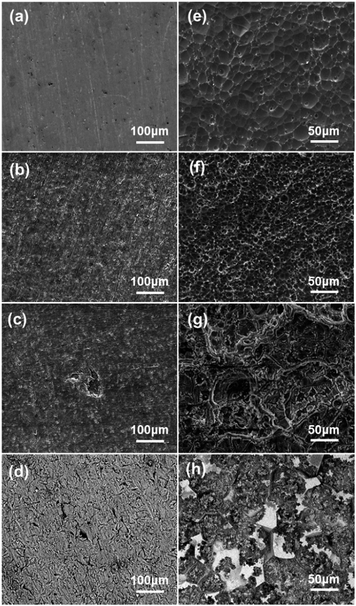 |
| | Fig. 4 SEM images of the samples after 1 h immersion in 2 M NaCl (a–d) and 4 M KOH (e–h) solutions: pure Al (a and e), Al–Bi–Pb (b and f), Al–Bi–Pb–Ga (c and g), as-cast Al–Bi–Pb–Ga (d and h). | |
The compositions of the precipitates were examined by EDX, as shown in Fig. 5. The results show that the precipitates mainly composed of aluminum, bismuth, lead, gallium, and oxygen, and the atom concentrations of Bi, Pb and Ga are obviously increased compared with the fresh surface (show in Fig. 2), indicating that these elements can redeposit on the Al surface from the solution. Because of their high hydrogen evolution potential, the self-corrosion can be effectively inhibited. On the other hand, the accumulation of the oxide/hydroxide film on the electrode surface can slow the Al dissolution, as well as reduce the hydrogen evolution by blocking active sites.
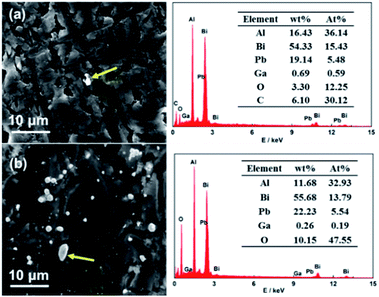 |
| | Fig. 5 SEM images of the precipitates of the Al–Bi–Pb–Ga alloy after 1 h immersion in 2 M NaCl (a) and 4 M KOH (b) solutions, and the corresponding EDX results. | |
3.3 Electrochemical analysis
3.3.1 Open-circuit potential (OCP). Fig. 6a shows the OCP vs. time curves for the different anodes in 2 M NaCl or 4 M KOH electrolytes. The OCPs are much more positive for all the anodes in neutral solutions than in alkaline solutions, which is due to the presence of the passive oxide film on aluminum surface according to reaction (3). Compared with pure Al, Al–Bi–Pb and Al–Bi–Pb–Ga alloys have the more negative OCPs in both 2 M NaCl and 4 M KOH electrolytes. This indicates that the addition of traces of Bi, Pb and Ga elements can considerably shift the OCP negatively, which is probably related to the increases of the number of segregative phases in alloys. The segregative phases enriched with Bi and Pb, have a much more positive standard potential than Al matrix, so they will act as the cathodic sites in the galvanic microcells, and accelerate the dissolution of the aluminum matrix via micro-galvanic effect.30| | |
2Al + 6H2O = 2Al(OH)3 + 3H2
| (3) |
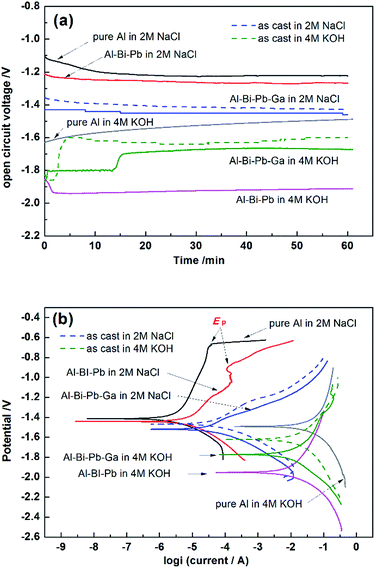 |
| | Fig. 6 Open circuit voltage curves (a) and potentiodynamic polarization curves (b) of pure Al, Al–Bi–Pb, Al–Bi–Pb–Ga and as-cast Al–Bi–Pb–Ga anodes in 2 M NaCl and 4 M KOH solutions. | |
It can be seen there is a step on the OCP curve of Al–Bi–Pb–Ga alloy in 4 M KOH solution. As discussed before, the gallium is mainly contained in the solid solution among the aluminum matrix. In alkaline environment, it is in favor of the formation of hydrolyzed species of [GaO2]−, [HGaO3]2− and [GaO3]3−.31 The concentrations of these species in the solution increase with time, finally these species can be oxidized to gallium and redeposit onto the aluminum surface.32 So the step on the open circuit potential curve may be caused by the dissolution–deposition of gallium.
3.3.2 Potentiodynamic polarization (Tafel). Fig. 6b and Table 2 show the potentiodynamic polarization curves and corresponding corrosion parameters measured in 2 M NaCl and 4 M KOH solutions, respectively. Comparing with the pure Al or Al–Bi–Pb anode, the Al–Bi–Pb–Ga anode shows the most negative corrosion potential (Ecorr), largest corrosion current density (jcorr), and the minimum polarization resistance (Rp) in 2 M NaCl electrolyte. Passive behavior is observed on the anodic branch of pure Al and Al–Bi–Pb alloys characterized by a current plateau. Then, a sharp increase in the current occurs at the pitting potential (Ep), which means the breakdown of the formed passive layer in chloride solution takes place by interaction between Al(OH)3 film and Cl− which penetrates through the film to form AlCl3 corresponding to the consecutive following reactions:33| | |
Al(OH)3 + Cl− → Al(OH)2Cl + OH−
| (4) |
| | |
Al(OH)2Cl + Cl− → Al(OH)Cl2 + OH−
| (5) |
| | |
Al(OH)Cl2 + Cl− → AlCl3 + OH−
| (6) |
Table 2 Corrosion parameters of pure Al, Al–Bi–Pb, Al–Bi–Pb–Ga and as-cast Al–Bi–Pb–Ga anodes in 2 M NaCl and 4 M KOH solutions
| Anode |
Solutions |
OCP (V vs. Hg/HgO) |
Ecorr (V vs. Hg/HgO) |
jcorr mA cm−2 |
Rp Ω cm2 |
| Pure Al |
2 M NaCl |
−1.22 |
−1.41 |
2.58 ± 0.06 × 10⁻³ |
14902.8 |
| Al–Bi–Pb |
2 M NaCl |
−1.27 |
−1.44 |
7.54 ± 0.3 × 10⁻³ |
5361.4 |
| Al–Bi–Pb–Ga |
2 M NaCl |
−1.45 |
−1.52 |
3.02 ± 0.6 × 10⁻² |
821.3 |
| Al–Bi–Pb–Ga as cast |
2 M NaCl |
−1.43 |
−1.47 |
4.43 ± 1.4 × 10⁻² |
662.3 |
| Pure Al |
4 M KOH |
−1.49 |
−1.49 |
25.90 ± 3.5 |
1.6 |
| Al–Bi–Pb |
4 M KOH |
−1.91 |
−1.95 |
6.82 ± 2.2 |
5.1 |
| Al–Bi–Pb–Ga |
4 M KOH |
−1.67 |
−1.77 |
8.50 ± 1.7 |
4.9 |
| Al–Bi–Pb–Ga as cast |
4 M KOH |
−1.60 |
−1.62 |
13.60 ± 2.4 |
3.4 |
For Al–Bi–Pb–Ga alloy, the quick rise in the current on the anodic branch suggests that the pitting potential Ep is nearby Ecorr, indicating the high activity of the alloy compared to Al–Bi–Pb and pure Al. This can be attributed to the addition of gallium which can increase the absorption of chloride ions at more negative potentials, and therefore activate the alloy.34
Comparing with that in 2 M NaCl electrolyte, Ecorr shifts negatively for all anodes in 4 M KOH electrolyte, because the previous oxide film can be removed by the alkaline solutions as reaction (7). In addition, the higher jcorr in alkaline solution for all the alloys is owing to the reduction of water as reaction (2), as well as the reaction of water with dissolved oxygen as reduction 8.35 Comparing with pure Al, the jcorr in alkaline solutions of Al–Bi–Pb and Al–Bi–Pb–Ga anodes decrease considerably, which can be ascribed to the inhibition of the hydrogen evolution. The as-cast Al–Bi–Pb–Ga anode shows a more positive Ecorr and a relatively higher jcorr than the rolled Al–Bi–Pb–Ga alloy. The polarization resistance Rp in alkaline solutions follows this order: pure Al < as-cat Al–Bi–Pb–Ga < Al–Bi–Pb–Ga < Al–Bi–Pb, which is consistent with the results of the hydrogen evolution test.
| | |
Al(OH)3 + OH− = Al(OH)4−
| (7) |
| | |
O2 + 2H2O + 4e− = 4(OH)−
| (8) |
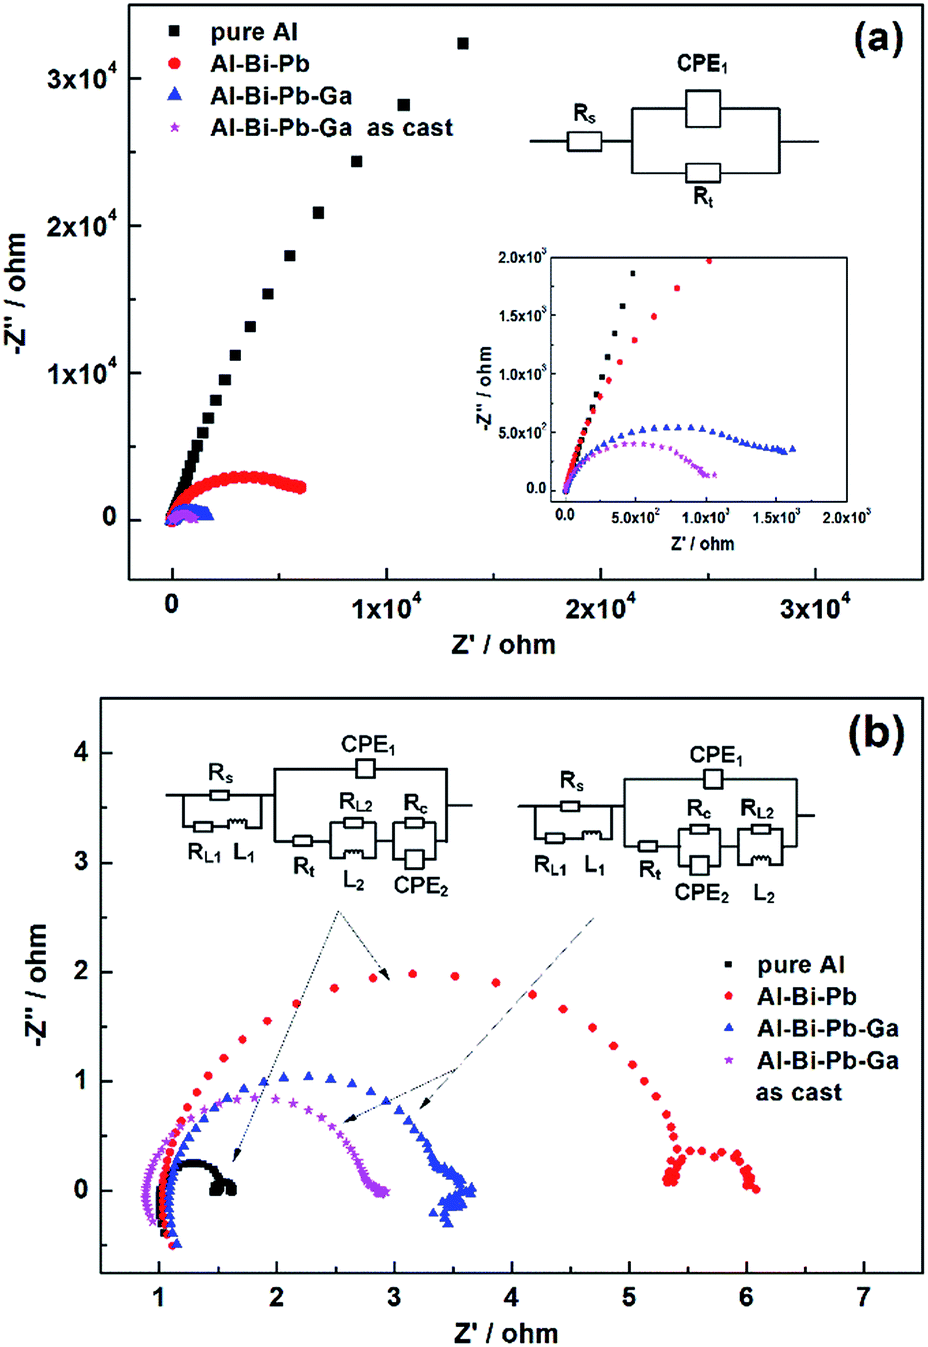
3.3.3 Electrochemical impedance spectroscopy (EIS). The EIS plots of the different anodes in 2 M NaCl and 4 M KOH are shown in Fig. 7. The equivalent circuits of the EIS plots are shown in the insert, and the fitting values of the impedance parameters are listed in Table 3. In the equivalent circuits, the constant phase element (CPE) is used to represent the double-layer capacitance. Rs and Rt presents the solution resistance and charge-transfer resistance, respectively. In 2 M NaCl, the EIS plots consist of a capacitive loop for all the three Al anodes, as shown in Fig. 7a. It can be seen that Rt decreases in the following order: Al > Al–Bi–Pb > Al–Bi–Pb–Ga > as-cast Al–Bi–Pb–Ga, indicating that adding Ga in the alloy can effectively improve the dissolution activity of Al anodes in NaCl solution.
 |
| | Fig. 7 EIS patterns of pure Al, Al–Bi–Pb, Al–Bi–Pb–Ga and as-cast Al–BI–Pb–Ga anodes in 2 M NaCl (a) and 4 M KOH (b) solutions. | |
Table 3 Simulated values derived from EIS curves of the different Al anodes
| |
2 M NaCl |
4 M KOH |
| Pure Al |
Al–Bi–Pb |
Al–Bi–Pb–Ga |
As-cast Al–Bi–Pb–Ga |
Pure Al |
Al–Bi–Pb |
Al–Bi–Pb–Ga |
As-cast Al–Bi–Pb–Ga |
| Rs (Ω cm2) |
2.53 |
2.26 |
2.13 |
2.84 |
3.64 |
5.40 |
4.86 |
2.23 |
| L1 (H cm2) |
— |
— |
— |
— |
1.58 × 10⁻⁶ |
1.64 × 10⁻⁶ |
1.63 × 10⁻⁶ |
1.67 × 10⁻⁶ |
| RL1 (Ω cm2) |
— |
— |
— |
— |
1.31 |
1.24 |
1.36 |
1.42 |
| CPE1 (Ω−1 Sn cm−2) |
4.79 × 10⁻⁵ |
5.95 × 10⁻⁵ |
6.45 × 10⁻⁵ |
7.52 × 10⁻⁵ |
4.32 × 10⁻⁵ |
9.75 × 10⁻⁵ |
1.44 × 10⁻⁴ |
3.36 × 10⁻⁴ |
| n1 (0 < n< 1) |
0.83 |
0.88 |
0.85 |
0.88 |
0.99 |
0.93 |
0.93 |
0.89 |
| Rt (Ω cm2) |
4.57 × 10⁵ |
7145 |
1523 |
1008 |
0.5 |
4.17 |
1.84 |
1.55 |
| CPE2 (Ω−1 Sn cm−2) |
— |
— |
— |
— |
0.08 |
0.1 |
0.05 |
0.39 |
| Rc (Ω cm2) |
— |
— |
— |
— |
0.16 |
0.86 |
0.18 |
0.08 |
| n2 (0 < n< 1) |
— |
— |
— |
— |
1 |
1 |
1 |
0.98 |
| L2 (H cm2) |
— |
— |
— |
— |
3.17 × 10⁻⁵ |
5.7 × 10⁻³ |
0.78 |
8.98 × 10⁻⁵ |
| RL2 (Ω cm2) |
— |
— |
— |
— |
0.09 |
0.32 |
0.48 |
0.33 |
| χ2 |
3 × 10⁻³ |
1.58 × 10⁻³ |
4.69 × 10⁻³ |
8.52 × 10⁻⁴ |
3.94 × 10⁻⁵ |
6.58 × 10⁻⁵ |
2.07 × 10⁻⁴ |
5.94 × 10⁻⁵ |
In alkaline solutions, the shapes of EIS plots of pure Al and Al–Bi–Pb are similar, both having two inductive loops at high frequency and middle frequency zone, as well as two capacitive loops at high frequency and low frequency zone, as shown in Fig. 7b. The capacitive semicircle at high frequency zone is attributed to the interfacial electrochemical reaction, and the equivalent component consists of a charge transfer resistance (Rt) in parallel with a double-layer capacitance. Rt plays an important role in the process of the dissolution of Al anode, and the higher Rt represents a lower corrosion rate.36,37 In 4 M KOH solutions, Rt of the different Al anodes increases in the following order: Al < as-cast Al–Bi–Pb–Ga < Al–Bi–Pb–Ga < Al–Bi–Pb, indicating that the corrosion resistance can be improved by adding elements of Bi, Pb and Ga into the Al matrix. The low-frequency capacitive loop originates from the dissolution precipitation on the Al surface, and the corresponding parameters are Rc and CPE2.38,39 For Al–Bi–Pb–Ga anode, the inductive loop at middle frequency zone disappears, and one at low frequency zone appears. The middle-frequency inductive loop may be related to the adsorption of intermediate product on the Al surface in the dissolution process, and its disappearance means the dissolution precipitation becomes easily on the surface of Al–Bi–Pb–Ga anode.40
In addition, the as-cast Al–Bi–Pb–Ga alloy has a little higher corrosion current density (jcorr), lower polarization resistance (Rp) and charge-transfer resistance (Rt) than that of the rolled Al–Bi–Pb–Ga alloy, indicating that the as-cast alloy can dissolve more easily in the electrolyte. Meanwhile, the severe self-corrosion and hydrogen-evolution behavior were also existed, which can lead to the low anode efficiency. Over all, the alloy with rolling and annealing is more suitable for the anode of Al–air batteries. Therefore, in the following Al–air battery tests, just the rolled state alloy samples were chosen as the anodes of Al–air batteries.
3.4 Al–air battery test
3.4.1 Current constant discharge. Fig. 8 shows the discharge behavior of Al–air batteries using pure Al, Al–Bi–Pb and Al–Bi–Pb–Ga anodes at the current density of 25 mA cm−2 (in 2 M NaCl) and 100 mA cm−2 (in 4 M KOH) for 1 h. The voltage–time curves are smooth because the temperature and concentration of the electrolyte can be stabilized by the electrolyte circulation system. The operating voltage decreases rapidly in the beginning of discharge, and then almost keeps a constant value. Table 4 summarizes the overall performances of the Al–air batteries using the different anodes in the 2 M NaCl and 4 M KOH solutions. In 2 M NaCl, the operating voltage and anode efficiency of Al–air battery with Al–Bi–Pb–Ga anode reach 1.064 ± 0.010 V and 68.2 ± 0.7%, respectively. Comparing with Al–Bi–Pb–Ga, the batteries with pure Al and Al–Bi–Pb anodes show remarkably lower operating voltage and fuel efficiency (ηfuel) due to the much thicker passive oxide film on their surface. In 4 M KOH electrolyte, the operating voltage of Al–Bi–Pb is slightly lower than that of Al–Bi–Pb–Ga, due to its relatively higher Rp and Rt, which will increase the internal resistance of the Al–air batteries, and then cause poor output performance of the Al–air batteries.41 Comparing with pure Al, the anode efficiencies (η) and fuel efficiencies (ηfuel) of Al–Bi–Pb or Al–Bi–Pb–Ga are improved, which can be attribute to the inhibition of the hydrogen evolution and improvement of the electrochemical activity. The Al–Bi–Pb–Ga alloy shows the highest energy density in both 2 M NaCl and 4 M KOH electrolytes.
 |
| | Fig. 8 Discharge behavior of Al–air battery at current density of 25 mA cm−2 (in 2 M NaCl) and 100 mA cm−2 (in 4 M KOH). | |
Table 4 Discharge performances of Al–air battery with pure Al, Al–Bi–Pb and Al–Bi–Pb–Ga anodes at current densities of 25 mA cm−2 (in 2 M NaCl) and 100 mA cm−2 (in 4 M KOH)
| Anodes |
Solutions |
Operating voltage (V) |
Capacity density (mAh g−1) |
η (%) |
Energy density (mWh g−1) |
ηfuel (%) |
| Pure Al |
2 M NaCl |
0.338 ± 0.015 |
2564 |
85.6 ± 0.5 |
907 |
11.1 ± 0.2 |
| Al–Bi–Pb |
2 M NaCl |
0.455 ± 0.025 |
2517 |
84.3 ± 0.3 |
1130 |
13.7 ± 0.4 |
| Al–Bi–Pb–Ga |
2 M NaCl |
1.064 ± 0.010 |
2048 |
68.2 ± 0.7 |
2244 |
27.3 ± 0.6 |
| Pure Al |
4 M KOH |
1.043 ± 0.012 |
2223 |
73.6 ± 1.0 |
2403 |
29.0 ± 0.7 |
| Al–Bi–Pb |
4 M KOH |
1.205 ± 0.015 |
2515 |
83.8 ± 0.6 |
2665 |
32.3 ± 0.6 |
| Al–Bi–Pb–Ga |
4 M KOH |
1.245 ± 0.015 |
2559 |
85.4 ± 0.5 |
3058 |
37.4 ± 0.4 |
The surface morphologies (after removing the discharge products) of the alloy anodes after discharge at current densities of 25 mA cm−2 (in 2 M NaCl) and 100 mA cm−2 (in 4 M KOH) for 1 h were obtained by SEM and shown in Fig. 9. As seen in Fig. 9a and b, in 2 M NaCl solution, pure Al and Al–Bi–Pb alloy undergo the crystallographic corrosion which is a typical corrosion behavior of aluminum alloys in chloride solutions.42–44 The presence of some geometric facets can be explained by the fact that the corrosion occurs probably along the well-defined crystallographic directions of {100} facets.45 Whereas, Al–Bi–Pb–Ga alloy exhibits a crack structure, which may be ascribed to the adsorption of Cl− ions when Ga is presented on the surface of the electrode at more electronegative potential. During cathodic polarization, the formation of hydrogen stresses the oxide film and causes the nucleation and growth of cracks.41
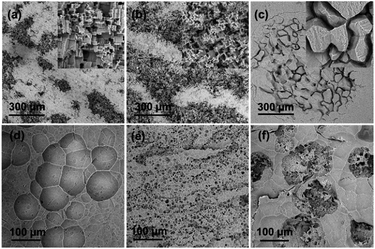 |
| | Fig. 9 SEM micrographs (after removing the discharge products) of Al anodes after discharge for 1 h at current density of 25 mA cm−2 in 2 M NaCl (a–c) and 100 mA cm−2 in 4 M KOH (d–f): pure Al (a and d), Al–Bi–Pb (b and e), Al–Bi–Pb–Ga (c and f). | |
Fig. 9d and e show the corrosion morphologies of pure Al, Al–Bi–Pb alloy and Al–Bi–Pb–Ga alloy in 4 M KOH solution. Some broad shallow pits with the diameter of about 100 μm can be found on the surface of pure Al. These pits are formed via galvanic corrosion initiated by the potential difference between aluminum and its more positive or anodic hydroxide layer.46 For Al–Bi–Pb alloy, the corrosion pits become smaller and homogeneously cover the anode surface. The reason may be that the added bismuth and lead in the Al–Bi–Pb alloy are in the form of segregative phases which act as the activation centers of the alloy.47 Fig. 9f shows that the surface of Al–Bi–Pb–Ga alloy is porous after discharge. This suggests that the existence of gallium can destroy the compact oxide film on the aluminum surface and make it loose and porous. The porous surface structure permits the transfer of the reactive species between the anode surface and the electrolyte, thus the alloy anode can discharge efficiently in 4 M KOH solution.
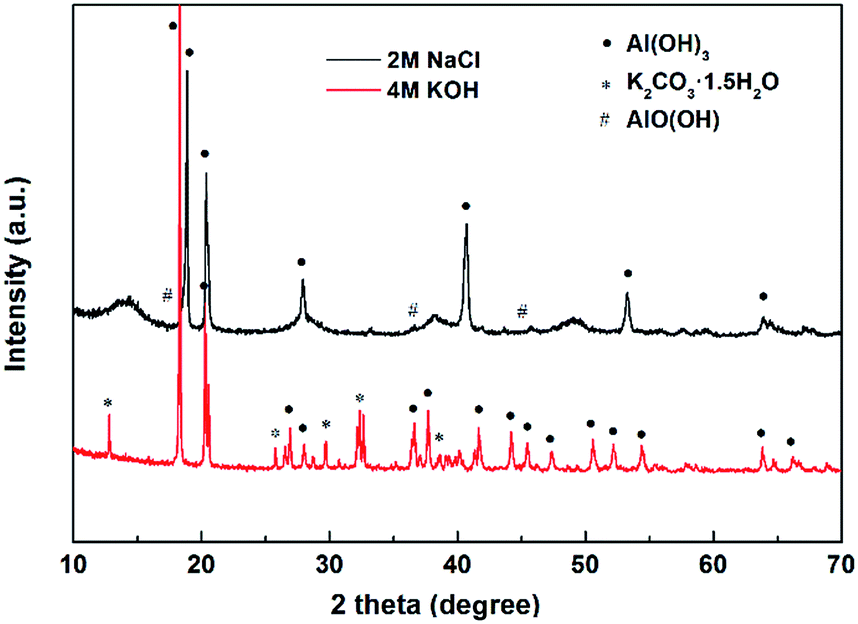
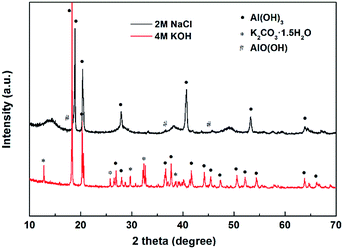
The XRD patterns for the discharge products of the Al–Bi–Pb–Ga anode are shown in Fig. 10. These products were obtained by filtering the electrolytes after discharging at current densities of 25 mA cm−2 (in 2 M NaCl) and 100 mA cm−2 (in 4 M KOH) for 1 h. It can be observed that the main discharge product is Al(OH)3, with a small amount of AlO(OH) in NaCl solution and K2CO3·1.5H2O in KOH solution, respectively. Bismuth and lead cannot be identified owing to their relatively low contents. The existence of K2CO3·1.5H2O means carbonation of the alkaline electrolyte by carbon dioxide in the air, which may impede air access and cause mechanical damage to the gas diffusion electrode.4 It is one of the issues of Al–air batteries with alkaline electrolyte.
 |
| | Fig. 10 XRD patterns for the discharge products of Al–Bi–Pb–Ga alloy after discharge for 1 h at current density of 25 mA cm−2 in 2 M NaCl and 100 mA cm−2 in 4 M KOH. | |
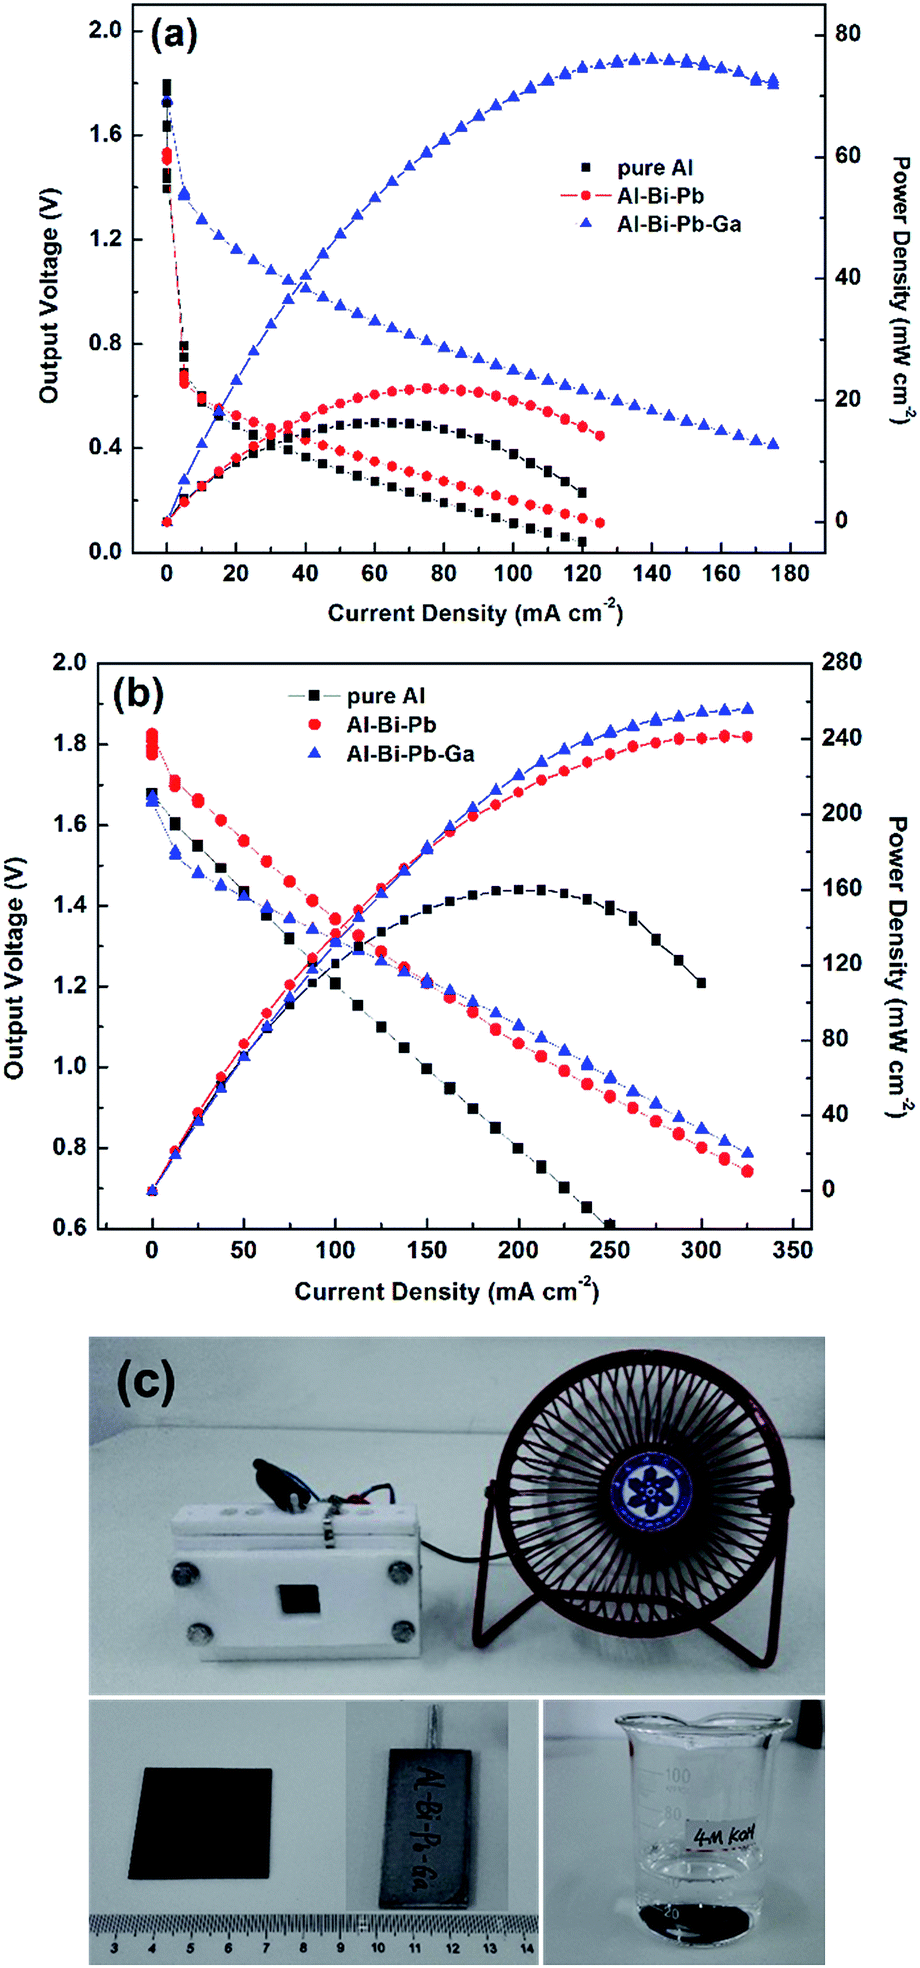
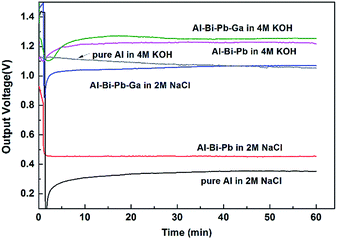
3.4.2 I–V discharge. Fig. 11a and b show the I–V discharge curves of Al–air batteries with pure Al, Al–Bi–Pb and Al–Bi–Pb–Ga as anodes in 2 M NaCl and 4 M KOH solutions, respectively. As shown in Fig. 11a, the battery with Al–Bi–Pb–Ga anode shows the highest power density in 2 M NaCl, and reaches the peak value of 75.5 ± 2.2 mW cm−2, which is considerably higher than that of pure Al (16.4 ± 1.3 mW cm−2) and Al–Bi–Pb (20.6 ± 1.7 mW cm−2). Moreover, the operating potentials of pure Al and Al–Bi–Pb alloys fall sharply at the beginning of discharge due to the big battery internal resistance which can be decreased in Al–Bi–Pb–Ga alloy. From Fig. 11b, it can be seen Al–air battery with Al–Bi–Pb–Ga as anode exhibits much better performance in 4 M KOH solutions. The maximum power densities reaches 253.4 ± 2.5 mW cm−2, which is more than two times of that of pure Al (108.5 ± 2.5 mW cm−2), making it as an appealing anode candidate for high power Al–air batteries which can probably be applied in electric vehicles and aircrafts. Fig. 11c shows a demonstration photo of a self-assembled Al–air battery, which consists of an air cathode (active area: 2 × 2 cm2), an anode (Al–Bi–Pb–Ga alloy) and 40 ml 4 M KOH electrolyte. It can be seen that the Al–air battery can successfully drive the electric fan.
 |
| | Fig. 11 I–V discharge curves of Al–air battery with the different Al anodes in the 2 M NaCl (a) and 4 M KOH (b) electrolytes; demonstration photo of the Al–air battery (c). | |
4. Conclusions
The discharge and corrosion behavior of Al–0.15Bi–0.15Pb–0.035Ga alloy anode in 2 M NaCl and 4 M KOH solutions were investigated by electrochemical techniques. Pure Al, Al–Bi–Pb alloy and the as-cast Al–Bi–Pb–Ga alloy are also included for comparison. It is found that the Al–Bi–Pb–Ga alloy gives better discharge performance in both half-cell test and battery discharge. The polarization resistance (Rp) and charge transfer resistance (Rt) of Al–Bi–Pb–Ga alloy are considerably smaller than that of pure Al and Al–Bi–Pb alloys in 2 M NaCl solution. The peak power density of the Al–air battery with Al–Bi–Pb–Ga anode is 253.4 ± 2.5 mW cm−2 using 4 M KOH as electrolyte, which is more than twice that of pure Al (108.5 ± 2.5 mW cm−2). Moreover, the anodic efficiency of this alloy at 100 mA cm−2 reaches 85.4 ± 0.5% in 4 M KOH solution, which is higher than that of pure Al (73.6 ± 1.0%).
The high performance of Al–Bi–Pb–Ga alloy is attributed to its chemical composition and microstructure feature. Activation in NaCl solution is mainly obtained by adding gallium to aluminum, which can increase the adsorption of Cl−ions in the active sites at more electronegative potentials and therefore activate the alloy evidenced by the quick rise in the current on the anodic branch of polarization curve. The inhibition of self-corrosion in KOH solution is related to deposition of the high hydrogen evolution overpotential elements Bi, Pb and Ga on the aluminum surface. The segregative phases formed by these elements can accelerate the dissolution of the Al matrix via micro-galvanic effect. Because of the strong electrochemical activity and high anodic efficiency, Al–0.15Bi–0.15Pb–0.035Ga alloy is a promising anode material for Al–air battery in both neutral and alkaline electrolytes.
Acknowledgements
The authors are grateful for the financial supports from the Ningbo Natural Science Foundation (2015A610245 and 2015A610251), Key Research Program of the Chinese Academy of Sciences (Grant No. KGZD-EW-T08) and National Key Research and Development Program of China (Grant No. 2016YFB0100100).
References
- M. Mokhtar, M. Z. M. Talib, E. H. Majlan, S. M. Tasirin, W. Ramli, W. R. W. Daud and J. Sahari, J. Ind. Eng. Chem., 2015, 32, 1–20 CrossRef CAS.
- H. Kim, G. Jeong, Y.-U. Kim, J.-H. Kim, C.-M. Park and H.-J. Sohn, Chem. Soc. Rev., 2013, 42, 9011–9034 RSC.
- A. Z. Zhuk, A. E. Sheindlin, B. V. Kleymenov, E. I. Shkolnikov and M. Y. Lopatin, J. Power Sources, 2006, 157, 921–926 CrossRef CAS.
- Q. F. Li and N. J. Bjerrum, J. Power Sources, 2002, 110, 1–10 CrossRef CAS.
- S. Yang and H. Knickle, J. Power Sources, 2002, 112, 162–173 Search PubMed.
- M. A. Amin, S. S. A. El-Rehim, E. E. F. El-Sherbini, S. R. Mahmoud and M. N. Abbas, Electrochim. Acta, 2009, 54, 4288–4296 CrossRef CAS.
- E. V. Koroleva, T. Hashimoto, G. E. Thompson and P. Skeldon, J. Electrochem. Soc., 2008, 155, C557–C564 CrossRef CAS.
- A. Elango, V. M. Periasamy and M. Paramasivam, Anti-Corros. Methods Mater., 2009, 56, 266–270 CrossRef CAS.
- S. Z. El Abedin and A. O. Saleh, J. Appl. Electrochem., 2004, 34, 331–335 CrossRef.
- I. Smoljko, S. Gudic, N. Kuzmanic and M. Kliskic, J. Appl. Electrochem., 2012, 42, 969–977 CrossRef CAS.
- M. Nestoridi, D. Pletcher, J. A. Wharton and R. J. K. Wood, J. Power Sources, 2009, 193, 895–898 CrossRef CAS.
- D. R. Egan, C. Ponce de León, R. J. K. Wood, R. L. Jones, K. R. Stokes and F. C. Walsh, J. Power Sources, 2013, 236, 293–310 CrossRef CAS.
- H. A. El Shayeb, F. M. Abd El Wahab and S. Z. El Abedin, J. Appl. Electrochem., 1999, 29, 473–480 CrossRef CAS.
- M. L. Doche, F. NovelCattin, R. Durand and J. J. Rameau, J. Power Sources, 1997, 65, 197–205 CrossRef CAS.
- V. Kapali, S. Venkatakrishna Iyer, V. Balaramachandran, K. B. Sarangapani, M. Ganesan, M. Anbu Kulandainathan and A. Sheik Mideen, J. Power Sources, 1992, 39, 263–269 CrossRef CAS.
- Q. Wang, Y. H. Liu, L. N. Zhang, Y. L. Song, D. W. Zhang and C. F. Li, Mater. Corros., 2010, 61, 222–228 CrossRef CAS.
- B. Zhang, Y. Li and F. Wang, Corros. Sci., 2007, 49, 2071–2082 CrossRef CAS.
- L. Fan and H. M. Lu, J. Power Sources, 2015, 284, 409–415 CrossRef CAS.
- L. Fan, H. M. Lu, J. Leng, Z. G. Sun and C. B. Chen, J. Power Sources, 2015, 299, 66–69 CrossRef CAS.
- H. Moghanni-Bavil-Olyaei and J. Arjomandi, RSC Adv., 2016, 6, 28055–28062 RSC.
- N. G. Wang, R. C. Wang, C. Q. Peng, Y. Feng and X. Y. Zhang, Trans. Nonferrous Met. Soc. China, 2010, 20, 1403–1411 CrossRef CAS.
- M. Srinivas, S. K. Adapaka and L. Neelakantan, J. Alloys Compd., 2016, 683, 647–653 CrossRef CAS.
- K. Y. Zhou, G. Y. Chen, J. A. Liu, Z. P. Zhang, P. Sun, W. Z. Zhang, F. Niu, W. X. Zhang and J. C. Liang, RSC Adv., 2016, 6, 90069–90075 RSC.
- L. Fan, H. M. Lu and J. Leng, Electrochim. Acta, 2015, 165, 22–28 CrossRef CAS.
- J. G. He, J. B. Wen, X. D. Li, G. W. Wang and C. H. Xu, Trans. Nonferrous Met. Soc. China, 2011, 21, 1580–1586 CrossRef CAS.
- Z. G. Sun, H. M. Lu, L. Fan, Q. S. Hong, J. Leng and C. B. Chen, J. Electrochem. Soc., 2015, 162, A2116–A2122 CrossRef CAS.
- J. L. Ma, J. B. Wen, F. Z. Ren, G. X. Wang and Y. Xiong, J. Electrochem. Soc., 2016, 163, A1759–A1764 CrossRef CAS.
- A. G. Muñoz, S. B. Saidman and J. B. Bessone, Corros. Sci., 2002, 44, 2171–2182 CrossRef.
- Z. Q. Ma and X. X. Li, J. Solid State Electrochem., 2011, 15, 2601–2610 CrossRef CAS.
- S. Khireche, D. Boughrara, A. Kadri, L. Hamadou and N. Benbrahim, Corros. Sci., 2014, 87, 504–516 CrossRef CAS.
- C. B. Breslin and W. M. Carroll, Corros. Sci., 1992, 33, 1735–1746 CrossRef CAS.
- K. Yu, S. H. Yang, H. Q. Xiong, L. Wen, Y. L. Dai, F. Teng and S. F. Fan, Trans. Nonferrous Met. Soc. China, 2015, 25, 3747–3752 CrossRef CAS.
- T. Kaewmaneekul and G. Lothongkum, Corros. Sci., 2013, 66, 67–77 CrossRef CAS.
- H. A. El Shayeb, F. M. Abd El Wahab and S. Zein El Abedin, Corros. Sci., 2001, 43, 643–654 CrossRef CAS.
- J. L. Ma, J. B. Wen, H. X. Zhu and Q. A. Li, J. Power Sources, 2015, 293, 592–598 CrossRef.
- S. Gudić, I. Smoljko and M. Kliškić, J. Alloys Compd., 2010, 505, 54–63 CrossRef.
- W. R. Osório, E. S. Freitas and A. Garcia, Electrochim. Acta, 2013, 108, 781–787 CrossRef.
- G. Galicia, N. Pébère, B. Tribollet and V. Vivier, Corros. Sci., 2009, 51, 1789–1794 CrossRef CAS.
- D. D. Macdonald, S. Real and M. Urquidimacdonald, J. Electrochem. Soc., 1988, 135, 2397–2409 CrossRef CAS.
- S. Q. Yuan, H. M. Lu, Z. G. Sun, L. Fan, X. Y. Zhu and W. Zhang, J. Electrochem. Soc., 2016, 163, A1181–A1187 CrossRef CAS.
- L. Fan, H. M. Lu, J. Leng and Z. G. Sun, J. Electrochem. Soc., 2015, 162, A2623–A2627 CrossRef CAS.
- M. Baumgärtner and H. Kaesche, Corros. Sci., 1990, 31, 231–236 CrossRef.
- M. Yasuda, F. Weinberg and D. Tromans, J. Electrochem. Soc., 1990, 137, 3708–3715 CrossRef CAS.
- M. Baumgärtner and H. Kaesche, Mater. Corros., 1991, 42, 158–168 CrossRef.
- J. C. Liu, X. M. Zhang, M. A. Chen, L. Li, B. Zhu, J. G. Tang and S. D. Liu, Appl. Surf. Sci., 2011, 257, 4004–4009 CrossRef CAS.
- G. S. Frankel, J. Electrochem. Soc., 1998, 145, 2186 CrossRef CAS.
- Y.
G. Tang, L. B. Lu, H. W. Roesky, L. W. Wang and B. Y. Huang, J. Power Sources, 2004, 138, 313–318 CrossRef CAS.
|
| This journal is © The Royal Society of Chemistry 2017 |
Click here to see how this site uses Cookies. View our privacy policy here. 
 Open Access Article
 This Open Access Article is licensed under a Creative Commons Attribution-Non Commercial 3.0 Unported Licence
 *a
*a