 Open Access Article
Synthesis of a hydrogen-bonded complex intumescent flame retardant through supramolecular complexation and its application in LDPE foam
Xingyou Chen and
Yinghong Chen *
*
State Key Laboratory of Polymer Materials Engineering, Sichuan University, Polymer Research Institute of Sichuan University, Chengdu 610065, China. E-mail: johnchen@scu.edu.cn; Fax: +86-28-85402465; Tel: +86-28-85405136
First published on 19th June 2017
Abstract
In this paper, a novel nitrogen–phosphorus hydrogen (H)-bonded complex intumescent flame retardant (IFR)-melamine (ME)⋯phosphoric acid (PA)⋯pentaerythritol (PER) (MPPR) was synthesized through a supramolecular complexation method by reacting a PA⋯PER H-bonded complex intermediate with ME. The PA⋯PER H-bonded complex intermediate was obtained by conducting an H-bonded complexation reaction between PA and PER in aqueous solution. FT-IR measurements and two-dimensional correlation infrared (2D IR) analysis were used to carefully investigate the PA⋯PER H-bonded complexation reaction and the related mechanism, and verify H-bond formation between PA and PER, of which the strength is different from that of PA and PER themselves. The results show that an appropriate PA/PER molar ratio could help to maintain the good solubility of PER in the system and the stability of the formed H-bonds. In addition, the reaction temperature proves to have a significant influence on H-bond formation in the system. 2D IR investigation indicates that in the full temperature range of 25–210 °C investigated, with increasing temperature, the formed H-bonds between PA and PER would be first broken to generate the free functional groups including P–O–H and C–O–H groups, which would then react with each other to form cyclized ester products at higher temperature than 150 °C. The obtained MPPR was finally incorporated into LDPE foam and imparted a good flame retardancy to the prepared foam, which is attributed to its good char forming capability and higher char yields.
1. Introduction
The intumescent flame retardant (IFR), proposed by Tramm1 in 1938, is a kind of environment-friendly flame retardant mainly composed of a carbon source as a char former (carbon-rich compound), an acid source as a dehydration catalyst for char formation, and a gas source as a blowing agent.2–4 The IFR plays the flame retarding role through the interaction between the carbon source, acid source and gas source. When the IFR systems are heated, the acid source can react with the char former, resulting in carbonization of the char former to form some cross-linking chemical substances so as to produce the final charred layers. At the same time, under the help of the decomposed gas from the blowing agent, well expanded and closed charred layers could be formed. As a result, the penetration of external oxygen into the expanded charred layers can be accordingly prevented. Meanwhile, heat transfer is also terminated in the interior of the foamed char layers, thus improving flame retardant performance.5–11According to the interactions between the acid source, carbon source and gas source, the IFR could be classified into mixed IFR and single-component IFR. Among the mixed IFRs investigated, APP/PER/ME is a traditional IFR system mostly used and is effective for flame retarding of PP material.12,13 The flame retardant efficiency of this IFR system is acceptable. However, the dispersion of the individual component in mixed IFR is a challenging problem, which is not advantageous to the enhancement in the flame retardancy of polymer materials. In addition, part of the components in mixed IFR is incompatible with the polymeric matrix, which will negatively influence the mechanical performance of the corresponding flame retarded (FR) materials. Comparatively, the single-component IFR shows the obvious advantage because it combines the acid source, carbon source and gas source into one single molecule and avoids the problems of dispersion of individual component and compatibility in mixed IFR. So, the single-component IFR attracts much attention of many researchers. The famous example for single-component IFR could be the melamine salt of pentaerythritol phosphate (MPPL). The strategy of synthesizing MPPL includes low temperature method14–16 and high temperature method.17–19 The low temperature method generally involves the use of the toxic POCl3, which also acts as the reaction medium solvent. The toxic POCl3 would cause the great pollution and harm to the ecological environment. The high temperature method is generally used to conduct the reaction of melamine phosphate with pentaerythritol. Due to the quite high reaction activation energy, this reaction needs to be carried out at a high temperature over 200 °C. In addition, it is very difficult for the reaction of melamine phosphate with pentaerythritol to be smoothly conducted in the conventional reactor due to the extremely high system viscosity. On the other hand, such a high reaction temperature would also cause the serious foaming during synthesis and bring troubles in the actual operation. In order to solve above problem, Yuan Liu17 used phospho-tungstic acid (PTA) to catalyze the pentaerythritol-melamine phosphate (PER-MP) reaction to synthesize intumescent flame retardant agent (MPP), which is used for improving the flame retardancy of PP. This novel and environment-friendly synthesis technology well solves the problems of conventional preparation methods. At the same time, Wang et al.18,19 successfully synthesized MPPL by using the twin-screw extruder as the reactor and the flame retarded polymer as the carrier resin and obtained a satisfactory conversion degree. This technology is environmental friendly but the reaction temperature (>200 °C) and the energy-consumption are high. Zhang et al.20 also synthesized a single-component IFR-pentaerythritol phosphate melamine salt (PPMS), which is used to improve the flame retardancy of the ethylene-vinyl acetate (EVA) copolymer. However, the methylbenzene and anhydrous aluminum chloride are needed during the synthesis process. It is not convenient to remove them after reaction. In addition, the reaction temperature they used is still high (>120 °C). Based on above background, the more environmental friendly synthesis technology, which could be implemented under more mild reaction conditions, needs to be developed to prepare the single-component IFR.
Polyethylene (PE) foam, as a flexible polymer cellular material, is widely used in many fields, such as antistatic packaging, cushion and shock absorption, heat insulation, etc. However, the fatal drawback is in its high flammability. The LOI value for PE is low (only 17.4%). As a result, PE burns very easily. Obviously, the flammability of PE foam is much higher than that of pure PE because PE foam is the mixture of air and the cellular material. So, enhancement in the flame retardancy of PE foam is an extremely difficult and also challenged problem worldwide. There are many investigations carried out in enhancing the flame retardancy of PE foam. The flame retardants adopted include halogen contained,21–25 inorganic24 and phosphorus compound.26–28 It can be known that the flame retardants used are mostly focused on the halogen based compounds, which show the relatively higher flame retarding efficiency for PE foam material. However, the environmental hazard problems caused by these halogen flame retardants cannot be neglected, greatly limiting their further applications. As an alternative method adopted to improve the flame retardancy of polymer foam, the use of halogen free single-component IFR could be possibly the best candidate due to its good char forming capability.
In this study, a novel supramolecular complexation method was used to synthesize the nitrogen–phosphorus H-bonded complex single-component IFR (MPPR), which is the reaction product between melamine and the phosphoric acid (PA)⋯pentaerythritol (PER) H-bonded complex intermediate. The reaction conditions are mild (<100 °C) and the synthesis process are environment-friendly (using water rather than organic solvent as the reaction medium). The obtained MPPR was then utilized to effectively improve the flame retardant property of the low-density polyethylene (LDPE) foam. Because PA and PER are combined through H-bonds, the prepared MPPR can be regarded as a single-component IFR, which can be expectedly dispersed well in LDPE foam matrix and impart an acceptable flame retardancy to LDPE foam. The in situ FT-IR characterization and the two-dimensional correlation infrared analysis were used to deeply investigate the PA⋯PER H-bonded complexation reaction and the related mechanism. The FT-IR analysis, horizontal burning test, micro-scale calorimeter and thermal gravimetric analysis were used to investigate the structure and property of the prepared FR LDPE foam material with MPPR. This investigation will provide a novel synthesis method for intumescent flame retardant and also a novel flame retardant for the flame retardancy of LDPE foam.
2. Experimental
2.1 Materials
Phosphoric acid (PA) (purity: AR), pentaerythritol (PER) (purity: AR) and dicumyl peroxide (DCP) (purity: AR) were obtained from Kelong Chemical Reagent Co., Chengdu, China. Melamine (ME) (purity: AR) was bought from Yulong Co., Chengdu, China. LDPE (2426H) was supplied by Lanzhou petrochemical Co., China. Azodicarbonamide (AC) (1500PE) was supplied by Eastward Chemical Co., Korea.2.2 Synthesis of MPPR
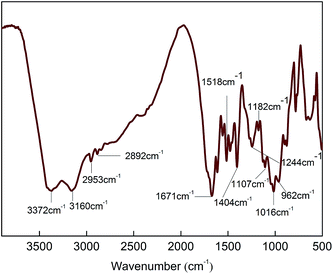
First of all, a certain amount of PA with 85 wt% concentration was added to a dried three-necked flask loaded with a proper amount of deionized H2O and the obtained PA contained aqueous solution was mixed at 90 °C for 0.5 h. Then, the calculated amount of PER was added to the PA aqueous solution heated at 90 °C under agitation and this H-bonded complexation reaction was kept at same temperature for about 1 h till a transparent and viscous liquid (PA⋯PER) was obtained. After that, the calculated amount of ME was slowly added to the viscous PA⋯PER aqueous solution at 90 °C and let this salt reaction kept for 1 h. The obtained slurry reaction products were put into an oven and directly dried to constant weight at 100 °C and the final white product MPPR was obtained. The featured FT-IR absorptions of MPPR include 3372 cm−1 (–NH2), 3160 cm−1 (NH+), 2953 and 2892 cm−1 (C–H), 1671 cm−1 (C![[double bond, length as m-dash]](https://www.rsc.org/images/entities/char_e001.gif) N), 1518 and 1404 cm−1 (ring from ME), 1244 and 1107 cm−1 (C–O–H), 1182 cm−1 (PO2−) and 1016 and 962 cm−1 (P–O–H).
N), 1518 and 1404 cm−1 (ring from ME), 1244 and 1107 cm−1 (C–O–H), 1182 cm−1 (PO2−) and 1016 and 962 cm−1 (P–O–H).
2.3 Preparation of flame retarded LDPE foam
All FR LDPE foams were prepared by using compression molding method. Firstly, the mixture of LDPE pellets, foaming agent AC and cross-linking agent DCP with a proper weight ratio was mixed in a batch mixer at 125 °C. Then, the pelletized LDPE loaded with AC and DCP was again melt-mixed with the flame retardant MPPR in a twin screw extruder with a screw speed of 50 rpm at 125 °C and the LDPE composite loaded with AC, DCP and MPPR was accordingly obtained. The prepared LDPE composites were subsequently compressed into partially cross-linked sheet (10 × 10 × 0.4 cm3) through compression molding at 145 °C. The sheets above mentioned were finally foamed at 175 °C to obtain the FR LDPE foam material.2.4 Characterization
The ordinary FT-IR spectra of the samples were recorded on a Thermo Fisher FTIR spectrometer (Nicolet 6700). The in situ FT-IR spectra of the samples were obtained by using a Thermo Scientific Nicolet iS10 spectrometer equipped with a deuterated triglycine sulfate (DTGS) detector. The measurement of the in situ FT-IR is illustrated as follows: the sample was firstly sealed between two small ZnSe windows (Φ 13 mm) and then placed in an in situ pool (programmed temperature device). The sample was subsequently heated from 25 to 210 °C with a rate of 1.0 °C min−1. During the heating, the FT-IR spectra were collected. The FT-IR spectral resolution was 4 cm−1 and total of 20 scans were adopted. During the measurement, the sample was also protected using a static high-purity nitrogen gas. The generalized two-dimensional correlation infrared (2D IR) spectra29 were obtained by using software 2DCS 6.1 developed by Dr Tao Zhou in Sichuan University, China. In the generalized 2D IR spectra, the red and blue areas represent positive and negative correlations, respectively.The thermal gravimetric analysis (TGA) was conducted on a TA Q50 TG thermal analyzer at a heating rate of 10 °C min−1 under pure nitrogen atmosphere with a flow rate of 100 ml min−1. The test temperature range was from 30 to 700 °C.
The horizontal burning test was carried out on a CZF-3 horizontal and vertical burning tester (made in Jiangning Analytical Instrument Factory, China) on the foam sheet 150 × 50 × 12 mm3 according to the standards ANSI/UL94-2001 and ASTM D4986-10.
The limiting oxygen index (LOI) measurement was carried out on a JF-3 oxygen index tester (made in Jiangning Analysis Instrument Company, China) according to the standard ASTM D2863. The sample size used is 120 × 6 × 3 mm3.
Micro-scale calorimeter measurement was also used to investigate the fire behavior of FR LDPE foam on the micro-scale combustion calorimeter (MCC) (MCC-2, made in the Govmark Organization, Inc.) according to the standard ASTM D7309.
3. Results and discussion
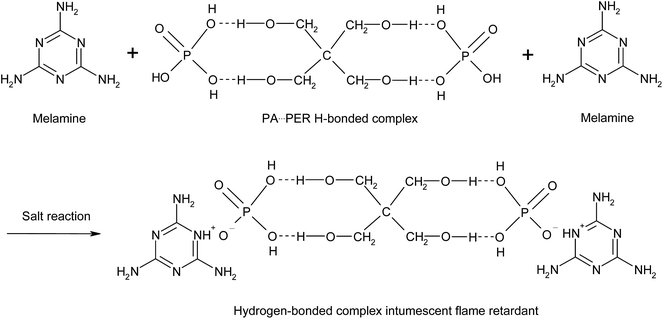
In this paper, the H-bonded complexation reaction between phosphoric acid (PA) and pentaerythritol (PER) was proposed to be firstly carried out in aqueous solution to prepare the H-bonded complex intermediate product of H3PO4 and PER (PA⋯PER). Then, the prepared H-bonded complex intermediate PA⋯PER was used to react with melamine to synthesize the H-bonded complex intumescent flame retardant through salt reaction.3.1 PA⋯PER H-bonded complexation reaction
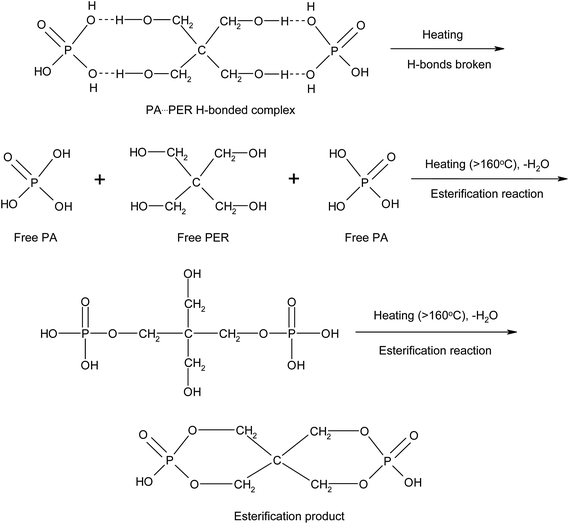
There are P–OH groups in H3PO4 (PA) and alcohol hydroxyl –CH2–OH groups in pentaerythritol (PER). So it is possible that the H-bonds could be formed between PA and PER in aqueous solution. The H-bonding complexation reaction between PA and PER can be shown in Scheme 1. This reaction equation clearly exhibits the formation of the H-bonds and the structure of the H-bonded complex intermediate PA⋯PER. The H-bonded complexation reaction of PA with PER was proved by the FT-IR characterization. Fig. 1 shows the FT-IR spectra of pure phosphoric acid (PA), pure pentaerythritol (PER) and H-bonded complex intermediate PA⋯PER. In FT-IR spectrum of PER, the peak at 3324 cm−1 is attributed to the absorption of alcohol hydroxyls in PER. In FT-IR spectrum of PA, the peak at 3404 cm−1 is attributed to the absorption of P–OH groups in PA. Compared with PA and PER, the H-bonded complex intermediate PA⋯PER obviously has a different absorption peak wavenumber (3347 cm−1) of the hydroxyl group. Relative to PA, the absorption of the hydroxyl group in PA⋯PER shifts toward a lower wavenumber direction, i.e. the red shift. This means that the addition of PER destroys the original H-bonds of PA system and forms the new intermolecular H-bonds with PA.30 The formed new H-bonds have a stronger strength than the old H-bonds in system. On the other hand, relative to PER, the absorption of the hydroxyl group in PA⋯PER shifts toward a higher wavenumber direction, i.e. the blue shift. This means that the addition of PA weakens the original H-bond interactions between PERs and forms the new intermolecular H-bonds between PA and PER with lower strength. Above results also indicate that the strength of the H-bonds in PER system is stronger than that in PA system. The wavenumber frequency difference in the reactants and the formed products could be related to the changes of the force constant of the related hydroxyl groups due to the formation of new H-bonds. This would correspondingly lead to the change in the stretching and bending vibration frequency. The factors affecting the H-bonded complexation reaction of PA with PER mainly includes the reactant ratio and the reaction temperature, which are discussed in detail as following.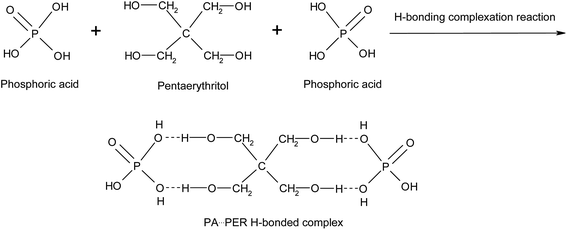 | ||
| Scheme 1 The H-bonding complexation reaction between phosphoric acid (PA) and pentaerythritol (PER). | ||
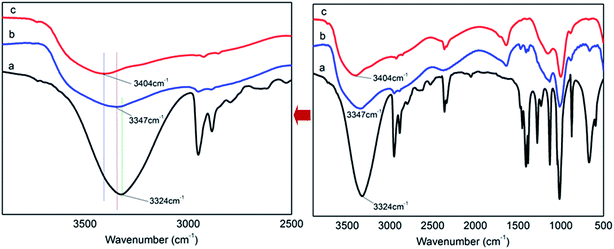 | ||
Fig. 1 The FT-IR spectra of pure PER (a), PA⋯PER H-bonded complex intermediate (PA/PER molar ratio = 2.5![[thin space (1/6-em)]](https://www.rsc.org/images/entities/char_2009.gif) : :![[thin space (1/6-em)]](https://www.rsc.org/images/entities/char_2009.gif) 1) (b) and pure PA (c). 1) (b) and pure PA (c). | ||
![[thin space (1/6-em)]](https://www.rsc.org/images/entities/char_2009.gif) :
:![[thin space (1/6-em)]](https://www.rsc.org/images/entities/char_2009.gif) 1, the –OH absorption peak of the obtained H-bonded complex appears at 3347 cm−1; however, for PA/PER = 3.0
1, the –OH absorption peak of the obtained H-bonded complex appears at 3347 cm−1; however, for PA/PER = 3.0![[thin space (1/6-em)]](https://www.rsc.org/images/entities/char_2009.gif) :
:![[thin space (1/6-em)]](https://www.rsc.org/images/entities/char_2009.gif) 1, the corresponding –OH absorption peak of the obtained H-bonded complex appears at 3380 cm−1. According to above results, it is seen that with increasing the ratio of PA and PER from 2.5
1, the corresponding –OH absorption peak of the obtained H-bonded complex appears at 3380 cm−1. According to above results, it is seen that with increasing the ratio of PA and PER from 2.5![[thin space (1/6-em)]](https://www.rsc.org/images/entities/char_2009.gif) :
:![[thin space (1/6-em)]](https://www.rsc.org/images/entities/char_2009.gif) 1 to 3.0
1 to 3.0![[thin space (1/6-em)]](https://www.rsc.org/images/entities/char_2009.gif) :
:![[thin space (1/6-em)]](https://www.rsc.org/images/entities/char_2009.gif) 1, the –OH absorption peak of PA⋯PER shifts to a higher wavenumber (blue shift, from 3347 to 3380 cm−1). Meanwhile, the –OH absorption peak of PA⋯PER (PA/PER molar ratio = 3.0
1, the –OH absorption peak of PA⋯PER shifts to a higher wavenumber (blue shift, from 3347 to 3380 cm−1). Meanwhile, the –OH absorption peak of PA⋯PER (PA/PER molar ratio = 3.0![[thin space (1/6-em)]](https://www.rsc.org/images/entities/char_2009.gif) :
:![[thin space (1/6-em)]](https://www.rsc.org/images/entities/char_2009.gif) 1) has a broader and flatter profile than that of PA⋯PER (PA/PER molar ratio = 2.5
1) has a broader and flatter profile than that of PA⋯PER (PA/PER molar ratio = 2.5![[thin space (1/6-em)]](https://www.rsc.org/images/entities/char_2009.gif) :
:![[thin space (1/6-em)]](https://www.rsc.org/images/entities/char_2009.gif) 1). Above results show that with increase of phosphoric acid concentration, the strength of formed H-bonds in system is actually weakened. This is not difficult to understand because the strength of the H-bonds formed in PA system is lower than that of the H-bond formed in PER system (the strength of the H-bonds is generally related to the electro-negativity of the involved element. The electro-negativity of P (2.19) is lower than that of C (2.55). So, the electro-negativity value of O in PA is lower than that of O in PER, leading to the strength of H-bonds in PA system being lower than that of the H-bond formed in PER system). Table 1 shows the PER dissolution phenomena at different PA/PER ratio. It can be seen that the increase of PA/PER ratio is beneficial to PER dissolution in water. This is because the increase of PA/PER ratio (PA concentration) weakens the intra-supramolecular H-bonding interaction occurring in PA⋯PER H-bonded complex and benefits the interaction of PER with the water molecules, as shown in Fig. 2.
1). Above results show that with increase of phosphoric acid concentration, the strength of formed H-bonds in system is actually weakened. This is not difficult to understand because the strength of the H-bonds formed in PA system is lower than that of the H-bond formed in PER system (the strength of the H-bonds is generally related to the electro-negativity of the involved element. The electro-negativity of P (2.19) is lower than that of C (2.55). So, the electro-negativity value of O in PA is lower than that of O in PER, leading to the strength of H-bonds in PA system being lower than that of the H-bond formed in PER system). Table 1 shows the PER dissolution phenomena at different PA/PER ratio. It can be seen that the increase of PA/PER ratio is beneficial to PER dissolution in water. This is because the increase of PA/PER ratio (PA concentration) weakens the intra-supramolecular H-bonding interaction occurring in PA⋯PER H-bonded complex and benefits the interaction of PER with the water molecules, as shown in Fig. 2.
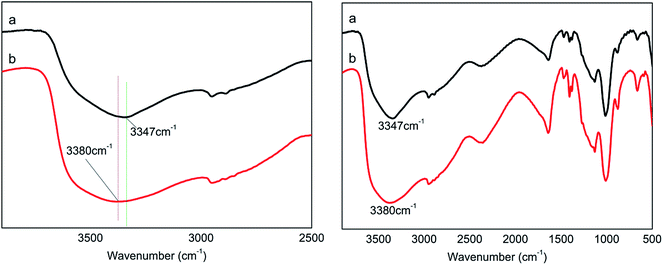 | ||
Fig. 2 The FT-IR spectra of PA⋯PER H-bonded complex intermediate with PA/PER molar ratio of 2.5![[thin space (1/6-em)]](https://www.rsc.org/images/entities/char_2009.gif) : :![[thin space (1/6-em)]](https://www.rsc.org/images/entities/char_2009.gif) 1 (a) and 3.0 1 (a) and 3.0![[thin space (1/6-em)]](https://www.rsc.org/images/entities/char_2009.gif) : :![[thin space (1/6-em)]](https://www.rsc.org/images/entities/char_2009.gif) 1 (b). 1 (b). | ||
| PA/PER molar ratio | Reaction phenomena |
|---|---|
2.0![[thin space (1/6-em)]](https://www.rsc.org/images/entities/char_2009.gif) : :![[thin space (1/6-em)]](https://www.rsc.org/images/entities/char_2009.gif) 1 1 |
PER did not dissolve completely and there is suspension observed |
2.5![[thin space (1/6-em)]](https://www.rsc.org/images/entities/char_2009.gif) : :![[thin space (1/6-em)]](https://www.rsc.org/images/entities/char_2009.gif) 1 1 |
PER dissolved completely and the reaction system is homogeneous |
3.0![[thin space (1/6-em)]](https://www.rsc.org/images/entities/char_2009.gif) : :![[thin space (1/6-em)]](https://www.rsc.org/images/entities/char_2009.gif) 1 1 |
PER dissolved completely and the reaction system is homogeneous |
![[thin space (1/6-em)]](https://www.rsc.org/images/entities/char_2009.gif) :
:![[thin space (1/6-em)]](https://www.rsc.org/images/entities/char_2009.gif) 1 at different reaction temperature (25–210 °C). Table 2 summarizes the assignment of the related functional groups. It can be seen that the reaction temperature also has a remarkable influence on the formation of H-bonds. With increasing the reaction temperature, the ν(OH) (3347 cm−1) peak in PA⋯PER H-bonded complex shifts toward higher-wavenumber direction, i.e. appearing the blue shift. It is also noticed that with increase in the reaction temperature, the ν(OH) peak in PA⋯PER H-bonded complex presents a remarkable decrease in intensity and even finally disappears at 210 °C. Above results show that the increase in reaction temperature would obviously weaken the H-bonded interaction occurring in PA⋯PER H-bonded complex. Too high reaction temperature (>150 °C) would lead to the complete destruction of the formed H-bonds. In the range of 800–1200 cm−1, there are also substantial changes in the absorption peaks of some functional groups with temperature. With increase in the reaction temperature, the intensity of ν(P–O–H) peak in PA decreases. At 157 °C and 210 °C appear the νnc(P–O–C) peak (no cyclization) and the νc(P–O–C) peak (cyclization), respectively. Above results further indicate that the increase in reaction temperature, on one hand, would cause the destruction of the formed H-bonds, and on the other hand, would promote the occurrence of the esterification reaction between PA and PER. At 157 °C, only one P–OH group in PA molecule can react with one C–OH group in PER to form the P–O–C ester group (at this time, no cyclization occurs). At 210 °C, the second P–OH group in PA molecule can overcome the steric hindrance to react with the left one C–OH group in PER to form another P–O–C ester group and the cyclization is accordingly finished. The influence of the temperature on the H-bonding interaction and the reaction mechanism between PA and PER will be further discussed in the following part.
1 at different reaction temperature (25–210 °C). Table 2 summarizes the assignment of the related functional groups. It can be seen that the reaction temperature also has a remarkable influence on the formation of H-bonds. With increasing the reaction temperature, the ν(OH) (3347 cm−1) peak in PA⋯PER H-bonded complex shifts toward higher-wavenumber direction, i.e. appearing the blue shift. It is also noticed that with increase in the reaction temperature, the ν(OH) peak in PA⋯PER H-bonded complex presents a remarkable decrease in intensity and even finally disappears at 210 °C. Above results show that the increase in reaction temperature would obviously weaken the H-bonded interaction occurring in PA⋯PER H-bonded complex. Too high reaction temperature (>150 °C) would lead to the complete destruction of the formed H-bonds. In the range of 800–1200 cm−1, there are also substantial changes in the absorption peaks of some functional groups with temperature. With increase in the reaction temperature, the intensity of ν(P–O–H) peak in PA decreases. At 157 °C and 210 °C appear the νnc(P–O–C) peak (no cyclization) and the νc(P–O–C) peak (cyclization), respectively. Above results further indicate that the increase in reaction temperature, on one hand, would cause the destruction of the formed H-bonds, and on the other hand, would promote the occurrence of the esterification reaction between PA and PER. At 157 °C, only one P–OH group in PA molecule can react with one C–OH group in PER to form the P–O–C ester group (at this time, no cyclization occurs). At 210 °C, the second P–OH group in PA molecule can overcome the steric hindrance to react with the left one C–OH group in PER to form another P–O–C ester group and the cyclization is accordingly finished. The influence of the temperature on the H-bonding interaction and the reaction mechanism between PA and PER will be further discussed in the following part.
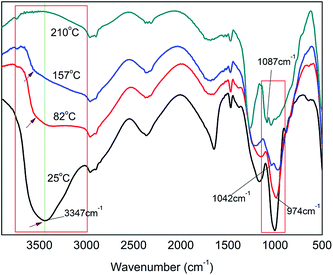 | ||
Fig. 3 The FT-IR spectra of PA⋯PER H-bonded complex intermediate with PA/PER molar ratio of 2.5![[thin space (1/6-em)]](https://www.rsc.org/images/entities/char_2009.gif) : :![[thin space (1/6-em)]](https://www.rsc.org/images/entities/char_2009.gif) 1 at different reaction temperature. 1 at different reaction temperature. | ||
![[thin space (1/6-em)]](https://www.rsc.org/images/entities/char_2009.gif) :
:![[thin space (1/6-em)]](https://www.rsc.org/images/entities/char_2009.gif) 1) H-bonded complex intermediate
1) H-bonded complex intermediate
| Wavenumber (cm−1) | Assignment | Symbol |
|---|---|---|
| 3347 | Deformation vibration of H-bonded –OH | ν(OH) |
| 974 | Stretching vibration of P–O–H | ν(P–O–H) |
| 1042 | Stretching vibration of P–O–C (no cyclization) | νnc(P–O–C) |
| 1087 | Stretching vibration of P–O–C (cyclization) | νc(P–O–C) |
| 1170 | Stretching vibration of H-bonded C–O | ν(C–O) |
| 1020 | Stretching vibration of H-bonded P–O | ν(P–O) |
In order to further illustrate the influence of the reaction temperature on the H-bonded interaction and reaction mechanism between PA and PER, the two-dimensional correlation infrared (2D IR) spectroscopic analysis was carried out here. First of all, we carefully investigated the in situ FT-IR spectra of PA⋯PER H-bonded complex intermediate heated from 25 to 82 °C (in this temperature range, the H-bonds are relatively stable). Then, the 2D IR analysis would be applied further.
According to the previous investigation and analysis, it is known that the strength of the formed H-bonds decreases with an increase in temperature, which is reflected in the decrease in intensity and the increase in wavenumber of ν(OH) peak. Fig. 4 shows the in situ FT-IR spectra of PA⋯PER H-bonded complex intermediate recorded from 25 °C to 82 °C. It is seen that the obtained FT-IR spectra show the similar trend, i.e. the ν(OH) peak at 3347 cm−1 decreases in intensity and shifts to a higher wavenumber with increasing temperature. This similarly indicates that the increase of temperature is not advantageous to the formation of H-bonds between PA and PER.
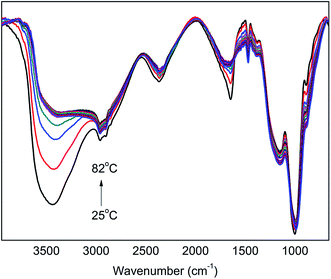 | ||
| Fig. 4 The in situ one-dimensional temperature dependent FT-IR spectra of PA⋯PER H-bonded complex from 25 to 82 °C at a heating rate of 1 °C min−1. | ||
The 2D IR analysis results, including the synchronous and asynchronous contour maps of PA⋯PER H-bonded complex during the heating process in the range of 4000–3000 cm−1, are shown in Fig. 5. As can be seen, in the synchronous contour map (left), a strong autopeak appears at 3650 cm−1, which should be ascribed to the free –OH group. In the asynchronous contour map (right), the negative cross peak Ψ(3650, 3347 cm−1) is observed and could be attributed to the relevance between the free –OH group and the H-bonded –OH group. According to Noda rule,31 if Φ(ν1, ν2) > 0, Ψ(ν1, ν2) > 0 or Φ(ν1, ν2) < 0, Ψ(ν1, ν2) < 0, the movement of ν1 is before that of ν2. If Φ(ν1, ν2) > 0, Ψ(ν1, ν2) < 0 or Φ(ν1, ν2) < 0, Ψ(ν1, ν2) > 0, the movement of ν1 is after that of ν2. If Φ(ν1, ν2) > 0, Ψ(ν1, ν2) = 0 or Φ(ν1, ν2) < 0, Ψ(ν1, ν2) = 0, the movements of ν1 and ν2 would occur simultaneously. If Φ(ν1, ν2) = 0, Ψ(ν1, ν2) > 0 or Φ(ν1, ν2) = 0, Ψ(ν1, ν2) < 0, the movements of ν1 and ν2 would not occur simultaneously. For our case, the asynchronous cross peak Ψ(3650, 3347 cm−1) is negative and the synchronous cross peak Φ(3650, 3347 cm−1) is zero. So, the movements of H-bonded –OH group at 3347 cm−1 and the free –OH group at 3650 cm−1 would not happen simultaneously, i.e., the H-bonded –OH group at 3347 cm−1 would change before the free –OH group at 3650 cm−1. Combining Fig. 4 with Fig. 5, it can be concluded that the H-bonded –OH group would be released from the PA⋯PER-bonded complex to form the free –OH group with increase in the temperature. This also indicates that the strong H-bonding interactions really exist between PA and PER from another perspective.
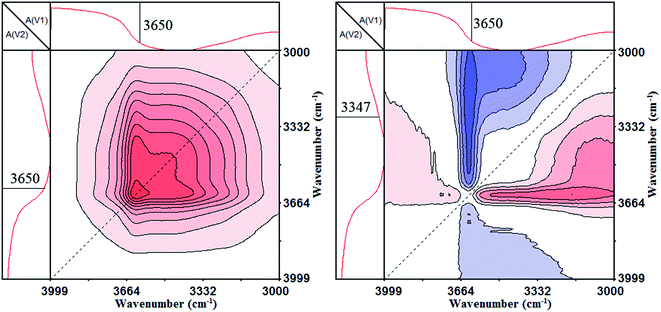 | ||
| Fig. 5 The 2D IR spectra of PA⋯PER H-bonded complex heated from 25 to 82 °C: synchronous map (left) and asynchronous contour map (right) in the range of 4000–3000 cm−1. | ||
In the range of 1350–900 cm−1, there are absorption peaks of C–O in PER and P–O in PA, appearing at ∼1170 cm−1 and ∼1020 cm−1, respectively. Fig. 6 shows the in situ one-dimensional FT-IR spectra of PA⋯PER H-bonded complex intermediate recorded from 25 °C to 82 °C in the range of 1350–900 cm−1. As can be seen, with increasing temperature, the absorption peaks of both C–O (1170 cm−1) and P–O (1020 cm−1) present a decreasing intensity and also shift toward a lower wavenumber direction. This indicates that the temperature variation also has the influence on the other functional groups (including C–O and P–O) except for –OH group in PA⋯PER H-bonded complex. We can also use 2D IR spectroscopy to analyze the change of these functional groups at different temperatures.
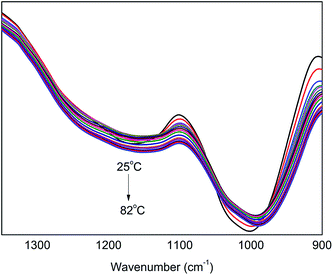 | ||
| Fig. 6 The in situ one-dimensional temperature dependent FT-IR spectra of PA⋯PER H-bonded complex in the range of 1350–900 cm−1 from 25 to 82 °C at a heating rate of 1 °C min−1. | ||
The synchronous and asynchronous contour maps of PA⋯PER H-bonded complex in the range of 1200–900 cm−1 during heating process (from 25 to 82 °C) are shown in Fig. 7. In the synchronous map (left), two strong autopeaks were shown to develop at 1120 cm−1 and 920 cm−1, indicating the prominent changes of the free C–O and the free P–O with elevating temperature, respectively. The appearance of the positive cross peak Φ(1120, 920) shows that the heating induced intensity variations of peaks at 1120 cm−1 and 920 cm−1 would be in the same direction, i.e., the peak intensity of free C–O and free P–O will be increased or decreased simultaneously under the effect of the external conditions. In the asynchronous map (right), there are the cross peaks at (1170, 1120 cm−1) (<0), (1170, 920 cm−1) (<0), (1120, 1020 cm−1) (>0) and (1020, 920 cm−1) (<0) appearing. The appearance of these cross peaks indicates that there are two types of C–O group and P–O group, respectively. The C–O group includes H-bonded C–O (1170 cm−1) and free C–O (1120 cm−1). The P–O group includes H-bonded P–O (1020 cm−1) and free P–O (920 cm−1). In the synchronous map, the synchronous cross peaks Φ(1170, 1120 cm−1), Φ(1170, 920 cm−1), Φ(1120, 1020 cm−1) and Φ(1020, 920 cm−1) are zero. Combing the positive or negative correlation of the cross peaks above mentioned with Fig. 6, it can be known that the movements of these groups are not simultaneous and the following sequential order of changes are right: H-bonded C–O > free C–O, H-bonded C–O > free P–O, H-bonded P–O > free C–O, H-bonded P–O > free P–O, free P–O = free C–O. The sign “>” and “=” mean that the change of the left functional group is prior to or simultaneous with that of the right functional group, respectively. Above analyzes indicate that the bound C–O and P–O due to the H-bonding would be liberated to form the free C–O and P–O, i.e., the H-bonding existing in PA⋯PER H-bonded complex would be first broken and then form the free PA and free PER with increasing the temperature.
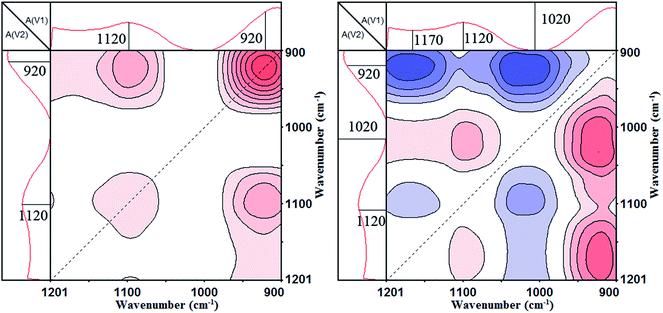 | ||
| Fig. 7 The 2D IR spectra of PA⋯PER H-bonded complex heated from 25 to 82 °C: synchronous contour map (left) and asynchronous contour map (right) in the range of 1200–900 cm−1. | ||
Fig. 8 shows in situ one-dimensional FT-IR spectra of PA⋯PER H-bonded complex intermediate recorded from 158 °C to 210 °C in the range of 1350–900 cm−1. From Fig. 8, several obvious changes can be seen with increasing the temperature: the peak intensity of P–O (960 cm−1) decreases and even finally disappear; the peak at 1160 cm−1 (C–O) shifts toward the higher wavenumber direction; at the same time, the intensity of peak at 1042 cm−1 (P–O–C, no cyclization) increases and the intensity of peak at 1087 cm−1 (P–O–C, cyclization) increases also. Above results seem to indicate that during heating process (from 158 °C to high temperature 210 °C), the related C–OH in PER could be reacted with P–OH to form the both cyclized and not cyclized P–O–C group. This could be further verified by the following 2D correlation IR analysis.
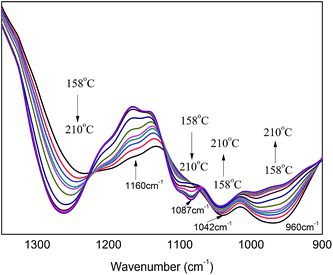 | ||
| Fig. 8 The in situ one-dimensional temperature dependent FT-IR spectra of PA⋯PER H-bonded complex in the range of 1350–900 cm−1 from 158 to 210 °C at a heating rate of 1 °C min−1. | ||
Fig. 9 shows the synchronous and asynchronous contour maps of PA⋯PER H-bonded complex in the range of 1200–900 cm−1 during heating process (from 158 to 210 °C). As can be seen, in the synchronous map (left), three strong autopeaks are shown to develop at 1160 cm−1, 1087 cm−1 and 960 cm−1, respectively, which indicates that the prominent changes of the free C–O, cyclized P–O–C and free P–O groups occur with increasing temperature. The appearance of the negative cross peak Φ(1160, 1087 cm−1) indicates that the free C–O and cyclized P–O–C located at 1160 and 1087 cm−1, respectively, would be changed in the opposite direction, i.e., the C–O–H would decrease in intensity and the P–O–C would increase in intensity. Similarly, The appearance of the negative cross peak Φ(1087, 960 cm−1) indicates that the cyclized P–O–C and free P–O located at 1087 and 960 cm−1, respectively, would also be changed in the opposite direction, i.e., the P–O–C would increase in intensity and the P–O–H would decrease in intensity. In the asynchronous map, the absorptions at 1160 cm−1 (C–O–H), 1087 cm−1 (P–O–C, cyclization), 1042 cm−1 (P–O–C, no cyclization) and 960 cm−1 (P–O–H) would form four cross peaks Ψ(1160, 960 cm−1) (>0), Ψ(1087, 960 cm−1) (>0), Ψ(1042, 960 cm−1) (>0) and Ψ(1160, 1087 cm−1) (<0). According to the Noda rule, because in synchronous contour map, both the cross peaks Φ(1160, 1087 cm−1) and Φ(1087, 960 cm−1) are negative, and however in asynchronous contour map, Ψ(1087, 960 cm−1) is positive and Ψ(1160, 1087 cm−1) is negative, the change of the P–O–C group would be after the change of free C–O–H group. Similarly, the change of the free P–O–H group would be prior to the change of the P–O–C group. Above analyzes clearly show that if continuously increasing the temperature, the C–O–H group and P–O–H group will react with each other (disappear) to form the P–O–C (cyclization) group.
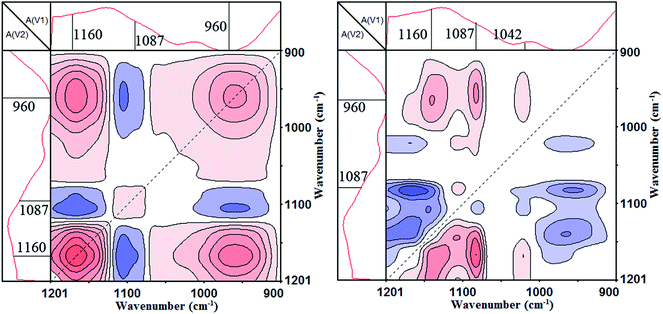 | ||
| Fig. 9 The 2D IR spectra of PA⋯PER H-bonded complex heated from 158 to 210 °C: synchronous contour map (left) and asynchronous contour map (right) in the range of 1200–900 cm−1. | ||
According to the two-dimensional correlation infrared spectrum analysis, it is clear that in the aqueous mixture solution of PA and PER, there are strong H-bonded interactions between PA and PER existing in system. With increasing the temperature, the H-bonds between PA and PER will be first broken to form the free C–O–H group and the free P–O–H group. Then, with the temperature continuously increasing, the free C–O–H group and the free P–O–H group will further react with each other (esterification reaction) to generate the ester products. The involved mechanism of these changes in the PA⋯PER H-bonded complex during heating process could be illustrated in Scheme 2.
3.2 Salt reaction between ME and PA⋯PER H-bonded complex
The obtained PA⋯PER H-bonded complex intermediate was used to react with melamine (ME) to prepare the salt of ME and PA⋯PER H-bonded complex (MPPR, an intumescent flame retardant) through salt reaction. The salt reaction is shown in Scheme 3. Fig. 10 shows the FT-IR spectrum of the prepared MPPR. It can be seen that some featured absorptions of MPPR appeared at 3372 cm−1 (–NH2), 3160 cm−1 (NH+), 2953 and 2892 cm−1 (C–H), 1671 cm−1 (C![[double bond, length as m-dash]](https://www.rsc.org/images/entities/char_e001.gif) N), 1518 and 1404 cm−1 (ring from ME), 1244 and 1107 cm−1 (C–O–H), 1182 cm−1 (PO2−) and 1016 and 962 cm−1 (P–O–H),32,33 indicating the successful occurrence of the salt reaction between ME and PA⋯PER H-bonded complex intermediate.
N), 1518 and 1404 cm−1 (ring from ME), 1244 and 1107 cm−1 (C–O–H), 1182 cm−1 (PO2−) and 1016 and 962 cm−1 (P–O–H),32,33 indicating the successful occurrence of the salt reaction between ME and PA⋯PER H-bonded complex intermediate.
Fig. 11 shows the TGA results of the prepared MPPR with different PA/PER/ME molar ratio. It can be seen that in the full range of the test temperature, the prepared MPPR with PA/PER/ME molar ratio of 2.5![[thin space (1/6-em)]](https://www.rsc.org/images/entities/char_2009.gif) :
:![[thin space (1/6-em)]](https://www.rsc.org/images/entities/char_2009.gif) 1.0
1.0![[thin space (1/6-em)]](https://www.rsc.org/images/entities/char_2009.gif) :
:![[thin space (1/6-em)]](https://www.rsc.org/images/entities/char_2009.gif) 1.5 and 2.5
1.5 and 2.5![[thin space (1/6-em)]](https://www.rsc.org/images/entities/char_2009.gif) :
:![[thin space (1/6-em)]](https://www.rsc.org/images/entities/char_2009.gif) 1.0
1.0![[thin space (1/6-em)]](https://www.rsc.org/images/entities/char_2009.gif) :
:![[thin space (1/6-em)]](https://www.rsc.org/images/entities/char_2009.gif) 2.0 show the similar thermal stability and decomposition mode. Both TG curves have one decomposition step and the similar char yield (36.2%). However, comparatively, MPPR with PA/PER/ME molar ratio of 2.5
2.0 show the similar thermal stability and decomposition mode. Both TG curves have one decomposition step and the similar char yield (36.2%). However, comparatively, MPPR with PA/PER/ME molar ratio of 2.5![[thin space (1/6-em)]](https://www.rsc.org/images/entities/char_2009.gif) :
:![[thin space (1/6-em)]](https://www.rsc.org/images/entities/char_2009.gif) 1.0
1.0![[thin space (1/6-em)]](https://www.rsc.org/images/entities/char_2009.gif) :
:![[thin space (1/6-em)]](https://www.rsc.org/images/entities/char_2009.gif) 2.5 shows an obviously different decomposition behavior. Its TG curve has two decomposition steps (50–350 °C and 350–700 °C) and the obviously decreased char yield (23.5%). This could be attributed to the excessive melamine used, which decomposes at about 350 °C. It could be predicted that the rich carbon source contained MPPR with higher char yield would be advantageous to the enhancement of the flame retardant property. In addition, it is noticed that all MPPRs with different component ratio have the similar decomposition temperature at about 200 °C. This can completely meet the requirements of LDPE for the processing temperature before foaming. After optimization, the PA/PER/ME molar ratio of 2.5
2.5 shows an obviously different decomposition behavior. Its TG curve has two decomposition steps (50–350 °C and 350–700 °C) and the obviously decreased char yield (23.5%). This could be attributed to the excessive melamine used, which decomposes at about 350 °C. It could be predicted that the rich carbon source contained MPPR with higher char yield would be advantageous to the enhancement of the flame retardant property. In addition, it is noticed that all MPPRs with different component ratio have the similar decomposition temperature at about 200 °C. This can completely meet the requirements of LDPE for the processing temperature before foaming. After optimization, the PA/PER/ME molar ratio of 2.5![[thin space (1/6-em)]](https://www.rsc.org/images/entities/char_2009.gif) :
:![[thin space (1/6-em)]](https://www.rsc.org/images/entities/char_2009.gif) 1.0
1.0![[thin space (1/6-em)]](https://www.rsc.org/images/entities/char_2009.gif) :
:![[thin space (1/6-em)]](https://www.rsc.org/images/entities/char_2009.gif) 1.5 was used to prepare the flame retarded LDPE foam material.
1.5 was used to prepare the flame retarded LDPE foam material.
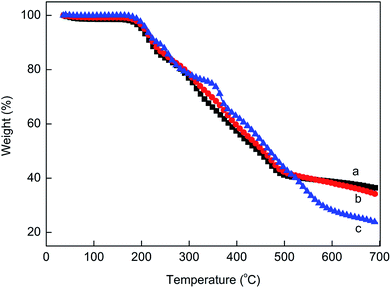 | ||
Fig. 11 The TG curves of the prepared MPPR intumescent flame retardant with different PA/PER/ME molar ratio: 2.5![[thin space (1/6-em)]](https://www.rsc.org/images/entities/char_2009.gif) : :![[thin space (1/6-em)]](https://www.rsc.org/images/entities/char_2009.gif) 1.0 1.0![[thin space (1/6-em)]](https://www.rsc.org/images/entities/char_2009.gif) : :![[thin space (1/6-em)]](https://www.rsc.org/images/entities/char_2009.gif) 1.5 (a), 2.5 1.5 (a), 2.5![[thin space (1/6-em)]](https://www.rsc.org/images/entities/char_2009.gif) : :![[thin space (1/6-em)]](https://www.rsc.org/images/entities/char_2009.gif) 1.0 1.0![[thin space (1/6-em)]](https://www.rsc.org/images/entities/char_2009.gif) : :![[thin space (1/6-em)]](https://www.rsc.org/images/entities/char_2009.gif) 2.0 (b) and 2.5 2.0 (b) and 2.5![[thin space (1/6-em)]](https://www.rsc.org/images/entities/char_2009.gif) : :![[thin space (1/6-em)]](https://www.rsc.org/images/entities/char_2009.gif) 1.0 1.0![[thin space (1/6-em)]](https://www.rsc.org/images/entities/char_2009.gif) : :![[thin space (1/6-em)]](https://www.rsc.org/images/entities/char_2009.gif) 2.5 (c). 2.5 (c). | ||
3.3 Flame retarded LDPE foam with H-bonded complex IFR
The obtained MPPR with a PA/PER/ME molar ratio of 2.5![[thin space (1/6-em)]](https://www.rsc.org/images/entities/char_2009.gif) :
:![[thin space (1/6-em)]](https://www.rsc.org/images/entities/char_2009.gif) 1.0
1.0![[thin space (1/6-em)]](https://www.rsc.org/images/entities/char_2009.gif) :
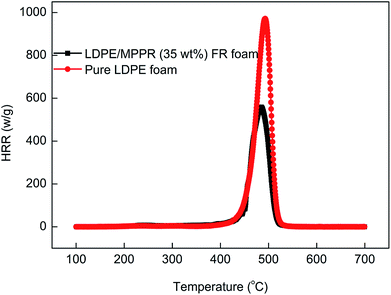
:![[thin space (1/6-em)]](https://www.rsc.org/images/entities/char_2009.gif) 1.5 was incorporated as an intumescent flame retardant to prepare the halogen-free flame retarded (FR) LDPE foam. The flame retardancy of the prepared FR LDPE foam was investigated by using UL94 horizontal burning test (ANSI/UL 94-2001 and ASTM D4986-10), LOI test and MCC test. The UL94 horizontal burning and LOI test results are listed in Table 3. As can be seen, the FR LDPE foam could reach HBF FR level and the LOI is 22.3% when the 35 wt% MPPR was added, while the pure LDPE foam fails in the horizontal burning test and the LOI is only 17.0%. As a laboratory-scale calorimeter, MCC can be conveniently used to investigate the flammability property of materials. Fig. 12 shows the temperature dependant heat release rate (HRR) curves obtained from MCC and the corresponding flammability parameters are also listed in Table 3. It can be seen that compared with pure LDPE foam, the FR LDPE foam has much smaller peak heat release rate (PHRR) and total heat release (THR) values (only 64.6% and 70.9% of the former, respectively). In addition, it is also noticed that the incorporation of MPPR dramatically decreases the heat release capacity (HRC) value. Above results show that the prepared FR LDPE foam with MPPR has the remarkably improved flame retardancy.
1.5 was incorporated as an intumescent flame retardant to prepare the halogen-free flame retarded (FR) LDPE foam. The flame retardancy of the prepared FR LDPE foam was investigated by using UL94 horizontal burning test (ANSI/UL 94-2001 and ASTM D4986-10), LOI test and MCC test. The UL94 horizontal burning and LOI test results are listed in Table 3. As can be seen, the FR LDPE foam could reach HBF FR level and the LOI is 22.3% when the 35 wt% MPPR was added, while the pure LDPE foam fails in the horizontal burning test and the LOI is only 17.0%. As a laboratory-scale calorimeter, MCC can be conveniently used to investigate the flammability property of materials. Fig. 12 shows the temperature dependant heat release rate (HRR) curves obtained from MCC and the corresponding flammability parameters are also listed in Table 3. It can be seen that compared with pure LDPE foam, the FR LDPE foam has much smaller peak heat release rate (PHRR) and total heat release (THR) values (only 64.6% and 70.9% of the former, respectively). In addition, it is also noticed that the incorporation of MPPR dramatically decreases the heat release capacity (HRC) value. Above results show that the prepared FR LDPE foam with MPPR has the remarkably improved flame retardancy.
| Sample | FR rating | LOI (%) | PHRR (w g−1) | Tpeak (°C) | THR (kJ g−1) | HRC (J g−1 K−1) |
|---|---|---|---|---|---|---|
| Pure LDPE foam | Failure | 17.0 | 971.5 | 493.0 | 37.0 | 984.0 |
| LDPE/MPPR (35 wt%) FR foam | HBF | 22.3 | 627.3 | 488.9 | 26.3 | 634.0 |
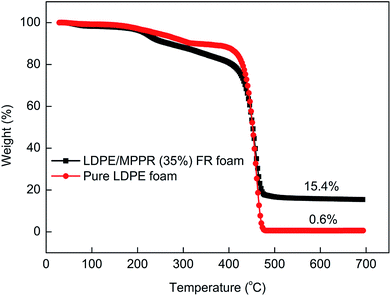
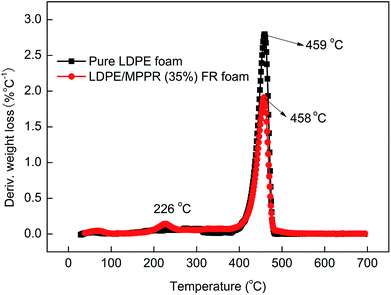
Fig. 13 shows the TG curves of pure LDPE foam and FR LDPE foam. Fig. 14 shows the corresponding DTG curves. As can be seen, the thermal degradation process of pure LDPE foam only has one step with only 0.62% char residue obtained at 700 °C, indicating that pure LDPE foam almost shows no charring capability. Comparatively, the thermal degradation behavior of FR LDPE foam is clearly different. In the range of 220–420 °C, the thermal stability of FR LDPE foam is lower than that of pure LDPE foam (the peak decomposition temperature appears at about 458 °C). However, the char yield of FR LDPE foam at 700 °C reaches 15.4%. This indicates that the MPPRs incorporated in LDPE foam is experiencing the char formation process through decomposition and playing their efficiently flame retarding role, which is also reflected in the corresponding DTG results (Fig. 14). As shown in Fig. 14, the incorporation of MPPR intumescent flame retardant significantly reduces the maximum thermal decomposition rate of pure LDPE foam (the former 2.80 versus the latter 1.91% per °C), indicating the high efficiency of the prepared MPPR. This is in agreement with the MCC result.
Fig. 15 compares the digital photos of the char residue of pure LDPE foam and FR LDPE foam with 35 wt% MPPR after horizontal burning test. It can be seen that the charring capability of FR LDPE with MPPR is remarkably enhanced. There are a large amount of char residues formed for the FR LDPE foam after burning, while there are no char residues formed for pure LDPE foam after burning. These formed char layers covered at the surface of the LDPE foam would protect the underlying foam matrix from being direct contact with the fire and prevent the flammable decomposition gases and oxygen from being exchanged, thus enhancing the flame retardancy of LDPE foam.
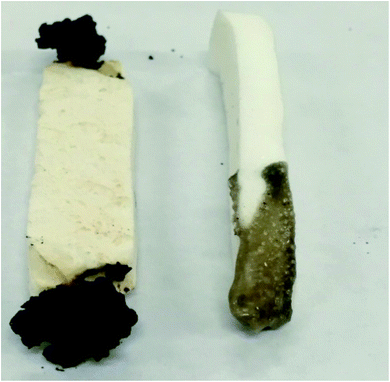 | ||
| Fig. 15 The digital photos of the burned FR LDPE foam and pure LDPE foam after horizontal burning test. | ||
4. Conclusion
Different from the conventional method, in this paper the combination of the supramolecular complexation with the salt reaction was proposed to synthesize the single-component IFR MPPR by first forming the hydrogen (H)-bonds between phosphoric acid (PA) and pentaerythritol (PER) in aqueous solution and then reacting with melamine. The FT-IR characterization and the two-dimensional correlation infrared spectroscopic analysis were used to investigate the H-bonded complexation reaction between PA and PER and also the prepared H-bonded complex intermediate. The obtained MPPR was finally used to impart a good flame retardancy to LDPE foam. The FT-IR and 2D correlation analyzes verifies the existence of the H-bonds between PA and PER, of which however, the strength is different from that of H-bonds in PA and PER themselves. The strength of H-bonds in the obtained H-bonded complex intermediate PA⋯PER is higher than that of H-bonds in PA but lower than that of H-bonds in PER. The proper PA/PER molar ratio could help to maintain the good solubility of PER in system and the stability of the formed H-bonds. The reaction temperature shows an important influence on the formation of H-bonds in system. The increase of temperature is not beneficial to the formation of H-bonds between PA and PER. Too high temperature would even lead to the destruction in the formed H-bonds. 2D infrared correlation investigation verifies that with increasing temperature, in the formed PA⋯PER H-bonded complex intermediate, the H-bonded –OH, C–O–H and P–O–H groups tend to be disassociated to form the free ones. If the temperature is increased to the range of 150–210 °C, the free P–O–H and C–O–H groups would further react with each other (esterification reaction) to form the cyclized P–O–C group (ester product of PA and PER). The UL 94 horizontal burning test, MCC analysis and the digital photo of char residues show that the incorporated salt product of PA⋯PER H-bonded complex intermediate and melamine obviously enhances the flame retardant property of LDPE foam and shows the good application prospect.Acknowledgements
This work is supported by the National Key Research and Development Program of China (2016YFB0302101), the Project of State Key Laboratory of Polymer Materials Engineering (Sichuan University) (sklpme2016-2-01) and the Research Fund for the Doctoral Program of Higher Education (20120181130010).References
- H. Tramm, C. Clar, P. Kühnel and W. Schuff, US Pat., 2106938, 1938.
- X. Chen, T. Sun and X. Cai, J. Therm. Anal. Calorim., 2014, 115, 185–191 CrossRef CAS.
- R.-M. Li, C. Deng, C.-L. Deng, L.-P. Dong, H.-W. Di and Y.-Z. Wang, RSC Adv., 2015, 5, 16328–16339 RSC.
- L.-P. Dong, C. Deng, R.-M. Li, Z.-J. Cao, L. Lin, L. Chen and Y.-Z. Wang, RSC Adv., 2016, 6, 30436–30444 RSC.
- G. Camino, L. Costa and G. Martinasso, Polym. Degrad. Stab., 1989, 23, 359–376 CrossRef CAS.
- R. Delobel, M. L. Bras, N. Ouassou and F. Alistiqsa, J. Fire Sci., 1990, 8, 85–108 CrossRef CAS.
- G. Camino, G. Martinasso and L. Costa, Polym. Degrad. Stab., 1990, 27, 285–296 CrossRef CAS.
- C. Y. Ming and N. H. R. Sulong, Mater. Des., 2012, 34, 719–724 CrossRef.
- U. Ewers, D. Boening, J. Albrecht, R. Rädel, G. Peter and T. Uthoff, Polym. Int., 2015, 48, 264–270 Search PubMed.
- S. Bourbigot, M. L. Bras, R. Delobel, P. Bréant and J. M. Trémillon, Carbon, 1995, 33, 283–294 CrossRef CAS.
- S. H. Chiu, W. K. Wang, S. H. Chiu and W. K. Wang, Polymer, 1998, 39, 1951–1955 CrossRef CAS.
- M. Le Bras, S. Bourbigot, G. Camino and R. Delobel, Fire retardancy of polymers: the use of intumescence, Elsevier, 1998 Search PubMed.
- S. Bourbigot, M. Le Bras, S. Duquesne and M. Rochery, Macromol. Mater. Eng., 2004, 289, 499–511 CrossRef CAS.
- Y. Halpern, D. M. Mott and R. H. Niswander, Ind. Eng. Chem. Prod. Res. Dev., 1984, 23, 233–238 CrossRef CAS.
- Z. Ma, W. Zhao, Y. Liu and J. Shi, J. Appl. Polym. Sci., 1997, 63, 1511–1515 CrossRef CAS.
- O. Y. Xiang, Proceedings of American FRCA conference, Lancaster, 1997 Search PubMed.
- Y. Liu and Q. Wang, Polym. Degrad. Stab., 2006, 91, 2513–2519 CrossRef CAS.
- Q. Wang, Y. Chen, Y. Liu, H. Yin, N. Aelmans and R. Kierkels, Polymer Int., 2004, 53, 439–448 CrossRef CAS.
- Y. Chen, Y. Liu, Q. Wang, H. Yin, N. Aelmans and R. Kierkels, Polym. Degrad. Stab., 2003, 81, 215–224 CrossRef CAS.
- F. Zhang, W. Sun, Y. Wang and B. Liu, J. Appl. Polym. Sci., 2015, 132, 42148 Search PubMed.
- Kazufumi, Japan Pat., 2073835, 1990.
- Y. Yukiko, Japan Pat., 3234742, 1991.
- NisNishioka and Takeshi, Japan Pat., 59109531, 1984.
- I. Kazuyoshi, Japan Pat., 9077894, 1997.
- T. Masaki, Japan Pat., 7179640, 1997.
- K. Kaji, I. Yoshizawa, C. Kohara, K. Komal and M. Hatada, J. Appl. Polym. Sci., 1994, 51, 841–853 CrossRef CAS.
- Y. Koji and M. Shusaku, Japan Pat., 2001059038, 2001.
- S. K. Choi, B. W. Jo, S. C. Moon and Y. S. Choi, J. Nanosci. Nanotechnol., 2008, 8, 5610–5613 CrossRef CAS PubMed.
- J. Luo, T. Zhou, X. Fu, H. Liang and A. Zhang, Eur. Polym. J., 2011, 47, 230–237 CrossRef CAS.
- S. Pasban, H. Raissi and F. Mollania, J. Mol. Liq., 2016, 215, 77–87 CrossRef CAS.
- I. Noda, A. Dowrey, C. Marcott, G. Story and Y. Ozaki, Appl. Spectrosc., 2000, 54, 236A–248A CrossRef CAS.
- M. Keyhani and V. Krishnan, Thermal response of a decomposing polymer, ASME-Publications-HTD, 1993, vol. 240, p. 35 Search PubMed.
- A. Balabanovich, Thermochim. Acta, 2005, 435, 188–196 CrossRef CAS.
| This journal is © The Royal Society of Chemistry 2017 |

