 Open Access Article
Creative Commons Attribution 3.0 Unported Licence
Holistic methodology for characterisation of the thermally induced failure of commercially available 18650 lithium ion cells
Michael Lammer *,
Alexander Königseder and
Viktor Hacker
Institute of Chemical Engineering and Environmental Technology, University of Technology Graz, Inffeldgasse 25/C/II, 8010 Graz, Austria. E-mail: michael.lammer@tugraz.at; Tel: +43 316 873 8795
First published on 4th May 2017
Abstract
An innovative approach to holistic analysis of thermally induced battery failure has been developed. A purpose-built test rig with high reproducibility within the specific setup produces reliable experimental data. Thermal ramp experiments at a defined state of charge are conducted on three types of commercial lithium ion batteries of the 18650 format. Thermally induced cell break-down is detected by temperature measurement on the cell surface. These failure scenarios comprise the venting of gas and particles and the exothermic process of thermal runaway. The tests showed heat emissions of up to 31 kJ during the final phase, with the battery surface reaching up to 877 °C. The release of gas is continuously logged and analysed by micro-GC. The main components are flammable and, due to the high concentration of CO of up to 61.4%, highly toxic. The maximum total gas emission during the deflagration of the cell was 5495 cm3.
1 Introduction
Lithium ion batteries are employed in a wide field of applications. From portable electronic devices and e-mobility up to stationary storage systems, this technology is used due to its reliability and high power density for energy storage by numerous charge/discharge cycles. However, high power density also imposes increased danger in case of failure. Public opinion on and general acceptance of this energy storage technology is directly related to safety and risks during operation. Catastrophic battery malfunction also heavily affects the attitude towards the final products powered by these cells, turning battery monitoring in combination with risk assessment to a key competence area for safe operation.As batteries contain fuel and oxidiser within one sealed compartment, understanding fire hazards is of great importance.1,2 Organic electrolytes and temperature sensitive electrode materials require elaborated heat management systems in battery packs.3,4 Under operating conditions Joule heat is generated within the cell.5,6 This heat has to be dispersed by the cell in order to maintain its temperature. Excess heat from internal short circuits or external influence eventually leads to critical conditions.7–10 Evaporation of electrolyte and gas formation from thermally induced decomposition pressurise the battery. Though pressure relief from integrated safety vents may prevent cell rupture, the emission of flammable vapour and gas still poses a safety risk.3,11 Full scale exothermic degradation of the battery components releases reactive substances like oxygen, carbon monoxide and previously intercalated lithium.12–14 The emission of heat poses an obvious threat to cells nearby, thus endangering the whole battery pack and system.
Calorimetric assessment of battery components and complete cells has been performed recently by several groups.4,15–20 This method is widely used for characterisation of thermally induced reactions of unstable substances, making it useful for this kind of investigation of batteries. Using adiabatic calorimetry allows the prediction of thermal hazards in large scale applications.4 As lithium ion cells are complex systems, calorimetric analysis on them is a challenging task. Specialised or custom made equipment is used for characterisation of the thermal response.15,17,19 Cone calorimeters are employed for characterising the burning characteristics, i.e. the thermal degradation and heat release under air atmosphere.7,20 These tests are commonly performed on the basis of single cells or small battery packs, but also fire tests on vehicle scale are performed.21,22
Previously conducted studies on thermal ramp tests provided the framework for the new and improved test setup presented within this paper. Measuring the pressure increase in the test container has been used for determination of the amount of vent gas. Withdrawing gas samples after the thermal ramp test gave a cumulative overview of the released gases.14,23–25
This work focuses on determination of thermal degradation of small cylindrical cells (18650 format) using a custom made test rig for holistic experiments. Heat is provided by an electric resistance furnace. The response to the external heat influx is determined by evaluation of the heat consumed and released during critical events like venting and exothermic failure. The quasi-adiabatic nature of these events allows the calorimetric quantification of the heat of reaction.3 The identification of critical self-heating rates indicates the transition into degradative processes and thermal runaway. A system for reproducible and accurate gas sampling at ambient pressure allows for analysis and quantification of the vent gas at certain points of interest. Using this improved technique, the gas emission is investigated in a temporally resolved way. Valuable insights into the degradation of battery components and safety issues such as toxicity and pressure evolution are gained by this test method.
2 Experimental
2.1 Anatomy of the thermal ramp test
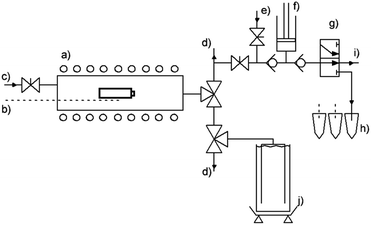
Three types of commercial, state of the art 18650 Li-ion cells are charged to 100% state of charge according to the manufacturer's data sheet using a CC/CV charging routine. After removing the plastic sheet the cell's mass is determined. Three thermocouples are secured on the cell surface by a sheet of glass fibre cloth. The gas sampling device is prepared by flushing the sample vials and syringe pump with argon. The tubular reactor itself is also flushed with inert gas to prevent reactions with ambient gases. Additional thermocouples are located on the sample holder and reactor wall. A schematic overview of the test rig is depicted in Fig. 1.The furnace is preheated to 80 °C, then slow and continuous heating (thermal ramp 0.5 °C min−1) is performed for the duration of the experiment i.e. until the deflagration of the cell. Elevated temperature initiates degradation reactions and phase transitions, leading to the pressure build-up within the battery can. Upon reaching a certain temperature, the first venting incident occurs. During this event, the built-in safety rupture disk releases excess pressure from the cell. Gas samples are withdrawn at this point automatically by a syringe pump. These samples are consecutively fed into argon filled GC-vials for the ex situ analysis via GC (Agilent micro-GC 3000A). Further heating leads to the decomposition of the electrode material and eventually to thermal runaway. This exothermic event is characterised by large emission of gas and particles and a sharp increase of the cell temperature to over 870 °C. The characteristic events are detected by changes of the cell's temperature heating rate. The amount of vent-gas is quantified by displacement of water from corresponding vessels. The displaced liquid is continuously quantified by weighing and the amount of gaseous emission is calculated.
2.2 Test procedure
The cells used in this work are of comparable nominal capacity and cell chemistry (Table 1). The cells are suitable for high power and high energy applications, making them favourable for e-mobility applications. All experiments were conducted with fully charged cells (State of Charge, SoC = 100%). The cells were conditioned on a BaSyTec Battery Test System (BaSyTec GmbH). The electrode material (lithium nickel cobalt aluminium oxide – NCA) is not thermally stable and releases oxygen at elevated temperatures, thus promoting degenerative reactions.18,26 There are no manufacturer data available on anode composition, electrolyte and additives. According to an investigation by Spotnitz and Franklin,12 the main contribution towards thermal runaway is made by the positive electrode and electrolyte decomposition. The carbonic anodes mainly release intercalated lithium during thermal degradation. The lithium consequently reacts with the organic solvent or fluorinated binder forming hydrocarbons and Li2CO3 or LiF respectively. The thermal impact of these negative electrode degradation reactions is largely negligible.| Device | Cathode material | Nominal capacity/mA h | Cell mass/g | Maximum discharge current/mA |
|---|---|---|---|---|
| ICR18650-32A | LiNi0.8Co0.15Al0.05O2 | 3200 | 48.62 ± 0.03 | 6400 |
| INR18650-35E | LiNi0.8Co0.15Al0.05O2 | 3500 | 47.68 ± 0.03 | 8000 |
| INR18650MJ1 | LiNi0.8Co0.15Al0.05O2 | 3500 | 46.35 ± 0.09 | 10![[thin space (1/6-em)]](https://www.rsc.org/images/entities/char_2009.gif) 000 000 |
2.3 Evaluation of the thermal events
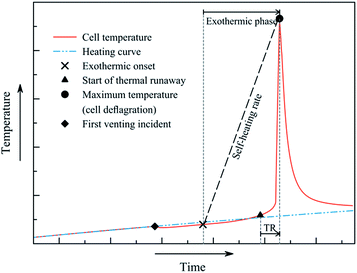
All cells show approximately similar characteristics during the thermal ramp test (Fig. 2). At temperatures above 120 °C, the degradation of electrolyte and separator produces gaseous products and the critical cell pressure is reached. The safety rupture disk implemented within the positive terminal releases the pressurised gas. The resulting Joule–Thomson cooling initiates a drop in cell temperature. The external heating initiates the following processes and consequently the thermal runaway. The event of thermal runaway is defined at a heating rate of 2 °C min−1 or more. As the can is open at this point, gas is released continuously. The final phase of the thermal runaway (TR) – the deflagration of the cell – is observable as the temperature increases sharply to over 800 °C.The characteristic events occur at quasi-adiabatic conditions,3,4 thus allowing the calculation of the respective amount of produced heat. The relative temperatures during cooling and self-heating were determined by relating the cell temperatures to the heating ramp (Fig. 2). A negative relative temperature i.e. a cooling process corresponded to energy taken up by the event. The occurrence of positive relative temperature i.e. a self-heating process was related to the emission of heat from the battery. Cell deflagration is associated with intense heat release. Beyond this event, the cell is cooling down due to the temperature gradient.
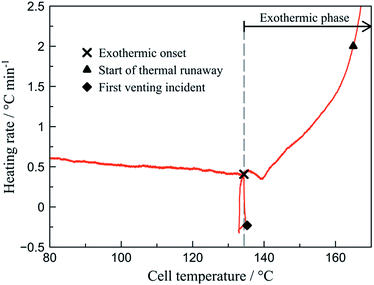
By analysing the rate plot (dT/dt vs. T) the characteristic points are identified (Fig. 3). Initiation of the exothermic phase (exothermic onset – Tonset) is determined as the point of inflexion in the rate curve at around 135 °C. This is associated to the increasing self-heating rate opposed to the decreasing heating of the external heat source. The self-heating rate is considered safety relevant1,27 and is averaged over the progress of the total exothermic phase.
2.4 Determination of the vent gas composition and amount
The released gas (vent gas) displaces water from a system of communicating vessels. Continuous weighing of the displaced fluid was performed to quantify the amount of vent gas. Picking gas samples at characteristic points (Fig. 2) is performed automatically. Characterisation of the samples is performed by use of an Agilent micro-GC 3000A. Gas emissions were quantified at standard ambient temperature and pressure (SATP conditions). Whereas the first venting mainly releases CO2 as non-condensing emission, later venting at higher temperature emits a wide variety of gaseous products.3 Results and discussion
None of the oxygen released from the active material could be determined directly by GC. Supposedly the oxygen reacts directly within the battery forming secondary products detectable by gas chromatography.The heat consumed during the first venting offers insight into battery safety. By releasing gas from the previously sealed can, the cell temperature drops up to 4 °C (first venting incident – Fig. 2). This might prevent thermal runaway in case of internal failure.28 The maximum energy consumption was observed at INR18650-35E. The gas emission at this event consisted mainly of CO2 from thermal degradation of the SEI layer and consecutive conversion of the electrolyte component ethylene carbonate on contact with the electrode.24,29 This fact is associated to the increased oxygen release18,24–26 from the cathode material in its partly lithiated state. By the thermally promoted transitions from a layered system to a particulate rock-salt system oxygen is made available for further degradation reactions.26,30 These include the exothermic reaction with carbonaceous species, releasing CO and CO2 at high temperatures.
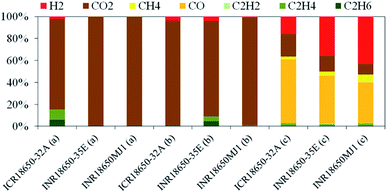
ICR18650-32A also released C2H6, C2H4 and H2 in significant concentrations. The hydrocarbons may derive from the decomposition of the SEI.3,21,31 Hydrogen is the product of the reduction of water deriving from combustion reactions by CO or free lithium. The average vent gas composition is shown in Fig. 4 and Table 2 respectively. The vent gas composition at this stage was similar in all the tested batteries. Up to 5495 cm3 (INR18650-35E) of gas were released from the batteries. A maximum proportion of CO of 48% (ICR18650-32A) and H2 of 43% (INR18650MJ1) were measured in the vent gas during thermal runaway. Main source of CO is the reaction of carbonaceous material with oxygen released from the cathode material.
| Event | Device | Emission/mmol | Emission/cm3 | H2/% | CO2/% | CH4/% | CO/% | C2H2/% | C2H4/% | C2H6/% |
|---|---|---|---|---|---|---|---|---|---|---|
| 1st venting | ICR18650-32A | 3.69 | 90.30 | 2.43 | 82.19 | 0.00 | 0.00 | 0.00 | 9.32 | 6.06 |
| INR18650-35E | 6.20 | 151.70 | 0.00 | 100.00 | 0.00 | 0.00 | 0.00 | 0.00 | 0.00 | |
| INR18650MJ1 | 1.64 | 40.10 | 0.00 | 100.00 | 0.00 | 0.00 | 0.00 | 0.00 | 0.00 | |
| Thermal runaway | ICR18650-32A | 0.22 | 5.40 | 3.71 | 95.56 | 0.00 | 0.00 | 0.00 | 0.74 | 0.00 |
| INR18650-35E | 0.00 | 0.00 | 3.87 | 87.24 | 0.00 | 0.00 | 0.00 | 4.20 | 4.70 | |
| INR18650MJ1 | 0.24 | 5.80 | 0.87 | 98.06 | 0.00 | 0.00 | 0.00 | 1.07 | 0.00 | |
| Deflagration | ICR18650-32A | 125.84 | 3078.80 | 15.94 | 20.40 | 2.50 | 58.41 | 0.22 | 2.44 | 0.09 |
| INR18650-35E | 224.60 | 5494.90 | 35.68 | 14.50 | 3.66 | 44.00 | 0.14 | 1.95 | 0.06 | |
| INR18650MJ1 | 215.03 | 5260.90 | 43.15 | 9.76 | 6.97 | 37.22 | 0.16 | 2.69 | 0.06 |
Table 3 summarises the amounts of heat consumed and released during the thermal ramp experiments as well as corresponding exothermic onset and the temperature of the beginning of the thermal runaway. Thermal characterisation was performed during all of the experiments, thus allowing precise statistical evaluation. The heat release and self-heating rate for all cells was similar. ICR18650-32A reached the highest maximum temperature due to its high exothermic heat output. INR18650MJ1 showed the lowest maximum temperature – 59% of exothermic heat compared to ICR18650-32A. The strongest Joule–Thomson cooling was observed on INR18650-35E – nearly 150% of endothermic energy compared to the other cells under test. Compared to INR18650MJ1, ICR18650-32A takes 43% longer (additional 57 min) to undergo deflagration after the initiation of exothermic events. The heating rate over the exothermic phase is comparable; the length of this phase varies. As indicated by gas analysis, most of the degradative processes occur within this phase, emphasising the safety relevance of this period.
| Cell | Qvent/J | QTR/J | Tmax/°C | Tonset/°C | TTR/°C | Rate/°C min−1 | Duration/min |
|---|---|---|---|---|---|---|---|
| ICR18650-32A | −69.75 ± 6.56 | 29![[thin space (1/6-em)]](https://www.rsc.org/images/entities/char_2009.gif) 488.70 ± 1760.94 488.70 ± 1760.94 |
744.80 ± 57.56 | 96.79 ± 2.13 | 167.13 ± 2.42 | 4.96 ± 0.44 | 130.78 ± 3.35 |
| INR18650-35E | −135.83 ± 26.99 | 23![[thin space (1/6-em)]](https://www.rsc.org/images/entities/char_2009.gif) 681.63 ± 2737.52 681.63 ± 2737.52 |
631.29 ± 85.85 | 107.22 ± 5.56 | 158.00 ± 1.26 | 5.19 ± 1.20 | 105.18 ± 12.63 |
| INR18650MJ1 | −68.85 ± 9.34 | 17![[thin space (1/6-em)]](https://www.rsc.org/images/entities/char_2009.gif) 319.47 ± 2256.38 319.47 ± 2256.38 |
496.05 ± 71.52 | 107.21 ± 2.75 | 151.32 ± 3.04 | 5.29 ± 1.09 | 74.06 ± 7.07 |
4 Conclusion and outlook
The holistic approach for the thermal ramp experiments proved to generate reproducible results and to be effective in use. Continuous measurements of the cell temperature have been a simple yet effective way of determining and interpreting the main events of the thermal ramp experiment. Displacement of liquid water by the vent gas emission during the thermal runaway offered a reliable way of measuring the gas release without pressurisation of the reactor. Operating the system at ambient pressure allows precise gas sampling at certain points of interest, thus providing temporally resolved emission characterisation. By calculating the rate of temperature change, the onset of the exothermic reactions and the beginning of the thermal runaway, defined by a temperature change above 2 °C min−1, had been detected and statistically certified. Characterisation of the heat dissipated during the first venting incident and the thermal runaway combined with the analysis of gases released at these events allowed for further insight and safety considerations. The intense heat release poses a direct threat to people and equipment working with the device. The emission of large quantities of flammable gases, mainly H2 and CO, intensifies the hazard of fire under these conditions.The amount of gas reached a maximum of 5494.90 cm3 for the cell INR18650-35E. Even though the cathode material and the nominal capacity of the cells are similar, the results vary drastically. The cell type with the lowest nominal capacity (ICR18650-32A; 3200 mA h) produces the highest heat emission of approx. 30 kJ at the lowest onset temperature of approx. 97 °C, signifying a very volatile system reaching a maximum temperature of approx. 745 °C. On the other hand it showed a protracted exothermic phase lasting 130 min, offering time for intervention in case of malfunction. This signifies the superiority of INR18650-35E, which exhibits a higher onset temperature at approx. 107 °C and a lower maximum temperature of 631 °C. Furthermore, it dissipated additional 50% of heat during venting. This total dissipation of approx. −136 J increases the possibility of terminating detrimental reactions resulting from self-heating. INR18650MJ1 offered a comparable exothermic onset and thermal runaway temperature but inferior Joule–Thomson cooling of −69 J. The heat emission during thermal runaway (approx. 17.5 kJ) and the maximum temperature were the lowest determined in this study. Lower heat emission reduces the hazards within a confined battery pack, exposing neighbouring cells to less heat in case of catastrophic malfunction. This diminishes the risk of a thermally induced battery failure propagating through the system.
Acknowledgements
The financial support of the project ISALIB by the Austrian Ministry of Transport, Innovation and Technology (BMVIT) and The Austrian Research Promotion Agency (FFG) through the program “Mobilität der Zukunft” (2014–2017) and the co-operation of our project partners Kompetenzzentrum – Das virtuelle Fahrzeug, Graz and Samsung SDI, Graz is gratefully acknowledged.References
- D. H. Doughty and A. A. Pesaran, Vehicle Battery Safety Roadmap Guidance, National Renewable Energy Laboratory, 2012 Search PubMed
.
- T. H. Dubaniewicz and J. P. DuCarme, IEEE Trans. Ind. Appl., 2013, 49, 2451–2460 CrossRef CAS PubMed
.
- Q. Wang, P. Ping, X. Zhao, G. Chu, J. Sun and C. Chen, J. Power Sources, 2012, 208, 210–224 CrossRef CAS
.
- C. Y. Jhu, Y. W. Wang, C. Y. Wen and C. M. Shu, Appl. Energy, 2012, 100, 127–131 CrossRef CAS
.
- T. Waldmann, S. Gorse, T. Samtleben, G. Schneider, V. Knoblauch and M. Wohlfahrt-Mehrens, J. Electrochem. Soc., 2014, 161, A1742–A1747 CrossRef CAS
.
- M. Ecker, N. Nieto, S. Käbitz, J. Schmalstieg, H. Blanke, A. Warnecke and D. U. Sauer, J. Power Sources, 2014, 248, 839–851 CrossRef CAS
.
- Y. Fu, S. Lu, K. Li, C. Liu, X. Cheng and H. Zhang, J. Power Sources, 2015, 273, 216–222 CrossRef CAS
.
- T. D. Hatchard, D. D. MacNeil, D. A. Stevens, L. Christensen and J. R. Dahn, Electrochem. Solid-State Lett., 2000, 3, 305–308 CrossRef CAS
.
- P. Ping, Q. Wang, P. Huang, K. Li, J. Sun, D. Kong and C. Chen, J. Power Sources, 2015, 285, 80–89 CrossRef CAS
.
- T. M. Bandhauer, S. Garimella and T. F. Fuller, J. Electrochem. Soc., 2011, 158, R1 CrossRef CAS
.
- P. Keil and A. Jossen, in EVS28 International Electric Vehicle Symposium and Exhibition, 2015, pp. 1–11 Search PubMed
.
- R. Spotnitz and J. Franklin, J. Power Sources, 2003, 113, 81–100 CrossRef CAS
.
- C. R. Birkl, M. R. Roberts, E. Mcturk, P. G. Bruce and D. A. Howey, J. Power Sources, 2016, 341, 1–35 Search PubMed
.
- D. Doughty and E. P. Roth, Electrochem. Soc. Interface, 2012, 37–44 CrossRef CAS
.
- X. Liu, S. I. Stoliarov, M. Denlinger, A. Masias and K. Snyder, J. Power Sources, 2015, 280, 516–525 CrossRef CAS
.
- E. Schuster, C. Ziebert, A. Melcher, M. Rohde and H. J. Seifert, J. Power Sources, 2015, 286, 580–589 CrossRef CAS
.
- X. Feng, M. Fang, X. He, M. Ouyang, L. Lu, H. Wang and M. Zhang, J. Power Sources, 2014, 255, 294–301 CrossRef CAS
.
- S. K. Martha, O. Haik, E. Zinigrad, I. Exnar, T. Drezen, J. H. Miners and D. Aurbach, J. Electrochem. Soc., 2011, 158, A1115 CrossRef CAS
.
- G. Nagasubramanian and K. Fenton, Electrochim. Acta, 2013, 101, 3–10 CrossRef CAS
.
- F. Larsson, P. Andersson, P. Blomqvist, A. Lorén and B.-E. Mellander, J. Power Sources, 2014, 271, 414–420 CrossRef CAS
.
- N. S. Spinner, C. R. Field, M. H. Hammond, B. A. Williams, K. M. Myers, A. L. Lubrano, S. L. Rose-Pehrsson and S. G. Tuttle, J. Power Sources, 2015, 279, 713–721 CrossRef CAS
.
- A. Lecocq, M. Bertana, B. Truchot and G. Marlair, in 2. International Conference on Fires in Vehicles, 2014 Search PubMed
.
- A. W. Golubkov, D. Fuchs, J. Wagner, H. Wiltsche, C. Stangl, G. Fauler, G. Voitic, A. Thaler and V. Hacker, RSC Adv., 2014, 4, 3633–3642 RSC
.
- A. W. Golubkov, S. Scheikl, R. Planteu, G. Voitic, H. Wiltsche, C. Stangl, G. Fauler, A. Thaler and V. Hacker, RSC Adv., 2015, 5, 57171–57186 RSC
.
- F. Larsson and B.-E. Mellander, J. Electrochem. Soc., 2014, 161, A1611–A1617 CrossRef CAS
.
- Y. Huang, Y.-C. Lin, D. M. Jenkins, N. A. Chernova, Y. Chung, B. Radhakrishnan, I.-H. Chu, J. Fang, Q. Wang, F. Omenya, S. P. Ong and M. S. Whittingham, ACS Appl. Mater. Interfaces, 2016, 8, 7013–7021 CAS
.
- M. Börner, A. Friesen, M. Grützke, Y. P. Stenzel, G. Brunklaus, J. Haetge, S. Nowak, F. M. Schappacher and M. Winter, J. Power Sources, 2017, 342, 382–392 CrossRef
.
- P. G. Balakrishnan, R. Ramesh and T. Prem Kumar, J. Power Sources, 2006, 155, 401–414 CrossRef CAS
.
- J. L. Tebbe, T. F. Fuerst and C. B. Musgrave, ACS Appl. Mater. Interfaces, 2016, 26664–26674 CAS
.
- E. Hu, S.-M. Bak, J. Liu, X. Yu, Y. Zhou, S. N. Ehrlich, X.-Q. Yang and K.-W. Nam, Chem. Mater., 2014, 26, 1108–1118 CrossRef CAS
.
- M. N. Richard and J. R. Dahn, J. Electrochem. Soc., 1999, 146, 2068–2077 CrossRef CAS
.
| This journal is © The Royal Society of Chemistry 2017 |


