 Open Access Article
Creative Commons Attribution 3.0 Unported Licence
A promising carbon fiber-based photocatalyst with hierarchical structure for dye degradation†
Chen Gu,
Sen Xiong,
Zhaoxiang Zhong *,
Yong Wang and
Weihong Xing*
State Key Laboratory of Materials-Oriented Chemical Engineering, National Engineering Research Center for Special Separation Membrane, Nanjing Tech University, Nanjing 210009, China. E-mail: njutzzx@163.com; xingwh@njtech.edu.cn
First published on 21st April 2017
Abstract
To fabricate a novel photocatalyst material with high efficiency, ZnO seeds were uniformly deposited on carbon fibers (CFs) via atomic layer deposition (ALD) followed by hydrothermal growth of ZnO nanorods (NRs). Then Pt particles were dispersed on ZnO NRs using the magnetron sputtering method, and the grain size of Pt particles was in the range of 2–5 nm. Significantly, the resultant Pt@ZnO NRs/CFs composites exhibited better photocatalytic performance than normal ZnO NR coated CFs as demonstrated in the degradation of methyl orange (MO) solution, which may be due to the synergistic effect between the Pt nanoparticles and ZnO NRs. After a period of light irradiation, the degradation rates of methyl orange (MO) dye solution are as follows: 72% for ZnO NRs/CFs and 99.8% for Pt@ZnO NRs/CFs. In addition, this novel hierarchical photocatalyst can be easily recycled with good performance and stability.
Introduction
Following the rapid development of social and economic sectors, water pollution has become one of many alarming concerns in recent years due to its impact on human health and the environment. Various mitigation methods have been used to minimize water pollution, including adsorption,1 flocculation, coagulation,2 and sedimentation. However, these methods cannot remove pollutants in water thoroughly, and could produce secondary contaminants. Photocatalysis holds great promise as a solution to water pollution problems without producing secondary pollution.3 Photocatalysts can thoroughly decompose contaminants with high efficiency and deactivate viruses in liquid.4–6 As is known, photocatalysts in powder form usually possess relatively high photocatalytic activity, due to their small size and large specific surface area. However, powders are difficult to recycle from suspension following a photocatalytic process, adding to secondary pollution and catalyst loss.7,8 To use photocatalysts in practical applications, the photocatalysts need to be immobilized or coated onto a substrate or pelleted for easy recovery.9Carbon fibers (CFs) is a new sort of flexible materials with good chemical resistance, superior electro conductivity and high mechanical strength.10–12 As its' high flexibility, it can be weaved to CFs cloth for large scale use to coat photocatalyst, which is critical for photocatalytic technology with nanostructure.13,14 Thus, CFs has been widely investigated as substrate in the field of nano-materials. Carbon fibers has been utilized in many fields including water treatment, gas purification and electrochemistry aspects.15–17 In the field of photocatalysis, CFs substrates were also used as a structured photo-catalytic support.18–20 Compared with other substrates, CFs is effective support and provide better photocatalytic performance. Hu et al. used sol–gel method to prepare ZnO-coated SiC ceramic with lower photo-catalytic properties, degrading methyl orange (MO) totally within 18 h.3 Considering the practicability and recycling, maintaining flexibility is crucial for catalysts, however, most of the current ceramic nanofiber-nanostructured catalyst composites are brittle with low deformation resistance capacity.21,22 CFs possessed the characteristic of flexibility could solve the problem to some extent. Several research has been studied to modify CFs with ZnO and other metal oxide. However, when served as photocatalysts, photocorrosion is one of the disadvantages that restricting the extensive application of ZnO, which is caused from the reduction of Zn2+ to Zn by photoinduced electrons at the surface of ZnO.23 Metallization is one among the many methods tried for the stabilization of photocatalysts to prevent the photocorrosion of ZnO.24 In this paper, Pt nanoparticles were deposited by magnetron sputtering, which is able to control the effective coverage, chemical state, and the size of the Pt nanoparticles. Followed by sputter deposition of a minimum amount of Pt onto ZnO leads to a catalytically enhanced photocatalytic properties whereas the corrosion process is drastically suppressed, since Pt nanoparticles serve as the reservoirs for electrons which are confined in the Pt nanoparticles.25 We believe that this is a new attractive research area to construct carbon-based catalytic materials with nanostructure for practical applications in the fields of catalysis, environmental remediation and energy. As is known to all, one defect of carbon fibers is its' small specific surface area, which is insufficient to load catalyst on carbon fibers substrate. ZnO with nanorod structure possess high specific surface area and large surface, which can increase specific surface area of original CFs for loading catalytic composition and enlarging contact areas with reactants.26 Furthermore, as a promising photocatalyst, ZnO can degrade many kinds of organic contaminants (for example, color dye: methyl orange, rhodamine B; colorless: p-chlorophenol).27,28 In another word, ZnO NRs can act as catalytic carrier and further improve catalytic efficiency when Pt nanoparticles was introduced as a result of the coupling effect with ZnO. Thereby, it is meaningful to synthesize and investigate this multifunctional material.29,30
In this study, ZnO nanorods were immobilized on CFs via an ALD (Atomic Layer Deposition) method combined with hydrothermal growth. ALD is used to uniformly seed ZnO on CFs substrate, and then well-aligned ZnO nanorods with certain widths and lengths were synthesized from the seeds under hydrothermal conditions. Then, Pt particles were uniformly dispersed on the ZnO nanorods by magnetron sputtering method. XRD, SEM, HRTEM, XPS, UV-vis spectrophotometry and photoluminescence (PL) emission spectra were adopted to characterize the composition, morphology, structure, and optical properties of the Pt@ZnO NRs/CFs. We also investigated the photo-catalytic properties of the samples to degrade dye solution, as well as the cycle performance and long term stability.
Experimental
Materials
Carbon fibers (CFs, T300-3k, Toray) with a diameter of 7 ± 1 μm were cut into a 4 cm length, and ultrasonicated in ethanol and deionized water for 1 h, respectively. The reactants of ALD were diethyzinc (Zn(C2H5)2, DEZ, Aladdin) and deionized water, which served as the source of zinc and oxygen, respectively. High purity N2 (99.99%) was used as the carrier and the purging gas. Hexamethylenetetramine (HTMA, C6H12N4) and zinc nitrate hydrate (Zn(NO3)2·6H2O) were purchased from Shanghai Lingfeng Chemical Co. All chemical reagents were of analytical grade and were used as received without further purification. Pt target of 99.99% purity was purchased from Beijing Gaodewei metal Co.Hydrothermal fabrication of ZnO nanorods on CFs
The steps of fabricating Pt@ZnO NRs/CFs composites are shown in Fig. 1. Firstly, deposition of ZnO seeding layers was carried out in a hot-wall ALD reactor (S100, Cambridge NanoTech). CFs were positioned in the ALD chamber preheated to 130 °C with both sides directly exposed to the nitrogen stream. The ALD reaction was initiated when the vacuum in the chamber reached 1 Torr. The DEZ precursor was heated to 40 °C while water was heated to 60 °C. These two precursor vapors were alternately delivered into the reaction chamber, and the exposure mode was used to allow the precursors to thoroughly diffuse and adsorb into the samples. A typical ALD cycle included (i) DEZ pulse for 1 s; (ii) exposure for 10 s; (iii) purge for 35 s; (iv) H2O pulse for 0.1 s; (v) exposure for 10 s; and (vi) purge for 35 s. The CFs were deposited for 300 cycles at 130 °C under a steady nitrogen flow rate of 20 sccm. Secondly, 35 ml aqueous solution with equimolar (5 mM) zinc nitrate and HMTA along with ZnO-ALD CFs were transferred into a 50 ml hydrothermal synthesis reactor and maintained at 90 °C for 3 h. Then the system was cooled to room temperature naturally. CFs coated with ZnO were washed twice with deionized water and dried at 60 °C for 6 h for characterization.Pt nanoparticles deposition by DC magnetron sputtering
Pt nanoparticles were deposited by DC magnetron sputtering (VTC-600-2HD, MTI, Shenyang) from a circular Pt target (d = 50 mm, 99.9% purity). CFs or ZnO NRs/CFs substrates were placed at the sample table with a rotation speed of 20 rpm to enable uniform film deposition. Before introducing the argon, the chamber was evacuated to base pressure of 10−3 Pa. The working pressure in the deposition chamber was 3.0 Pa and the working power was kept at 30 W. A film thickness detector (EQ-TM106) was used to confirm the deposition thickness of Pt nanoparticles. The temperature of whole deposition process was kept at room temperature.Characterizations
The X-ray diffraction patterns of as-prepared samples were recorded on a X-ray diffractometer (XRD, Mini Flex 600, Japan). The morphology and composition were analyzed by a field emission scanning electron microscope (FESEM, S-4800, Hitachi, Tokyo, Japan) and high resolution transmission electron microscope (HRTEM, JEOL JEM-2010). The UV-vis diffuse reflection spectra (DRS) of the samples were conducted on a spectrophotometer of Perkin Elmer Lambda 950 (USA). The photoluminescence (PL) emission spectra of the samples were performed with Varian Cary Eclipse spectrometer to investigate the recombination of photogenerated electrons/holes pairs in the photocatalysts. X-ray photoelectronic spectroscopy (XPS) measurement was performed with a Theta Probe XPS system (Thermo ESCALAB 250, USA) and assessed by means of the energy analyzer.Measurements of photo-catalytic activity
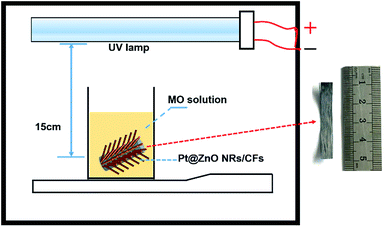
Their photocatalytic performance was evaluated by the degradation of MO solution at room temperature under UV-light irradiation of a UV lamp (LTD, 24 W, λ = 365 nm). To test the photo-catalytic property, a simple and easily operated photo-reactor device was constructed, as shown in Fig. 2. Firstly, MO solution was sit in a sealed black box for 1 h to ensure the establishment of adsorption–desorption equilibrium between photocatalyst and MO. After 1 h, the UV lamp was turned on, at the interval of 60 min, approximately 4 ml solution was collected each time and measured the absorbance at 463 nm by using a UV-vis spectrophotometer (OPIONAQUAMATE 7000). So we can use the intensity change of absorption at 463 nm to calculate the degradation rate. The degradation percentage of MO was calculated according to eqn (1):| R = (A0 − AX)/A0 × 100% | (1) |
Results and discussion
Microstructure and morphology
The crystalline phase of as-prepared samples was identified by X-ray diffraction (XRD) measurement. As shown in Fig. 3, the pure CFs have a broad diffraction peak at 25° which can be assigned as the d002 layers, representing the presence of integral graphite structure.8 Both ZnO seed layer and NRs exhibit the typical diffraction peaks of hexagonal wurtzite ZnO (JCPDS 36-1451), whose three main peaks appeared in the process of three steps which are attributed to (100), (002) and (101) planes at angles 2θ = 31.94°, 34.60° and 36.42°, respectively.31,32 Compared with ZnO NRs, the ZnO seeds show much weaker diffraction intensity. These strong and sharp diffraction peaks after hydrothermal process demonstrate that ZnO crystals have better crystallinity. In addition, the relative strong intensity of (002) planes of ZnO suggested the c-axis-oriented NRs.33,34 No characteristic peaks of Pt particles were detected in the diffraction patterns of the composite samples, indicating that Pt particles were in a highly dispersed state or the size of Pt nanoparticles is too small.35,36 In addition, in contrast to hydrothermal growth, weaker diffraction intensity of ZnO NRs also reveals the existence of Pt species.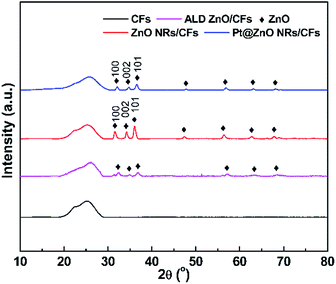 | ||
| Fig. 3 The XRD patterns of CFs, CFs after ALD, ALD ZnO after hydrothermal growth and Pt@ZnO NRs/CFs. | ||
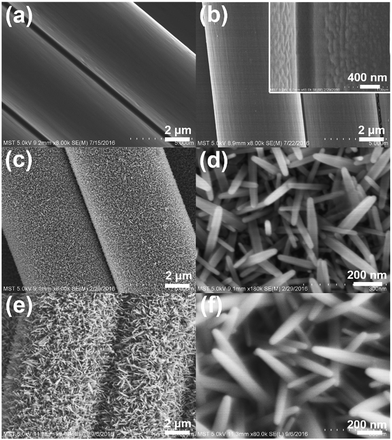
SEM images of each preparation stage of as-prepared samples are shown in Fig. 4. Fig. 4a shows the morphology of pure CFs. After ALD, a thin layer of ZnO seed are uniformly and compactly covered on the CFs substrates (Fig. 4b). Followed by hydrothermal growth, as shown in Fig. 4c, the ZnO NRs grown radially on the surface of pure CFs, with an average dimension of 20–30 nm diameter and 150–300 nm long, and nearly be vertical to carbon fiber. The regular hexagonal prism geometric shape at the peak of nanorods can be observed from high magnification SEM image (Fig. 4d). Fig. 4e and f shows that after deposition of Pt NPs by magnetron sputtering, the microstructure and morphology of Pt@ZnO NRs/CFs are almost the same as ZnO NRs/CFs, but the surface of ZnO nanorods become more texture. ZnO NRs play an important role of bonding layer between carbon fiber substrates and Pt nanoparticles, which provide more contact areas and active sites for photocatalysis.26
With the presence of the ZnO NRs on the CFs, the surface area of the filter increases from 2.7 m2 g−1 to 3.6 m2 g−1 for the pristine CFs (Fig. 5). ZnO NRs provide increased specific surface area for dye degradation, which also functioned as secondary catalytic carrier to deposit Pt nanoparticles, leading to improved degradation efficiency. Also, the BJH method was used to further demonstrate the pore size distribution. From the inset of Fig. 5, corresponding to the variable diameters on horizontal axis, the relative vertical intensity is so low even less than 0.001 cm3 g−1 nm−1, which reveals that the material is non-porous. The adhesion of ZnO NRs grown on CFs substrates was confirmed to be stable as the majority of the NRs were remained on the CFs after an ultrasonication oscillation treatment at 150 W for 10 min (Fig. S1†). This is because low interfacial energy provided by ZnO improve the diffusion and adhesion of the Pt nanoparticles on the surface of ZnO.37
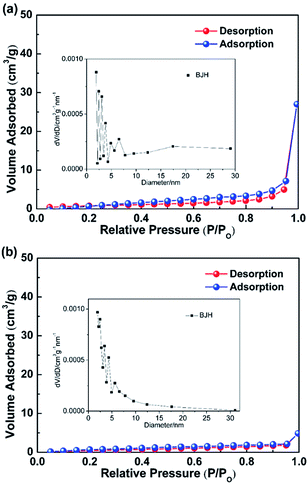 | ||
| Fig. 5 Nitrogen adsorption–desorption isotherms of the functionalized ZnO NRs/CFs (a) and the pristine CFs (b). | ||
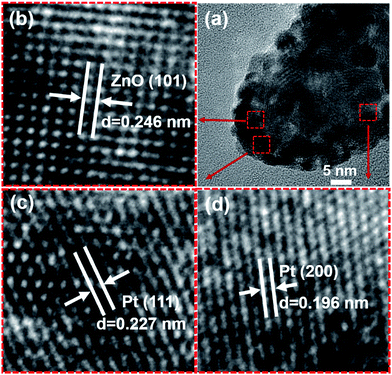
To confirm the structure and size of Pt nanoparticles after magnetron sputtering, sample of Pt@ZnO NRs/CFs was further investigated by HRTEM. It can be seen from Fig. 6a that the ZnO NRs coated on CFs have grain size ranging from 20 to 30 nm, which agrees well with SEM images (Fig. 4). Fig. 6a also shows that Pt cores around 2 nm were homogeneously loaded on the ZnO crystal. In addition, the high-resolution TEM image (Fig. 6b) reveals that the ZnO NRs are single crystal, and the lattice fringes with the distance of 0.246 nm corresponding to a crystal plane of (101) in ZnO were observed, which indicates the good crystallinity of ZnO after hydrothermal growth.38–40 Fig. 6c and d supports the fact that Pt metal was deposited on ZnO NRs after magnetron sputtering. The HRTEM images show that the lattice spacing of the indicated crystalline phase is 0.227 nm and 0.196 nm, corresponding to (111) and (200) lattice planes of Pt, respectively.41
The energy dispersive spectrometry (EDS) of as-prepared Pt@ZnO NRs/CFs in Fig. S2† further confirms the existence of Pt, Zn, C and O, while Cu comes from the copper grid used in the test. The peaks at 1.01, 8.64 and 9.57 keV belong to the Zn element. C, O elements respectively correspond to the peaks at 0.26 keV and 0.52 keV.39
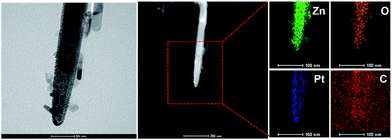
Elemental mappings (Fig. 7) analysis further reveals the relatively uniform distribution of ZnO throughout the CFs. The approximately 1![[thin space (1/6-em)]](https://www.rsc.org/images/entities/char_2009.gif) :
:![[thin space (1/6-em)]](https://www.rsc.org/images/entities/char_2009.gif) 1 atomic ratio of zinc and oxygen indicates that ZnO was successfully deposited on the CFs substrate.42 As shown in Fig. 7, the elemental Pt is homogeneously distributed among nanorods on the carbon fiber. In addition, the amount of Pt element is less than elemental O and Zn, which agrees with XRD results. In Fig. 7, full area of elemental C resulted from the use of CFs substrates.
1 atomic ratio of zinc and oxygen indicates that ZnO was successfully deposited on the CFs substrate.42 As shown in Fig. 7, the elemental Pt is homogeneously distributed among nanorods on the carbon fiber. In addition, the amount of Pt element is less than elemental O and Zn, which agrees with XRD results. In Fig. 7, full area of elemental C resulted from the use of CFs substrates.
XPS surface analysis of as-prepared samples
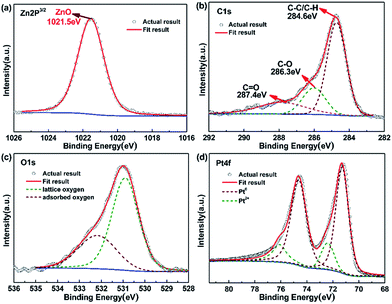
For a better understanding of chemical composition and structural information of Pt@ZnO NRs/CFs, XPS analysis was performed. Fig. S3† shows the XPS survey spectrum. The survey scan from 0 to 1200 eV shows multiple peaks corresponding to C, O, Zn and Pt, in accordance to EDS result. Fig. 8a–d are XPS spectra of the (a) Zn-2p, (b) C-1s, (c) O-1s and (d) Pt-4f core level regions of as-prepared samples, respectively. Fig. 8b shows a high-resolution XPS spectra of Zn 2p core level for samples, symmetrical peaks analyzed by fitting the Gaussian function were centered at 1021.5 eV, corresponding to Zn 2p3/2 binding energy from ZnO.30 The O 1s region of the XPS spectrum can be fitted by two peaks at 530.7 eV and 532.7 eV, as shown in Fig. 8d. According to the literature, the high intensity peak located at binding energy of 530.7 eV, is associated with lattice oxygen of ZnO and a small quantity of PtO, while the shoulder peak located at 532.7 eV can be attributed to the chemisorbed oxygen species (C–O, C![[double bond, length as m-dash]](https://www.rsc.org/images/entities/char_e001.gif) O) or hydroxyl oxygen on the surface of ZnO.43 Fig. 8b shows the distribution of carbon element. According to the analysis result, the binding energy of C 1s at 286.3 eV and 287.4 eV is the chemisorbed carbon species in the form of C–O and C
O) or hydroxyl oxygen on the surface of ZnO.43 Fig. 8b shows the distribution of carbon element. According to the analysis result, the binding energy of C 1s at 286.3 eV and 287.4 eV is the chemisorbed carbon species in the form of C–O and C![[double bond, length as m-dash]](https://www.rsc.org/images/entities/char_e001.gif) O, respectively, and the dominant peak at 284.5 eV is due to hydrocarbons (C–C/C–H) coming from CFs. The binding energies of 74.70 and 71.10 eV in Fig. 8e correspond to Pt(0) 4f5/2 and Pt(0) 4f7/2, respectively. Similarly, Pt(2) 4f5/2 and Pt(2) 4f7/2 peaks (Fig. 8e) appearing at 75.95 and 72.60 eV, which indicates the existence of valence states of Pt0 and Pt2+.44,45 This in turn confirms that Pt0 can be oxidized to Pt2+. At instantaneous high excitation voltage, Pt0 may reacts with oxygen under magnetron sputtering system to form PtO. The ratio of Pt0/Pt2+ is about 81.93/18.07 (Table S1†).
O, respectively, and the dominant peak at 284.5 eV is due to hydrocarbons (C–C/C–H) coming from CFs. The binding energies of 74.70 and 71.10 eV in Fig. 8e correspond to Pt(0) 4f5/2 and Pt(0) 4f7/2, respectively. Similarly, Pt(2) 4f5/2 and Pt(2) 4f7/2 peaks (Fig. 8e) appearing at 75.95 and 72.60 eV, which indicates the existence of valence states of Pt0 and Pt2+.44,45 This in turn confirms that Pt0 can be oxidized to Pt2+. At instantaneous high excitation voltage, Pt0 may reacts with oxygen under magnetron sputtering system to form PtO. The ratio of Pt0/Pt2+ is about 81.93/18.07 (Table S1†).
Study of optical properties
Fig. 9a shows the optical absorption spectra of ZnO powder, ZnO NRs/CFs and Pt@ZnO NRs/CFs in the UV-Vis spectral (DRS) range. Both pure ZnO powder and the ZnO NRs/CFs revealed the same sharp absorption edge at about 360 nm, characteristic of crystalline ZnO, which could be attributed to that in the UV region, the light-absorption of CFs substrate was strengthened as a result of ZnO NRs coating. Considering the visible light region, the light absorption intensity of ZnO NRs/CFs was constantly much higher than that of ZnO powder (Fig. 9a). Fig. 9b shows the band gap evaluated through extrapolating the linear portion of the curve to zero.30 Calculated data shows that ZnO NRs/CFs have a narrower band gap (Eg = 2.65 eV) than ZnO powder (Eg = 3.10 eV). The red shift might be due to the absorption characteristic of carbon fibers, as well as the interfacial heterojunction formation between ZnO nanorods coating and carbon fibers, reflecting carrier transfer between the two materials.46 The impact of platinum on the light absorption of ZnO coatings also was investigated by DRS. With the uniform loadings of Pt nanoparticles, the absorption edge of ZnO is mildly enlarged towards the direction of visible light region. Some published literatures gave the reason why the absorption edge occurred the red shift, which may be associated with the slight surface plasmon absorption of Pt nanoparticles excited at the wavelength of 470 nm.47,48 After depositing Pt nanoparticles, whether in UV or visible light range, samples both showed higher intensity of response to the light.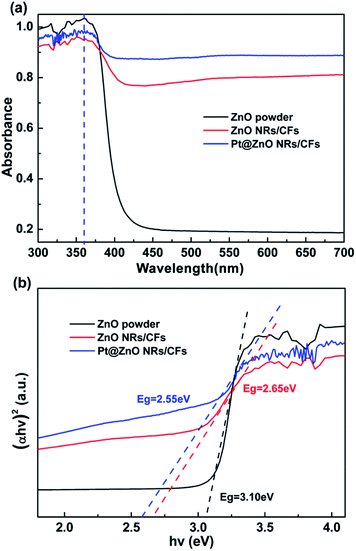 | ||
| Fig. 9 (a) UV-vis diffuse-reflectance spectra (DRS) of ZnO powder, ZnO NRs/CFs and Pt@ZnO NRs/CFs. (b) Plot of (αhν)2 versus hν to evaluate the band gap of ZnO powder, ZnO NRs/CFs and Pt@ZnO NRs/CFs. | ||
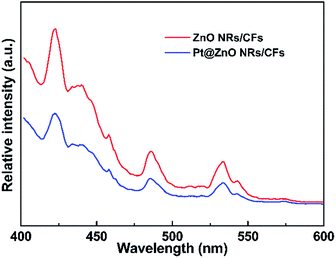
Photoluminescence (PL) emission spectra were used to investigate the effects of the addition of platinum nanoparticles on the properties of charge carrier trapping, immigration and transfer, as well as to understand the fate of electron–hole pairs in the ZnO semiconductor since PL emission results from the recombination of free carriers. The PL emission spectra of the ZnO NRs/CFs and Pt@ZnO NRs/CFs were examined at room temperature and the results are shown in Fig. 10. In the PL spectra, both two samples show similar peak positions at around 420, 485 and 530 nm, but with different PL intensities. The emission peak at 420 nm near the ultraviolet range is attributed to the recombination of e−/h+ pairs. Besides, a surface vacancy on ZnO may lead to the other two indirect emission peaks.49 As seen in Fig. 10, Pt@ZnO NRs/CFs showed decreased photoluminescence intensity of the emission peaks, revealing that the existence of Pt can suppress the recombination rate of photo-generated electrons and holes pairs, which can result in the improvement of photo-catalytic properties.41
Photo-catalytic degradation properties of as-synthesized samples
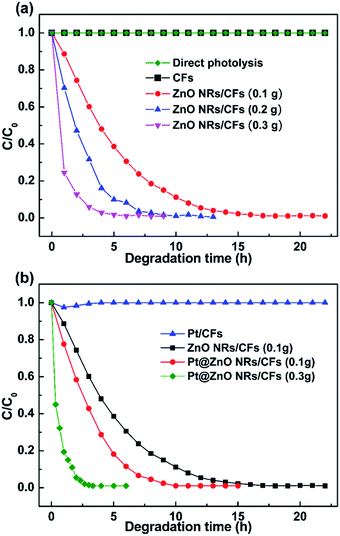
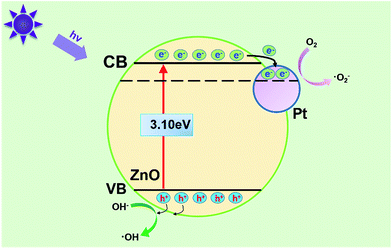
The photocatalytic efficiency of different weight of ZnO NRs/CFs were evaluated according to the degradation of MO dye solution at room temperature (Fig. 11a). In the experiment, MO dye displayed a major absorption band centered at 463 nm, when dissolved in the deionized water. Fig. 11a indicates that pure CFs or direct photolysis almost has no activity for the degradation of organic pollutant. However, the photocatalytic activity of ZnO NRs/CFs has a noticeable enhancement, which completely degraded the MO solution within 14 h with 0.1 g ZnO-modified CFs. Besides, with the increased amount of ZnO NRs/CFs, the time required for totally degradation is shorter. The photo-catalytic activity of ZnO NRs/CFs is moderate mainly because small ZnO had a greater specific surface (refer to nitrogen adsorption–desorption isotherms discussed above Fig. 5) and thus adsorbed a large amount of O2 and OH− to enhance the photo-catalytic activity (refer to the XPS analysis results discussed above Fig. 8). The greater specific surface area also offered more active sites to promote the photo-catalytic reaction.26 However, after introducing Pt particles through magnetron sputtering, the photocatalytic activity effectively enhanced as compared with single ZnO NRs/CFs. As shown in Fig. 11b, after light irradiation for 7 h, the degradation rates of methyl orange (MO) dye solution are 72% for ZnO NRs/CFs and 99.8% for Pt@ZnO NRs/CFs (0.1 g), respectively. The degradation rate of Pt@ZnO NRs/CFs (0.3 g) further demonstrate the effect of Pt on the performance of photocatalysis by completely degrading the MO solution within 3.3 h. The improvement possibly due to synergistic effect between the ZnO crystals and the Pt nanoparticles in the process of catalytic dye.There are some methods reported to slow down the electron–hole recombination and one primary method of which is the loading noble metal on the surface of photocatalyst.50 The reason for enhanced photocatalytic reaction activity of Pt–ZnO nanocomposite may be explained based on the schematic diagram shown in Fig. 12. When as-prepared samples were doped with small amount of Pt, the Pt clusters (small size of Pt nanoparticles) act as a separation center where the photogenerated electrons are stored. Through charge equilibrium process, electrons can be transferred from ZnO to metal Pt at Pt–ZnO interface, resulting in the enhancement of electron–hole separations.51 According to Subramanian et al.,52 the electrons continue to transfer to Pt nanoparticles until the Fermi level reaches close to the conduction band edge of ZnO. At the interface of the ZnO and Pt, the increased photogenerated electron–hole pairs separations and the decreased electron–hole pairs recombination in the ZnO crystal both are beneficial to improve photocatalytic performance for the degradation of organic dyes.53
How do the Pt nanoparticles influence the separation of photo-generated electron–hole pairs in detail? As proposed in Fig. 12, under irradiation of UV light, there are two routes for the excited e− in the ZnO valence band to separate from h+. One route is that excited e− in conduct band transfer to the O2 adsorbed on the surface of ZnO as a function of an electron acceptor. The other route is the transfer of e− from the ZnO NRs to the Pt core driven by the potential energy according to charge transfer mechanism.54,55 In other words, deposited Pt nanoparticles act as electron traps, leading to the prevention of the recombination of photo-generated e−/h+ pairs, especially Pt0 which (refer to Pt0 accounts for 81.93% according to XPS data discussed above) can effectively capture e− in the conduct band based on the literature available.56 At the same time, due to the high efficiency in the separation of photo-generated electron–hole pairs of as-prepared samples, more photo-generated holes in valence band were generated, which can interact with OH− to form ˙OH and more photo-generated electrons in conduct band were formed, reducing O2 absorbed to produce ˙O2−. Both ˙OH radicals and superoxide anion radical (˙O2−) with strong oxidizing capacity, can oxide surrounding organic pollutant molecules into CO2 and H2O.57 To verify this mechanism, we did the XPS measurement for the Pt@ZnO NRs/CFs sample before test and after 5 cycles, and the comparison was shown in Fig. S4.† The peak for Pt 4f after cycle test shifted to lower binding energy, because deposited Pt nanoparticles acted as electron traps, which meant that part of PtO got electron and be reduced to metal Pt. When it came to Zn 2p3/2, the peak of XPS spectra also slightly shifted to lower binding energy, which meant small part of Zn2+ were reduced to Zn after 5 cycles. Though Pt nanoparticles play the role as reservoirs for electrons to prevent the reduction of Zn2+ to Zn by photoinduced electrons, the low loading of Pt nanoparticles can't stop this process completely. This change in valent state of doped platinum and zinc oxide was consistent with catalytic mechanism we suggested.
The cycle performance of the Pt@ZnO NRs/CFs is evaluated by 5 consecutive experiments (15 h each) on the photocatalytic degradation of MO solution. The samples were washed fully by deionized water and then dried at 60 °C for 2 h between cycles without any other treatment. From Fig. 13, it can be observed that the degradation efficiency of MO solution remains good without significant decline even up to five cycles, indicating no obvious loss of activity. It is well known that photocorrosion is one of the main disadvantages that restricting the extensive application of ZnO, which results in poor stability in degradation of organic pollutants. Compared with ZnO NRs/CFs, the Pt@ZnO NRs/CFs photocatalyst has improved cycling performance, since Pt nanoparticles play the role as reservoirs for electrons to prevent the reduction Zn2+ to Zn by photoinduced electrons, thus restraining the photocorrosion process.25 The results suggest that the Pt@ZnO NRs/CFs photocatalysts are highly stable and have good recyclability. The highly recovered performance of the Pt@ZnO NRs/CFs after 5 cycles may be caused by the good binding property between Pt deposited ZnO nanorods and carbon fibers as well as the integrality of samples guaranteed by the satisfactory flexibility of CFs substrate. Take large-scale practical application into the consideration, good stability of photocatalyst and the simplicity of the regeneration technique are quite helpful.
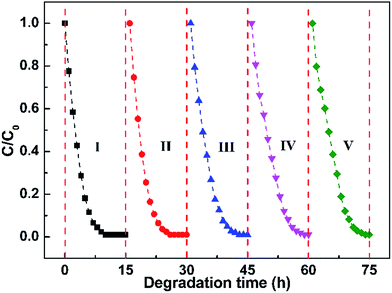 | ||
| Fig. 13 Cycle curves of photocatalytic degradation of MO solution with the Pt@ZnO NRs/CFs for 5 cycles of reuse. | ||
Photocatalytic degradation rates of different dyes with Pt@ZnO NRs/CFs is shown in Fig. 14. As-prepared samples used as photocatalysts can degrade many kinds of organic contaminants (such as, color dye: methyl orange (MO), rhodamine B (RhB), methylene blue (MB), Erichrome Black T). From Fig. 14, Pt@ZnO NRs/CFs can degrade four dyes referred above completely within a short time. Inset picture of Fig. 14 shows that as the photocatalysis proceeds, the color of four dyes (yellow, pink, blue and black) gradually changes from initially color to nearly transparent.
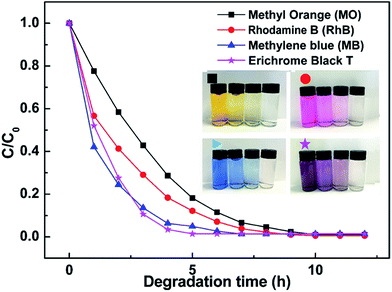 | ||
| Fig. 14 Photocatalytic degradation rates of different dyes with 0.1 g Pt@ZnO NRs/CFs (the inset photos show the color change of four different dyes solution with time). | ||
Conclusions
In this work, a novel hierarchical photocatalyst of Pt@ZnO NRs/CFs was prepared by ALD method combined with hydrothermal growth and magnetron sputtering, which has been proved to possess good photo-catalytic property. Significantly, the synergistic effect between the Pt nanoparticles and ZnO NRs can result in the excellent photocatalytic performance in the degradation of organic solution. Electrons can be effectively transferred at Pt–ZnO interface, avoiding recombination of photogenerated electron–hole pairs, and thereby, promoting photocatalytic activity. More importantly, this novel hierarchical photocatalyst displays good stability and recyclability, which is extremely beneficial in terms of practical application. We believe that this new construction method for nanostructured CFs will offer a new avenue to fabricate carbon-based catalytic materials for advanced applications in the fields of energy, catalysis, and environmental remediation.Acknowledgements
Financial support was provided by the National Natural Science Foundation of China (U1510202, 21276124, 21450585), the National Key R&D Program (2016YFC0204000), and the Jiangsu Province Scientific Supporting Project (BE2014717, and BE2015023).Notes and references
- A. M. E. Khalil, O. Eljamal, T. W. M. Amen, Y. Sugihara and N. Matsunaga, Chem. Eng. J., 2017, 309, 349–365 CrossRef CAS.
- M. Martinez-Quiroz, E. A. Lopez-Maldonado, A. Ochoa-Teran, M. T. Oropeza-Guzman, G. E. Pina-Luis and J. Zeferino-Ramirez, Chem. Eng. J., 2017, 307, 981–988 CrossRef CAS.
- J. Hu, Z. X. Zhong, F. Zhang, W. H. Xing, W. Q. Jin and N. P. Xu, Ind. Eng. Chem. Res., 2016, 55, 6661–6670 CrossRef CAS.
- H. L. Wang, L. S. Zhang, Z. G. Chen, J. Q. Hu, S. J. Li, Z. H. Wang, J. S. Liu and X. C. Wang, Chem. Soc. Rev., 2014, 43, 5234–5244 RSC.
- Y. Ma, X. L. Wang, Y. S. Jia, X. B. Chen, H. X. Han and C. Li, Chem. Rev., 2014, 114, 9987–10043 CrossRef CAS PubMed.
- X. X. Cui, T. T. Li, S. W. Yao, L. B. An, Y. Q. Li, Z. Zhou, M. C. Guo and Z. M. Zhang, RSC Adv., 2016, 6, 96237–96244 RSC.
- N. H. H. Hairom, A. W. Mohammad, L. Y. Ng and A. A. H. Kadhum, Desalin. Water Treat., 2015, 54, 944–955 CrossRef CAS.
- G. Jiang, X. Li, Z. Wei, X. Wang, T. Jiang, X. Du and W. Chen, Powder Technol., 2014, 261, 170–175 CrossRef CAS.
- Y. Y. Lee, H. Y. Li, S. J. Chiu, W. L. Liang, P. L. Yeh and Y. L. Liu, RSC Adv., 2015, 5, 100228–100234 RSC.
- H. Meng, W. Hou, X. Xu, J. Xu and X. Zhang, Particuology, 2014, 14, 38–43 CrossRef CAS.
- W. Guo, F. Zhang, C. Lin and Z. L. Wang, Adv. Mater., 2012, 24, 4761–4764 CrossRef CAS PubMed.
- N. Saito, K. Aoki, Y. Usui, M. Shimizu, K. Hara, N. Narita, N. Ogihara, K. Nakamura, N. Ishigaki, H. Kato, H. Haniu, S. Taruta, Y. A. Kim and M. Endo, Chem. Soc. Rev., 2011, 40, 3824–3834 RSC.
- G. Jiang, X. Li, Z. Wei, T. Jiang, X. Du and W. Chen, Powder Technol., 2014, 260, 84–89 CrossRef CAS.
- S. Xu, X. L Wang, X. T. Dong, W. S. Yu, J. X. Wang and G. X. Liu, RSC Adv., 2016, 6, 43322–43329 RSC.
- Y. Li, L. Liu and F. Yang, J. Membr. Sci., 2016, 505, 130–137 CrossRef CAS.
- H. K. Son, S. Sivakumar, M. J. Rood and B. J. Kim, J. Hazard. Mater., 2016, 301, 27–34 CrossRef CAS PubMed.
- D. Kong, H. Wang, Z. Lu and Y. Cui, J. Am. Chem. Soc., 2014, 136, 4897–4900 CrossRef CAS PubMed.
- X. Lin, M. Li, Y. J. Li and W. Chen, RSC Adv., 2015, 5, 105227–105238 RSC.
- X. Gu, N. Yu, L. Zhang, J. Yang, J. Hu and Z. Chen, RSC Adv., 2015, 5, 102868–102876 RSC.
- B. Weng, F. Xu and F. Yu, Mater. Lett., 2015, 145, 70–73 CrossRef CAS.
- F. Natalio, T. Link, W. E. G. Mueller, H. C. Schroeder, F.-Z. Cui, X. Wang and M. Wiens, Acta Biomater., 2010, 6, 3720–3728 CrossRef CAS PubMed.
- R. H. Jin and J. J. Yuan, Chem. Mater., 2006, 18, 3390–3396 CrossRef CAS.
- W. Xie, Y. Li, W. Sun, J. Huang, H. Xie and X. Zhao, J. Photochem. Photobiol., A, 2010, 216, 149–155 CrossRef CAS.
- I. B. Rufus, V. Ramakrishnan, B. Viswanathan and J. C. Kuriacose, Proc.–Indian Acad. Sci., Chem. Sci., 1989, 101, 487–497 CAS.
- Q. Zhang, Q. Zhang, H. Wang and Y. Li, J. Hazard. Mater., 2013, 254, 318–324 CrossRef PubMed.
- H. U. Lee, S. Y. Park, S. C. Lee, J. H. Seo, B. Son, H. Kim, H. J. Yun, G. W. Lee, S. M. Lee, B. Nam, J. W. Lee, Y. S. Huh, C. Jeon, H. J. Kim and J. Lee, Appl. Catal., B, 2014, 144, 83–89 CrossRef CAS.
- A. M. Pourrahimi, D. M. Liu, R. L. Andersson, V. Strom, U. W. Gedde and R. T. Olsson, Langmuir, 2016, 32, 11002–11013 CrossRef CAS PubMed.
- S.-H. Hwang, Y. K. Kim, S. H. Yoon, S. K. Lim and H. Park, RSC Adv., 2016, 6, 85521–85528 RSC.
- X. L. Song, X. Zhang and P. Yang, RSC Adv., 2016, 6, 107433–107441 RSC.
- H. L. Guo, Q. Zhu, X. L. Wu, Y. F. Jiang, X. Xie and A. W. Xu, Nanoscale, 2015, 7, 7216–7223 RSC.
- P. Maneechakr, S. Karnjanakom and J. Samerjit, RSC Adv., 2016, 6, 73947–73952 RSC.
- D. Banerjee, J. Y. Lao, D. Z. Wang, J. Y. Huang, D. Steeves, B. Kimball and Z. F. Ren, Nanotechnology, 2004, 15, 404–409 CrossRef CAS.
- B. Liu and H. C. Zeng, J. Am. Chem. Soc., 2003, 125, 4430–4431 CrossRef CAS PubMed.
- H. Dai, Y. Zhou, Q. Liu, Z. Li, C. Bao, T. Yu and Z. Zhou, Nanoscale, 2012, 4, 5454–5460 RSC.
- A. V. Rosario and E. C. Pereira, Appl. Catal., B, 2014, 144, 840–845 CrossRef CAS.
- A. Bisht, P. Zhang, C. Shivakumara and S. Sharma, J. Phys. Chem. C, 2015, 119, 14126–14134 CAS.
- M. W. Allen, R. J. Mendelsberg, R. J. Reeves and S. M. Durbin, Appl. Phys. Lett., 2009, 94, 103508 CrossRef.
- X. Gu, N. Yu, L. Zhang, J. Yang, J. Hu and Z. Chen, RSC Adv., 2015, 5, 102868–102876 RSC.
- Y. Liu, H. Liu, Z. Chen, N. Kadasala, C. Mao, Y. Wang, Y. Zhang, H. Liu, Y. Liu, J. Yang and Y. Yan, J. Alloys Compd., 2014, 604, 281–285 CrossRef CAS.
- Z. Zhong, J. Yao, Z.-X. Low, R. Chen, M. He and H. Wang, Carbon, 2014, 72, 242–249 CrossRef CAS.
- C. Yu, K. Yang, Y. Xie, Q. Fan, J. C. Yu, Q. Shu and C. Wang, Nanoscale, 2013, 5, 2142–2151 RSC.
- Z. Zhong, Z. Xu, T. Sheng, J. Yao, W. Xing and Y. Wang, ACS Appl. Mater. Interfaces, 2015, 7, 21538–21544 CAS.
- J. Fang, H. Fan and G. Dong, Mater. Lett., 2014, 120, 147–150 CrossRef CAS.
- R. Zahaf, J. W. Jung, Z. Coker, S. Kim, T.-Y. Choi and D. Lee, Aerosol Air Qual. Res., 2015, 15, 2409–2421 CAS.
- Z. Tian, C. Liu, Q. Li, J. Hou, Y. Li and S. Ai, Appl. Catal., A, 2015, 506, 134–142 CrossRef CAS.
- Z. Wang, K. Yoshinaga, X. R. Bu and M. Zhang, J. Hazard. Mater., 2015, 290, 134–141 CrossRef CAS PubMed.
- C. Langhammer, Z. Yuan, I. Zoric and B. Kasemo, Nano Lett., 2006, 6, 833–838 CrossRef CAS PubMed.
- J. Y. Chen, B. Wiley, J. McLellan, Y. J. Xiong, Z. Y. Li and Y. N. Xia, Nano Lett., 2005, 5, 2058–2062 CrossRef CAS PubMed.
- X. Q. Meng, D. X. Zhao, J. Y. Zhang, D. Z. Shen, Y. M. Lu, Y. C. Liu and X. W. Fan, Chem. Phys. Lett., 2005, 407, 91–94 CrossRef CAS.
- S. Sakthivel, M. V. Shankar, M. Palanichamy, B. Arabindoo, D. W. Bahnemann and V. Murugesan, Water Res., 2004, 38, 3001–3008 CrossRef CAS PubMed.
- V. Subramanian, E. E. Wolf and P. V. Kamat, J. Phys. Chem. B, 2003, 107, 7479–7485 CrossRef CAS.
- V. Subramanian, E. Wolf and P. V. Kamat, J. Phys. Chem. B, 2001, 105, 11439–11446 CrossRef CAS.
- Y. C. Chang and J. Y. Guo, Mater. Chem. Phys., 2016, 180, 9–13 CrossRef CAS.
- V. Keller and F. Garin, Catal. Commun., 2003, 4, 377–383 CrossRef CAS.
- T. Zou, C. Xie, Y. Liu, S. Zhang, Z. Zou and S. Zhang, J. Alloys Compd., 2013, 552, 504–510 CrossRef CAS.
- J. S. Lee and W. Y. Choi, J. Phys. Chem. B, 2005, 109, 7399–7406 CrossRef CAS PubMed.
- D. Hao, Z. Yang, C. Jiang and J. Zhang, Appl. Catal., B, 2014, 144, 196–202 CrossRef CAS.
Footnote |
| † Electronic supplementary information (ESI) available. See DOI: 10.1039/c7ra02583a |
| This journal is © The Royal Society of Chemistry 2017 |


