 Open Access Article
Creative Commons Attribution 3.0 Unported Licence
pH responsive vesicles with tunable size formed by single-tailed surfactants with a dendritic headgroup
Hongtao Xie a,
Wensheng Lub,
Jide Wang
 *a and
Wei Wang*a
aKey Laboratory of Oil and Gas Fine Chemicals, Ministry of Education, Xinjiang Uygur Autonomous Region, College of Chemistry and Chemical Engineering of Xinjiang University, Urumqi, 830046, China. E-mail: awangjd@sina.cn
bInstitute of Chemistry, Chinese Academy of Sciences (ICCAS), Beijing 100190, China
First published on 20th April 2017
Abstract
The structure–activity relationship of surfactants is a topic that has been pursued for a long time in colloid science. We report a study on the self-assembling of a new type of surfactant with a dendritic headgroup in dilute aqueous solutions. Three surfactants, N-alkyldipropionic acids (ADPA) with different chain lengths (n = 14, 16, and 18), were synthesized. As a result of the carboxylic acids and one tertiary amine in the headgroup, the protonation state of the surfactants changes with pH. The morphology of the surfactant aggregates in aqueous solutions was studied at various pH values by transmission electron microscopy (TEM) and dynamic light scattering (DLS). Vesicles were formed spontaneously at pH > 5. Potentiometric titration, turbidity and surface tension were used to determine the effect of protonation state on aggregation behavior. The results show that the vesicle size depends directly on the pH of the solution. The size distribution of vesicles was analyzed by the model of spontaneous curvature. The thermodynamic stability of the vesicles can be attributed to long-range repulsive interactions caused by the low bending modulus of the bilayers.
Introduction
Self-assembling of surfactants leads to a richness in phases with a great diversity of morphologies, such as worm-like micelles, vesicles, molecular gels, etc.1–4 Among these structures, vesicles are particularly interesting due to their high surface-to-volume ratio. This property leads to many technological applications in different fields, such as drug delivery, the food industry, and cosmetic formulations.5–8The spontaneous formation of vesicles has been a challenging area over the years due to their specific requirement for optimal curvature of molecular construction.9,10 Surfactants with a large volume of alkyl chain, short chain length and optimum headgroup area tend to assemble and form vesicles.11 This molecular construction is to fulfill the geometric requirement to pack molecules into bilayers and at the same time retain the fluidity of the alkyl chain.8,12 Therefore, only certain types of surfactant can form vesicles by just dissolving the surfactant in water, and in most cases, the formation of vesicles requires energy input.13 Spontaneous formation of vesicles by conventional surfactants with a single alkyl chain is rarely reported, because lengthening the hydrocarbon chain in order to increase its volume will lead to loss of liquid property.5,14,15 This creates a dilemma when constructing new architectures of conventional surfactants aimed at spontaneous formation of vesicles.16
Recently, dendritic surfactants have drawn much attention due to their unique structure–activity relationship and their applications in nanotechnology.17–20 In previous studies by our group, we have synthesized a dendritic surfactant with a single alkyl chain (C18N3).21–23 By grafting a dendritic unit of poly(amidoamine) onto an octadecyl chain, the Krafft point of the surfactant was found to decrease substantially.21 This property has resulted in many applications, especially in nanosynthesis. For example, the surfactant can been used as a capping agent to synthesize nanocrystals,24,25 hollow nanospheres,22 and nanoparticles with unique structures.19,26,27 Moreover, it is worth pointing out that the largest 2D gold film self-assembled by the bottom-up method was fabricated using a surfactant, and the film could be reversibly formed by adjusting the pH.20
The present study was undertaken to further our understanding of the structure–activity relationship of dendritic surfactants. Three new surfactants (C14ADPA, C16ADPA, and C18ADPA) were designed and synthesized based on the dendritic construction of C18N3. All three dendritic surfactants could spontaneously form vesicles in aqueous solutions at pH > 5. The dendritic headgroup is composed of two carboxylic acids and a tertiary amine. These functional groups can be protonated with a decrease in pH, indicating that the repulsive force between the headgroups can be tuned by adjusting the pH, which further affects the morphology of the aggregates. Therefore, we studied the morphological changes in the aggregates with pH. The results indicated that pH could be used to modulate the size of the vesicles. Moreover, the size distribution of the vesicles was analyzed using the model of spontaneous curvature, which revealed that the stability of the vesicles was attributed to the long-range repulsive interaction caused by the low bending modulus of the bilayers.
Experimental
Materials
Methacrylate (>99%) and octadecylamine (>96%) were purchased from Adamas Reagent, Ltd. (Shanghai, China). Hexadecylamine (95%) and tetradecylamine (95%) were bought from TCI (Tokyo, Japan). Methanol (99.5%), hexane (98%), NaOH (96%), and HCl (36.5%) were purchased from Tianjin Chemicals, Ltd (Tianjin, China). Standard NaOH solution was supplied by Aladdin (Tianjin, China). The organic solvents used in the synthesis were purified by distillation before use. Double distilled water was used for all experiments.Synthesis of the dendritic surfactants
The reaction route is shown in Fig. 1. For C18ADPA, 8 g (0.03 mol) of octadecylamine was dissolved in 20 mL of methanol, and methacrylate (11 mL, 0.12 mol) was added dropwise into the solution. The mixture was kept at room temperature for 36 hours. The solvent was then removed at 40 °C using a rotary evaporator, and the reaction yielded a colorless oil. The product was then dissolved in chloroform and washed twice using 0.01 mol L−1 HCl solution. The hydrolysis of methyl ester was conducted in 50 mL NaOH solution (1 mol L−1) at 80 °C for 10 hours. Then the pH of the hydrolysis medium was adjusted to 5 by using HCl solution. The product precipitated in the acidic solution, and was collected by filtration. The product was then dried in vacuum and yielded a white powder. The powder was then recrystallized three times in a mixed solvent (hexane and methanol) in order to remove impurities (yield 60%). The same procedure was used to prepare C14ADPA and C16ADPA.The analytical data for the surfactants are as follows.
For C18ADPA, 1H NMR (400 MHz, CDCl3): δ (ppm) 0.88 (t, 3H, CH3), 1.25 (br, 30H, CH2), 1.76 (t, 2H, CH2CH2CH2N), 2.85 (t, 4H, CH2CH2CO), 3.12 (t, 2H, CH2CH2CH2N), 3.43 (t, 4H, NCH2CH2CO), 9.5 (2H, COOH). MS-ESI (m/z): calcd, 413.4; found, 412.4 (M − 1). Anal. calcd for C24H47NO4: C, 69.69; H, 11.45; N, 3.39. Found: C, 69.79; H, 11.51; N, 3.32.
For C16ADPA, 1H NMR (400 MHz, CDCl3): δ (ppm) 0.88 (t, 3H, CH3), 1.25 (br, 26H, CH2), 1.76 (t, 2H, CH2CH2CH2N), 2.85 (t, 4H, CH2CH2CO), 3.12 (t, 2H, CH2CH2CH2N), 3.43 (t, 4H, NCH2CH2CO), 10.2 (2H, COOH). MS-ESI (m/z): calcd, 385.3; found, 384.3 (M − 1). Anal. calcd for C22H43NO4: C, 68.53; H, 11.24; N, 3.63. Found: C, 68.57; H, 11.31; N, 3.56.
For C14ADPA, 1H NMR (400 MHz, CDCl3): δ (ppm) 0.88 (t, 3H, CH3), 1.25 (br, 22H, CH2), 1.76 (t, 2H, CH2CH2CH2N), 2.85 (t, 4H, CH2CH2CO), 3.12 (t, 2H, CH2CH2CH2N), 3.43 (t, 4H, NCH2CH2CO), 10.5 (2H, COOH). MS-ESI (m/z): calcd, 357.3; found, 356.3 (M − 1). Anal. calcd for C20H39NO4: C, 67.19; H, 10.99; N, 3.92. Found: C, 67.33; H, 11.13; N, 3.81.
Methods
pH titration
The potentiometric titration was carried out on a PHS-3C pH meter (ShengCi Instrument Ltd., Shanghai, China) with an E-201-C composite electrode (Leici Instrumental Factory, Shanghai, China). The electrode was calibrated using standard buffer solutions before the pH titration. Surfactant solution (0.1 mmol L−1, 200 mL) was mixed with NaOH solution (0.1 mol L−1, 10 mL) in order to dissolve it completely. The forward titration was performed with 20 mL of the aforementioned solution titrated using HCl standard solution. Each titration point was equilibrated until the potential was stable. The temperature of the solution was kept at 25.0 ± 0.1 °C. The degree of protonation (θ) was calculated based on
 | (1) |
Turbidity determination
Turbidity readings were taken at 380 nm on a 722N UV-Vis spectrophotometer (INESA Instrument Ltd., Shanghai, China) using water as a reference. The concentration of the surfactant solution was 5 mmol L−1. The pH of the surfactant solution was estimated by parallel measurements from pH titration. The turbidity was recorded immediately after adjustment of the pH because, for highly turbid samples, a precipitate was observed after a few hours.Surface tension measurements
The surface tension measurements were made on a Sigma7000 Tensiometer (KSV Instruments Ltd., Finland) using the Wilhelmy plate method. The initial concentration of surfactant was 10 mmol L−1 prepared in a NaOH–Na2B4O7 buffer solution. The pH of the buffer was 10.0, and the concentration of Na+ was fixed at 0.1 mol L−1. The surfactants were well-dissolved in the buffer. During the measurements, the surfactant solution was sequentially diluted using the same buffer to reach a target concentration. The surfactant tension was read three times to ensure accuracy. In each measurement, the plate was dipped into the solution first to ensure it was wetted properly.Transmission electron microscopy (TEM)
TEM images were obtained using a negative-staining method.28 The concentrations of C16ADPA and C18ADPA solutions were 1 mmol L−1 and the concentration of C14ADPA solutions was 5 mmol L−1. A carbon Formvar-coated copper grid (200 mesh) was laid on one drop of the sample solution for 10 min, and the excess solution was wiped away with filter paper. Then the copper grid was laid on one drop of phosphotungstic acid sodium (2%). The excess liquid was also wiped with filter paper. After drying, TEM images were taken with a Hitachi-600 electron microscope at a working voltage of 100 kV.Dynamic light scattering (DLS)
DLS measurements were carried out on a Malvern NANO-S9 (Malvern, UK) at a fixed scattering angle of 173°. The concentration of the surfactant solution was adjusted with regard to the scattering intensity. With sufficient photo counts, the lowest concentration was used for experiments. The concentrations of C16ADPA and C18ADPA solutions were 1 mmol L−1, and the concentrations of C14ADPA solutions were 5 mmol L−1 for pH 5, 6, 9, and 10, and 10 mmol L−1 for pH 7 and 8. The samples were prepared 1 day before the measurements and the measurements were conducted at 25 °C. Each sample was tested six times.Results and discussion
Degree of protonation of the surfactants
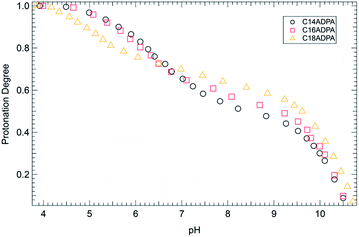
The dendritic surfactants are constructed of a single alkyl chain and a dendritic headgroup. There are three sites on the dendritic headgroup that can be protonated depending on the pH of the solution. The theory of the critical packing parameter indicates that the morphology of the aggregates is influenced by the area of the headgroup. Thus, the protonation state of the dendritic headgroup was evaluated by pH titration. The results of pH titration are presented in Fig. 2.As shown in Fig. 2, there is a slight deviation in the potentiometric titration curves of three surfactants, although the headgroups of the surfactants are identical. All surfactants are fully protonated at pH < 4. In the acidic region, the titration curves for C14ADPA and C16ADPA overlap with each other. When pH rises above 7, the two curves diverge, and a plateau is found in both titration curves. The plateau is considered to be a buffer zone due to the ionization of carboxylic acids and tertiary amine. With further increase in pH, the two curves converge again. The response of the dendritic headgroups to pH changes for C14ADPA and C16ADPA are very similar, which may be due to the similar solubilities of these two surfactants. However, for C18ADPA, the potentiometric curve diverges at fairly low pH, and crosses over the curves for C14ADPA and C16ADPA at pH 6.5. This scenario is attributed to the low solubility of C18ADPA in the low pH region, as turbidity measurements in the next section show that phase separation occurs for C18ADPA in this pH region.
The surfactants become well-dissolved in the solution when the pH rises above 6.5. In the pH region of 7.0 to 9.5, the titration curves of all three surfactants exhibit identical behavior owing to the characteristics of the dendritic headgroup. At a certain pH, the degree of protonation of the surfactants follows the same order as the length of hydrocarbon chain (θC18ADPA > θC16ADPA > θC14ADPA). As the protonation of the surfactants is mostly attributed to the carboxylic groups in the alkaline solution, this result indicates that the surfactant with longer chain length is less charged. Since the surfactants are well-dissolved in alkaline solutions, the difference in the degree of protonation is attributed to the hydrophobic interaction between surfactant molecules. A long hydrocarbon chain exhibits strong hydrophobic interaction, which leads to a closer distance between the surfactant molecules. When a neighboring site of a surfactant is protonated, the free energy required for the surfactant to be ionized is considerably higher compared to the free energy required for the first site to be ionized. In this case, the hydrophobic interaction between C18ADPA molecules is the highest among the three surfactants, and C18ADPA also exhibits the highest degree of protonation, indicating that the carboxylic groups are less ionized.
With further increase in pH, the potentiometric titration curves display a rapid decrease in the degree of protonation in the pH region of 9.5 to 11. This pH region exceeds the buffer capacity of the surfactants. The two carboxylic groups become fully ionized in this region, which further contributes to the solubility of the surfactants.
Turbidity titration
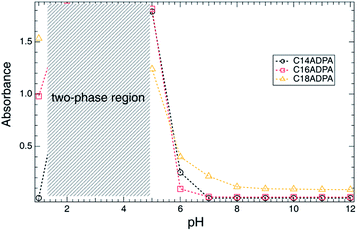
The turbidity of a solution is a macro-indicator of the size of the aggregates. The turbidity of the dendritic surfactant solution is presented in Fig. 3 as a function of pH. A common trend of turbidity could be observed for all three surfactants. The surfactants form homogenous solutions at high pH values (above 6). When the pH is below 6, the turbidity of all three surfactants increases dramatically. Phase separation occurs for the surfactant solutions. Most of the surfactant molecules precipitate, which results in a two-phase solution with a surfactant-rich phase and a dilute phase. For C14ADPA, C16ADPA and C18ADPA, all solutions exhibit high turbidity with the decrease in pH. The increase in turbidity indicates the formation of large aggregates, which is attributed to the low solubility of the surfactants due to a high degree of protonation. Based on the chemical structure of the dendritic headgroup, the carboxylic groups mostly become uncharged at low pH, which in turn reduces the solubility of the surfactant. This will further strengthen the hydrophobic interaction and cause the formation of large aggregates. Consequently, when the pH decreases, the system is transformed into a two-phase solution due to the carboxylic groups becoming uncharged.Surface tension
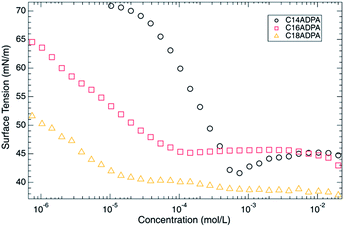
Surface tension (γ) is measured as a function of surfactant concentration at pH 10. Typical γ–c curves were observed (Fig. 4). The critical micellar concentrations (CMC) were identified by the break point on the γ–c curves, which were 4.32 × 10⁻⁴, 6.41 × 10⁻⁵, and 2.02 × 10⁻⁵ mol L−1 for C14ADPA, C16ADPA, and C18ADPA, respectively. The pH of the solutions was adjusted by using a NaOH–Na2B4O7 buffer solution with a cationic concentration of 0.1 mol L−1. Owing to the salt ions, the charges in the headgroups are screened, and a weak repulsive force between the headgroups is expected.At pH 10, the surfactants were well-dissolved in the buffer solution, as was observed in the turbidity measurements. For C14ADPA and C16ADPA, the degree of protonation was similar, which was also observed in the surface tension measurements. The surface tensions in the high concentration region were the same for both surfactants. As for C18ADPA, the turbidity was slightly higher than it was for C14ADPA and C16ADPA, and the surface tension in the high concentration region was lower than the surface tensions for C14ADPA and C16ADPA in the same concentration region. A minimum surface tension was found on the γ–c curve for C14ADPA, which may be caused by surface active impurities. Although the surfactant was recrystallized three times, we were not able to remove all the impurities. Regardless of the impurities in the C14ADPA sample, the CMCs obtained for the three surfactants are consistent with previously reported data.29
Morphology measured by DLS and TEM
The morphology of the aggregates was characterized by dynamic light scattering (DLS) and transmission electron microscopy (TEM).The hydrodynamic diameter (Dh) of the aggregates measured by DLS is presented in Fig. 5, and TEM images of the aggregates at pH 10, 7, and 5 are presented in Fig. 6 for the three surfactants in aqueous solution. For C14ADPA, two groups of aggregates are detected at most pH values (Fig. 5). The Dh of one group is around 5 nm, and the Dh of the other group is on average 300 nm at pH 8. Mixed micelles and vesicles are expected to coexist in the solution. The Dh of vesicles decreases with the increase in pH of the solution, and the size of the vesicles becomes stable when the pH is above 7. The size of the micelles is rather stable with pH of the solution. In the TEM images for C14ADPA (Fig. 6a–c), spherical vesicles are observed at all three pH values. The size of the vesicles in Fig. 6c is clearly larger than those in Fig. 6a and b. Vesicle sizes in Fig. 6a and b are comparable.
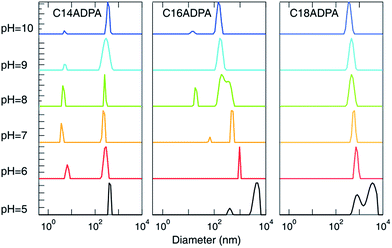 | ||
| Fig. 5 Influence of pH on the diameter of the aggregates measured by dynamic light scattering. The size distribution is based on the intensity autocorrelation function. | ||
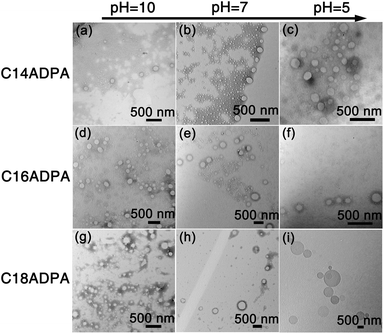 | ||
| Fig. 6 TEM images of the aggregates formed in the solutions for each surfactant at three pH values are presented in a 3 × 3 matrix. | ||
For C16ADPA, two groups of aggregates are also detected by DLS (Fig. 5). Both groups exhibit a strong response to pH change. A clear decrease in Dh of the aggregates with the increase in pH can be observed in Fig. 5. These aggregates can be observed in the TEM images for C16ADPA (Fig. 6d–f), which are identified as vesicles. At pH 5, the surfactant molecules become less soluble in water as presented in the turbidity results. Fig. 6f shows the image of aggregates after the large flocculates were removed from the solution. The size of the aggregates is on the same scale as the vesicles observed in Fig. 6e, just slightly larger. The size of the vesicles in Fig. 6e is much larger than those in Fig. 6d due to the effect of pH.
Only one type of aggregate is detected in the DLS measurements for C18ADPA (Fig. 5). Although for C18ADPA the shift of Dh due to pH change is not as apparent as it is for C16ADPA, the size of the vesicles decreases with increasing pH. The TEM images for C18ADPA exhibit an obvious decrease in vesicle size with increasing pH (Fig. 6g–i).
Based on these observations, we propose a mechanism to explain the transformation of vesicle size due to the change in pH (Fig. 7). The morphology of surfactant aggregates can be predicted using the geometrical shape of the surfactant configuration, which is defined by the critical packing parameter (p)
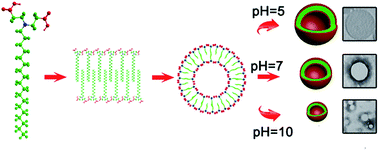 | ||
| Fig. 7 Schematic representation of the self-assembling process for the transformation of vesicle size. The length of the square side of the TEM images (shown on the right) is 1 μm. | ||
The model of the critical packing parameter provides a basic understanding of the increase in vesicle size as the pH value of the solution decreases; however, the model cannot explain whether the vesicles are stable. In the next section, we will discuss the reasons for the spontaneous formation of vesicles and why the vesicles are stable in aqueous solution.
The asymmetrical distribution caused by non-ideal surfactant mixing leads to a spontaneous bilayer curvature. The spontaneous curvature results in a certain vesicle size with other bilayer curvatures prohibited energetically. In theory, the spontaneous curvature, which is understood in terms of the amount of minimum energy, is dictated by the competition between the entropy of mixing and the curvature elasticity of the bilayers.30 In thermodynamics, the free energy per area (f) for curvature is expressed as31,32
 | (2) |
![[small kappa, Greek, macron]](https://www.rsc.org/images/entities/i_char_e0cb.gif) is the saddle-splay modulus and R0 is the vesicle size with minimum energy. For spherical vesicles, R1 = R2, and
is the saddle-splay modulus and R0 is the vesicle size with minimum energy. For spherical vesicles, R1 = R2, and ![[small kappa, Greek, macron]](https://www.rsc.org/images/entities/i_char_e0cb.gif) = 0; therefore, eqn (2) is conveniently rewritten as31
= 0; therefore, eqn (2) is conveniently rewritten as31
 | (3) |
 | (4) |
As an example, the C18ADPA system is used to discuss the effect of pH on spontaneous curvature. Fig. 8 presents the vesicle size distributions determined from DLS, and the solid lines are the fits to eqn (4). The fits exhibit excellent agreement with the equilibrium distributions, and the parameters are presented in Table 1. For the C18ADPA system, the vesicle diameter at spontaneous curvature continuously decreases with increasing pH; the same general trend is observed for the other two surfactant systems. This general trend can be understood from the concept of critical packing as described in the previous section. In Fig. 2, we observed that the degree of protonation monotonically decreased with the increase in pH with a plateau between pH 8 and 9, meaning that the charge in the dendritic headgroup increases with increasing pH. Due to the repulsion of the charges in the headgroup, an increase in cross-sectional area is expected with increasing pH. This will cause the spontaneous curvature to increase, which eventually manifests as the change in vesicle size. A correspondence between the charge properties and the size at spontaneous curvature could be found in this case. If one pays close attention to the change in C0, the diameters of vesicles at pH 8 and 9 are nearly identical; correspondingly, in the titration curves, one may observe that the degrees of protonation at these two pH values are very close to each other. This is not a coincidence, but strong proof that systematic manipulation of charge density affects the spontaneous curvature and further controls the size of the vesicles.
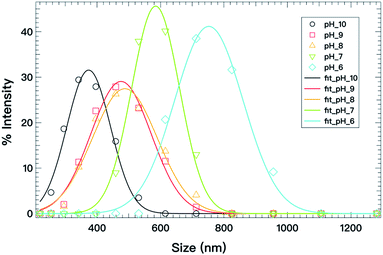 | ||
| Fig. 8 Vesicle size distributions (open symbols) determined from DLS for C18ADPA at different pH values; the solid lines are fits to eqn (4). | ||
| Surfactant | pH | κ (kBT) | R0 (nm) |
|---|---|---|---|
| C18ADPA | 10 | 0.45 | 286 |
| C18ADPA | 9 | 0.36 | 346 |
| C18ADPA | 8 | 0.32 | 348 |
| C18ADPA | 7 | 1.05 | 510 |
| C18ADPA | 6 | 0.83 | 638 |
| C16ADPA | 9 | 0.44 | 134 |
| C14ADPA | 9 | 0.16 | 176 |
As for the bending modulus, the measured values are in the range 0.32kBT to 1.05kBT, indicating κ ≈ kBT. This is a rather important finding for single-chain vesicles. For the case of high pH values, κ is much smaller than kBT. Although the positive value suggests the opposite to bending, the value is fairly small (on the level of thermal fluctuation). This may indicate that the bilayer fluctuates locally, which creates a long-range repulsive interaction to mutually prohibit fusion. This long-range repulsive interaction (scales as κ − 1) completely overwhelms the attractive interaction, and stabilizes the bilayer.35,36 At low pH values, the surfactant is less charged, which results in a higher bending modulus, and more rigid bilayers. With further decrease in pH, it eventually leads to phase separation.
The same analysis was also performed for the C16ADPA and C14ADPA systems at pH 9, and the results are presented in Fig. 9 and Table 1. As shown in the titration curve, the degree of protonation of the three surfactants is not same at pH 9; as a result, it is difficult to evaluate the contribution of a single parameter, in this case, either the length of the hydrocarbon chain or the charge density. The vesicle diameter at the spontaneous curvature for the surfactants follows the order: DC18ADPA > DC14ADPA > DC16ADPA. As for the bending modulus, κC16ADPA ≈ κC18ADPA; while κC14ADPA shows the lowest value in Table 1, indicating the least rigid bilayer. This could be because the thickness of the bilayer formed by C14ADPA is less than the thickness of the bilayers formed by C18ADPA and C16ADPA.37
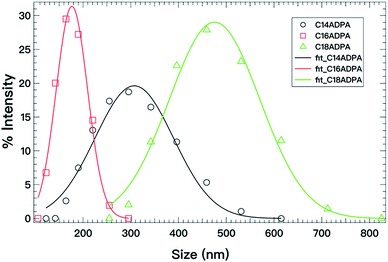 | ||
| Fig. 9 Vesicle size distributions (open symbols) determined from DLS at pH 9 for the three surfactants; the solid lines are fits to eqn (4). | ||
Conclusions
A detailed study of the aggregation behavior of three dendritic surfactants is presented. When the headgroup of the surfactants is fully protonated (less charged), the turbidity of the surfactant solutions increases, and phase separation occurs for C18ADPA. When the headgroup of the surfactants is ionized, the surfactants spontaneously form vesicles at various pH values. Due to the pH-tunable dendritic headgroups, the cross-sectional area of the surfactants changes in response to the pH of the solutions, which leads to an adjustable vesicle size. The stability of the vesicles was studied in terms of spontaneous curvature. The results show that the bending moduli are on the scale of thermal fluctuation (kBT). Hence, we conclude that the vesicles spontaneously formed by the dendritic surfactants are stabilized by long-range repulsive forces caused by mutual hindrance of the fluctuation of bilayers.Acknowledgements
We are grateful for the financial support from the One-Thousand Talent Program for Young Outstanding Scientists and financial support from the National Natural Science Foundation of China (No. 21162027 and 21261022).Notes and references
- Y. Chevalier, Curr. Opin. Colloid Interface Sci., 2002, 7, 3–11 CrossRef CAS.
- S. R. Raghavan, Langmuir, 2009, 25, 8382–8385 CrossRef CAS PubMed.
- M. E. Cates and S. J. Candau, J. Phys.: Condens. Matter, 1990, 2, 9790–9797 Search PubMed.
- J. Engberts and J. Kevelam, Curr. Opin. Colloid Interface Sci., 1996, 1, 779–789 CrossRef CAS.
- S. B. And and S. N. G. Acharya, Langmuir, 1999, 16, 87–97 Search PubMed.
- W. Wei, W. Lu, H. Wang, H. Xie and J. Wang, J. Colloid Interface Sci., 2015, 440, 16–22 CrossRef PubMed.
- W. Wang, E. S. Johnson, T. Nylander, P. Ellingson, B. Schubert and L. Piculell, J. Colloid Interface Sci., 2016, 467, 213 CrossRef CAS PubMed.
- B. K. Paul, N. Ghosh and S. Mukherjee, RSC Adv., 2016, 6, 9984–9993 RSC.
- S. Segota and D. Tezak, Adv. Colloid Interface Sci., 2006, 121, 51–75 CrossRef CAS PubMed.
- K. Edwards and M. Almgren, Langmuir, 1992, 8, 824–832 CrossRef CAS.
- W. Helfrich, J. Phys.: Condens. Matter, 1994, 6, A79 CrossRef CAS.
- R. G. Laughlin, Colloids Surf., A, 1997, 128, 27–38 CrossRef CAS.
- B. K. Paul, N. Ghosh and S. Mukherjee, J. Phys. Chem. B, 2016, 120, 3963–3968 CrossRef CAS PubMed.
- X. Lu, A. Zhiqiang Zhang and Y. Liang, Langmuir, 1996, 12, 5501–5503 CrossRef CAS.
- F. M. Menger and Y. Yamasaki, J. Am. Chem. Soc., 1993, 115, 3840–3841 CrossRef CAS.
- D. D. Lasic, J. Colloid Interface Sci., 1990, 140, 302–304 CrossRef CAS.
- S. Bhattacharya and S. K. Samanta, J. Phys. Chem. Lett., 2011, 2, 914 CrossRef CAS PubMed.
- Y. Imura, S. Hojo, C. Morita and T. Kawai, Langmuir, 2014, 30, 1888–1892 CrossRef CAS PubMed.
- W. Jia, J. Li and L. Jiang, ACS Appl. Mater. Interfaces, 2013, 5, 6886–6892 CAS.
- J. Wu, W. Jia, W. Lu and L. Jiang, ACS Appl. Mater. Interfaces, 2012, 4, 6560–6564 CAS.
- W. Wang, A. Wensheng Lu and L. Jiang, J. Phys. Chem. B, 2008, 112, 1409–1413 CrossRef CAS PubMed.
- W. Wang, W. Lu and L. Jiang, J. Colloid Interface Sci., 2009, 338, 270–275 CrossRef CAS PubMed.
- W. Wang and W. Lu, Colloids Surf., B, 2013, 102, 759–765 CrossRef CAS PubMed.
- G. Lin, W. Jia, W. Lu and L. Jiang, J. Colloid Interface Sci., 2011, 353, 392–397 CrossRef CAS PubMed.
- G. Lin and W. Lu, New J. Chem., 2015, 39, 4231–4234 RSC.
- Y. Xia, W. Lu and L. Jiang, Nanotechnology, 2010, 21, 85501 CrossRef PubMed.
- Y. Xia, J. Li and J. Long, J. Colloid Interface Sci., 2012, 377, 34–39 CrossRef CAS PubMed.
- T. Kunitake and Y. Okahata, J. Am. Chem. Soc., 1980, 102, 549–553 CrossRef CAS.
- B. Bettayeb, C. Descôteaux, F. Benoit, C. Chapados and G. Bérubé, J. Surfactants Deterg., 2009, 12, 237–247 CrossRef CAS.
- J. N. Israelachvili, D. J. Mitchell and B. W. Ninham, J. Chem. Soc., Faraday Trans., 1976, 72, 1525–1568 RSC.
- B. Coldren, R. V. Zanten, M. J. M. And, J. A. Zasadzinski and H. T. Jung, Langmuir, 2003, 19, 5632–5639 CrossRef CAS.
- S. A. Safran, P. Pincus and D. Andelman, Science, 1990, 248, 354–356 CAS.
- H. T. Jung, B. Coldren, J. A. Zasadzinski, D. J. Iampietro and E. W. Kaler, Proc. Natl. Acad. Sci. U. S. A., 2001, 98, 1353–1357 CrossRef CAS.
- S. A. Safran, P. A. Pincus, D. Andelman and F. C. Mackintosh, Phys. Rev. A, 1991, 43, 1071 CrossRef CAS.
- C. R. Safinya, E. B. Sirota, D. Roux and G. S. Smith, Phys. Rev. Lett., 1989, 62, 1134–1137 CrossRef CAS PubMed.
- J. N. Israelachvili, Intermolecular and surface forces, Academic press, 2011 Search PubMed.
- C. R. Safinya, D. Roux, G. S. Smith, S. K. Sinha, P. Dimon, N. A. Clark and A. M. Bellocq, Phys. Rev. Lett., 1986, 57, 2718 CrossRef CAS PubMed.
| This journal is © The Royal Society of Chemistry 2017 |


