 Open Access Article
Creative Commons Attribution 3.0 Unported Licence
Nitrogen-doped carbon composites derived from 7,7,8,8-tetracyanoquinodimethane-based metal–organic frameworks for supercapacitors and lithium-ion batteries†
Yongli Tonga,
Dong Jia,
Ping Wangb,
Hu Zhoub,
Kazim Akhtarb,
Xiaoping Shend,
Junhao Zhang*ac and
Aihua Yuan *ac
*ac
aSchool of Environmental and Chemical Engineering, Jiangsu University of Science and Technology, Zhenjiang 212003, P. R. China. E-mail: aihua.yuan@just.edu.cn
bSchool of Material Science and Engineering, Jiangsu University of Science and Technology, Zhenjiang 212003, P. R. China
cMarine Equipment and Technology Institute, Jiangsu University of Science and Technology, Zhenjiang 212003, P. R. China
dSchool of Chemistry and Chemical Engineering, Jiangsu University, Zhenjiang 212013, P. R. China
First published on 10th May 2017
Abstract
In this study, nitrogen-doped carbon composites were prepared by carbonizing 7,7,8,8-tetracyanoquinodimethane (TCNQ)-based metal–organic frameworks (MOFs) under a N2 atmosphere. The TCNQ ligand and pyrolysis temperature played key roles in the formation of these N-doped carbon composities with various nitrogen contents and species, which can effectively adjust the electrochemical performances of electrode materials. The results showed that the nitrogen-doped carbon composites prepared via carbonization at 650 °C (N-C-650), as the electrode material for supercapacitors, exhibited high capacitance of 223.7 F g−1 at a current density of 1 A g−1, and the specific capacitance retained 73.4% of its initial capacitance after 3000 cycles. Moreover, the nitrogen-doped carbon composites prepared via carbonization at 550 °C (N-C-550), as the anode material for lithium-ion batteries, exhibited a high reversible capacity of 675 mA h g−1 at a rate of 100 mA g−1 and excellent cycling stability (736.8 mA h g−1 after 50 cycles). The good electrochemical performance of the electrode materials was mainly attributed to the high nitrogen content and control over the type of nitrogen species in the nitrogen-doped carbon composites.
1. Introduction
In modern society, ever-growing energy consumption and the gradual burning of fossil fuels are driving the pursuit for renewable energy sources with high-performance, inexpensive, and environmentally benign features.1,2 Nowadays, lithium-ion batteries (LIBs) and supercapacitors are being employed as energy storage devices and have become potential power sources.3–5 Taking into consideration their broad range of applications, the most challenging work for scientists is to further explore and develop advanced electrode materials with high power density, excellent rate capability, prolonged cycle life, and portable safety features for LIBs and supercapacitors.6–9As is known, the inherit nature of electrode materials is crucial for the electrochemical performance of energy storage devices, and carbon materials have continually attracted significant attention due to their natural abundance, chemical stability, and environmentally friendly properties. However, they are far from meeting the ever-growing requirements for the next-generation electrode materials because of their low theoretical gravimetric capacity (372 mA h g−1).10 Note that the incorporation of heteroatoms (such as N, S, P, and B) is the most promising approach to enhance the capacity, surface wettability, and electronic conductivity of carbon electrodes.11,12 Among these, nitrogen doping has attracted significant attention from researchers because of the higher electronegativity (3.0) of nitrogen as compared to that (2.5) of carbon. Furthermore, N doping on the surface of carbon materials will also result in pseudocapacitive interactions between the electrolyte ions and electrode materials, significantly increasing the capacitance of the electrodes.3 In addition, N doping into carbon material networks facilitates the formation of stronger interactions between Li ions and N-doped carbon.13 Based on the abovementioned advantages, two effective strategies, including the post-treatment of carbon sources with nitrogen-containing chemical agents9,14,15 and in situ doping using nitrogen-containing precursors, have been developed to construct N-doped carbon materials.16–18 Among both the abovementioned methods, considerable work has proven that the in situ doping method is superior as it can enhance the nitrogen content and avoid the generation of oxygen-bearing group in the final N-doped carbon materials.13,14 Recently, metal–organic frameworks (MOFs) have been employed as precursors to produce nitrogen-doped carbon materials via a direct carbonization approach. Huang and co-workers have reported porous Co–Zn/N-C polyhedral nanocages formed via annealing a ZIF-8@ZIF-67 precursor as high-performance anode materials for LIBs.19 Li et al. have reported that the hierarchically flower-like N-doped porous carbon (NPC-600) electrode prepared via carbonizing Cu-MOF had 8.65 at% N content and 114 F g−1 specific capacitance at 0.5 A g−1.20 The advantages of MOF-derived materials (such as carbon and metal oxides) are that the final products can inherit the morphologies of the pure MOFs and also the structure and composition of the product can be controlled by changing the pyrolysis temperature.21–23
Tetracyanoquinodimethane (TCNQ) is a well-known multi-redox active organic ligand with multi-dentate nature, and TCNQ-based MOFs have exhibited unique solid-state physical properties.24–27 Moreover, TCNQ is also a potential ligand to prepare N-rich MOFs due to its high N content (27.5 wt%). In this study, TCNQ was selected as a ligand in the MOF and as a N source for N-doped carbon materials. The N-doped carbon materials with controlled N contents and N species were constructed by adjusting the carbonization parameters of the TCNQ-based Sr-MOF under a nitrogen atmosphere. The electrochemical properties demonstrated that the supercapacitors fabricated using the N-doped carbon composites carbonized at 650 °C (N-C-650) had excellent capacitances at high rates and good capacitance retention. Additionally, the N-doped carbon composites carbonized at 550 °C (N-C-550) were used as anode materials for LIBs and exhibited high initial discharge capacity and retained a high reversible capacity and good cycling stability. These results can be reasonably ascribed to the inherit characteristics of the specific N-doped carbon composites, which were significantly influenced by the N content and N species.
2. Experimental
2.1. Materials
All the chemicals were of analytical grade and were purchased from Sigma-Aldrich and used without further purification. Li(TCNQ) was synthesized according to a literature procedure.282.2. Synthesis of {[Sr2(TCNQ)3(H2O)6]·TCNQ}n
{[Sr2(TCNQ)3(H2O)6]·TCNQ}n, which was denoted as Sr-MOF, was synthesized using standard Schlenk techniques.29 SrCl2·nH2O (0.6 mmol) and Li(TCNQ) (1.2 mmol) were dissolved in 20 mL of a degassed mixture comprising methanol and deionized water with V(CH3OH)/V(H2O) = 1![[thin space (1/6-em)]](https://www.rsc.org/images/entities/char_2009.gif) :
:![[thin space (1/6-em)]](https://www.rsc.org/images/entities/char_2009.gif) 1. Then, the raw solution was stirred at room temperature for 30 min and aged for 12 h under a N2 atmosphere. The as-obtained suspension was filtered, washed two times with methanol and deionized water, and vacuum-dried to obtain the final products.
1. Then, the raw solution was stirred at room temperature for 30 min and aged for 12 h under a N2 atmosphere. The as-obtained suspension was filtered, washed two times with methanol and deionized water, and vacuum-dried to obtain the final products.
2.3. Preparation of the N-doped carbon composites
The N-doped carbon composites were prepared via the direct carbonization of the as-synthesized Sr-MOF under a N2 atmosphere at 450, 550, and 650 °C. Typically, the Sr-MOF was homogeneously placed into a ceramic boat, and the ceramic boat was placed into a tube furnace. After the sample was exposed to a flow of N2 at a rate of 400 mL min−1 at room temperature for 30 min, the furnace was heated to the target temperature at a heating rate of 5 °C min−1. Then, the resulting products were extensively washed with HCl solution (35%) to remove the residual Sr or Sr compounds. Finally, the samples were washed three times with deionized water and absolute ethanol, and the resulting products were denoted as N-C-450, N-C-550, and N-C-650.2.4. Material characterization
Structural characterization of the as-prepared samples was conducted by an X-ray diffractometer (XRD-6000, Shimadzu) with Cu-Kα radiation (0.15406 nm). The surface electronic states of the samples were investigated by X-ray photoelectron spectroscopy (XPS, Thermo-VG Scientific ESCA-LAB250) using monochromatized Al-Kα radiation. The microstructures were investigated using field emission scanning electron microscopy (FESEM, ZEISS Merlin Compact) and transmission electron microscopy (TEM, JEM-2100F). Thermal analyses were conducted via a Perkin-Elmer STA6000 at a heating rate of 15 °C min−1 under a N2 atmosphere. The Raman spectra were obtained using a Horiba HR800 Raman spectrometer (514 nm laser). Elemental analyses were performed using a Perkin-Elmer 2400 analyzer.2.5. Electrode fabrication and electrochemical measurements
The electrochemical performance of the supercapacitors fabricated using the N-doped carbon composites was investigated using an Autolab PGSTAT302N potentiostat (Eco-Chemie) with a standard three-electrode configuration comprising a platinum plate and Ag/AgCl electrode (saturated KCl) as the counter and reference electrodes, respectively. The as-prepared N-C-450, N-C-550, and N-C-650 materials were used as the test electrodes, which were prepared by loading a slurry consisting of 80 wt% active material, 10 wt% carbon black, and 10 wt% polyvinylidene fluoride (PVDF) (in N-methylpyrrolidone) on a graphite paper and dried at 105 °C for 12 h under vacuum. A 6 mol L−1 KOH aqueous solution was utilized as the electrolyte, and all measurements were performed at room temperature. The electrochemical performances of the electrodes were characterized by cyclic voltammetry (CV) and galvanostatic charge–discharge (GCD) tests within the potential range from −1.2 to 0 V versus the Ag/AgCl (saturated KCl) electrode by varying the scan rate from 5 to 100 mV s−1. The specific capacitance was obtained using the following equation:30,31where CS (F g−1) is the specific capacitance, I (mA) is the discharge current, Δt (s) is the discharge time, Δv (V) is the potential drop during the discharge process after internal resistance (IR) drop, and m (g) is the mass of the active materials only.
The electrochemical performance of the LIBs with the N-doped carbon composites was examined using a coin cell (CR2032). The working electrode consisted of 80 wt% active material (N-C-450, N-C-550, and N-C-650), 10 wt% conductivity agent (Super P), and 10 wt% polymer binder (polyvinylidenefluoride, PVDF) mixed with N-methyl-2-pyrrolidone (NMP). After being stirred for 12 h, the slurry was brush coated on a Cu foil and then dried at 105 °C for 12 h under vacuum. The coin cells were assembled in an argon-filled glovebox (with a moisture and oxygen content of less than 1 ppm) using lithium as the counter electrode, Celgard 2500 as the separator, and 1 mol L−1 LiPF6 in ethylene carbonate and dimethyl carbonate (EC![[thin space (1/6-em)]](https://www.rsc.org/images/entities/char_2009.gif) :
:![[thin space (1/6-em)]](https://www.rsc.org/images/entities/char_2009.gif) DEC = 1
DEC = 1![[thin space (1/6-em)]](https://www.rsc.org/images/entities/char_2009.gif) :
:![[thin space (1/6-em)]](https://www.rsc.org/images/entities/char_2009.gif) 1) as the electrolytes. The galvanostatic charge–discharge measurements (GCD) were performed using an automatic battery testing system (LAND CT2001A, Wuhan, China). Cyclic voltammetry (CV) measurements were carried out using a PARSTAT2273 electrochemical workstation (Princeton Applied Research, USA) at a scan rate of 0.2 mV s−1 in the potential window of 0.1–3.0 V. Electrochemical impedance spectroscopy (EIS) was performed using a PARSTAT2273 electrochemical workstation in the frequency range from 10 mHz to 1.0 MHz with an AC amplitude of 10 mV.
1) as the electrolytes. The galvanostatic charge–discharge measurements (GCD) were performed using an automatic battery testing system (LAND CT2001A, Wuhan, China). Cyclic voltammetry (CV) measurements were carried out using a PARSTAT2273 electrochemical workstation (Princeton Applied Research, USA) at a scan rate of 0.2 mV s−1 in the potential window of 0.1–3.0 V. Electrochemical impedance spectroscopy (EIS) was performed using a PARSTAT2273 electrochemical workstation in the frequency range from 10 mHz to 1.0 MHz with an AC amplitude of 10 mV.
3. Results and discussion
3.1. Structural characterization
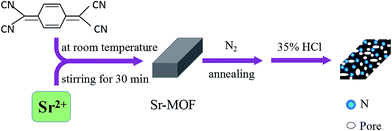
A schematic of the synthetic route for nitrogen-doped carbon composites is shown in Fig. 1. The XRD patterns of the as-synthesized Sr-MOF very well match the simulated patterns, as shown by the crystallographic data (Fig. S1†), demonstrating the successful synthesis of the target Sr-MOF.29 The FESEM images (Fig. S2†) show that the MOF precursor comprised rectangles with smooth surfaces. The TG analyses of Sr-MOF (Fig. S3†) reveal that the Sr-MOF exhibits a weight loss of about 9.8 wt% below 200 °C, corresponding to the loss of coordinated water molecules. The second weight loss from 380 to 850 °C was attributed to the decomposition of the organic ligands in the framework. The previous results confirmed that the carbonization temperature played a crucial role in controlling the doping N content and N species.32,33 Therefore, different carbonization temperatures (450, 550, and 650 °C) were employed to prepare a series of N-doped carbon composites with different N contents and N species.The morphologies and structures of the samples derived from the Sr-MOFs carbonized at 450, 550, and 650 °C were investigated by electron microscopy. The FESEM images (Fig. S4(a–c)†) show that the as-prepared N-doped carbon composites inherited the original morphology of the Sr-MOFs even after the high-temperature treatment process. Detailed surface observations (Fig. S4(d–f)†) reveal that the surfaces of the N-doped carbon composites became rough after the carbonization step. Note that many cavities were observed on the surfaces of the carbon materials, which were generated from the release of gases during the thermal treatment process. Fig. 2a–c present the TEM images of the N-doped carbon composites, in which large quantities of disordered gullies were found on the surfaces, providing channels for ion diffusion. The elemental mapping of N-C-550 (Fig. 2d) points out a highly uniform distribution of C, N, and O in a rectangle, further confirming the formation of the N-doped carbon composites.
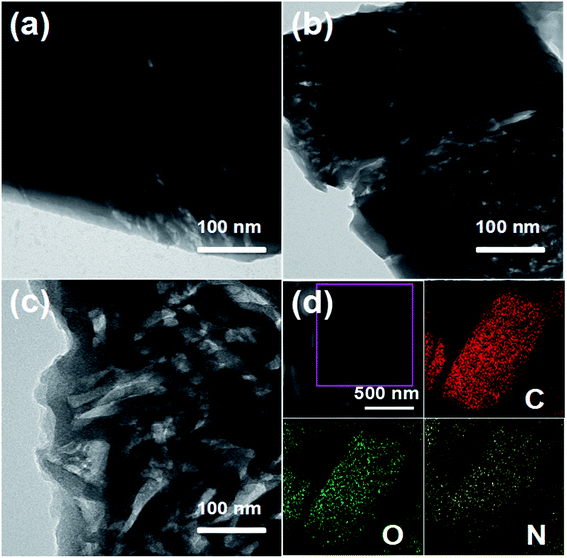 | ||
| Fig. 2 TEM images of the N-doped carbon composites: (a) N-C-450, (b) N-C-550, and (c) N-C-650. (d) FESEM images of N-C-550 and the elemental mapping images of C, O, and N. | ||
The N-doped carbon composites were investigated using XRD (Fig. 3a) to ensure the phase structures. After the calcination step, the characteristic peaks of Sr-MOF disappeared, and a weak and broad peak at 2θ = 22–26° was attributed to the (002) diffraction of graphitic carbon (JCPDS card no. 34-0567), which indicated that the graphitic degree decreased upon increasing the carbonization temperature. No other peaks of impurities were observed in the XRD patterns, confirming that the strontium atoms were successfully removed upon the acid-etching treatments. The Raman spectra were analyzed to further characterize the degree of graphitization in the N-doped carbon composites, as shown in Fig. 3b. The two broad peaks at 1357 cm−1 and 1597 cm−1 observed in N-C-450, N-C-550, and N-C-650 were ascribed to the D and G bands of carbon, respectively. More specifically, both peaks can be attributed to the E2g mode of graphite related to the vibration of sp2-bonded carbon atoms in a 2D hexagonal lattice and an A1g mode of graphite related to the disorder due to the finite particle size effect or lattice distortion of the graphite crystals.34,35 The intensity ratio of the D and G bands, ID/IG, can provide reliable information on the degree of graphitization.36 It was found that the ID/IG ratios of N-C-650 (0.88) and N-C-550 (0.87) were slightly higher than that of N-C-450 (0.77), revealing that N-C-450 exhibited a higher degree of graphitization than other samples, which was in good agreement with the abovementioned XRD results.
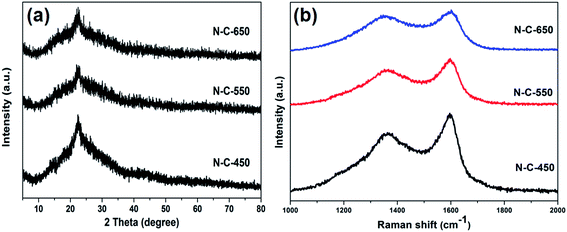 | ||
| Fig. 3 (a) The XRD patterns of N-C-450, N-C-550, and N-C-650. (b) The Raman spectra of N-C-450, N-C-550, and N-C-650. | ||
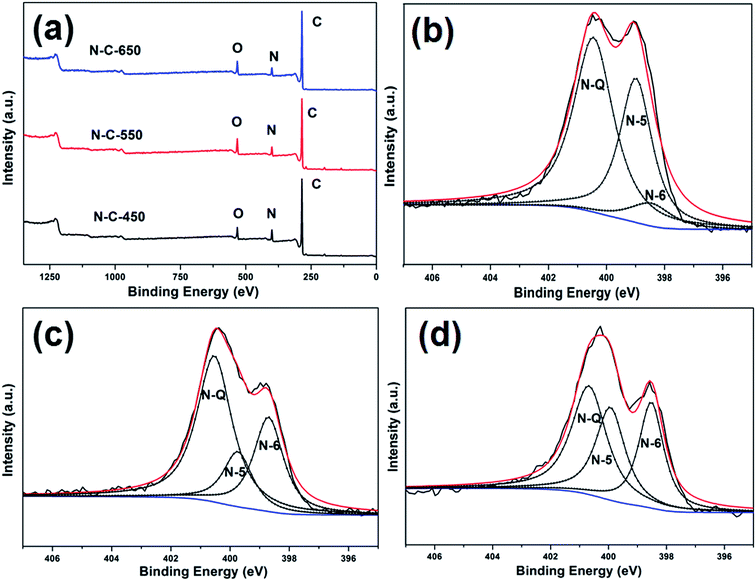
Elemental analysis (Table 1) indicated that the N content in N-C-450 (11.54 wt%), N-C-550 (9.98 wt%), and N-C-650 (9.44 wt%) decreased upon increasing the carbonization temperature from 450 to 650 °C. This was probably induced by the volatilization of nitrogen species at the elevated carbonization temperatures.37 XPS was employed to further probe the N content and N species in the composites, as presented in Fig. 4a. The peaks related to C, N, and O can be clearly observed, suggesting the presence of carbon (83.66 at%, 80.76 at%, and 83.70 at%), nitrogen (8.53 at%, 7.66 at%, and 6.99 at%), and oxygen (6.87 at%, 8.81 at%, and 7.86 at%) (Table 1). Note that no peaks for strontium atoms were observed, which indicated that strontium or strontium compounds were completely removed from the nitrogen-doped carbon composites.38 The oxygen atoms were doped on the surface of the carbon materials, which may have originated from absorbed oxygen/water in air.18,39 In general, the presence of oxygen facilitates the increase in the wettability between the electrodes and electrolytes and also introduces extra pseudo capacitance via redox reactions, consequently improving the entire capacitive performance.40 The N 1s spectra can be deconvoluted into three peaks: pyridinic N (N-6, 398.4 ± 0.2), pyrrolic or pyridonic N (N-5, 399.8 ± 0.2), and graphitic N (N-Q, 400.7 ± 0.4) (Fig. 4b–d).41 Fig. S5† presents a schematic of the undoped graphene materials (A1, B1, and C1) and their N-doped counterparts (A2, B2, and C2). From the literature, it is clear that the presence of N-6 and N-5 atoms can introduce a number of surface defects to form disordered carbon structures. This is good for transporting Li+ in LIBs.42 Moreover, the N-6 and N-5 atoms and oxygen functional groups act as electrochemical active sites to provide the pseudo-capacitance for supercapacitors.9,40 However, N-Q doped on the surface of carbon materials cannot extend the defect sites and vacancies for Li+ insertion and produce the pseudo-capacitance effect.42 From the abovementioned discussion, it can be suggested that the N doping content and N species affect the electrochemical performance of the carbon composites. According to the results shown in Table 1, the N content of N-C-450 is high (8.53 at%), and 55.06% N in N-C-450 belongs to N-Q. Note that the percentages of N-6 and the oxygen functional groups in N-C-650 and N-C-550 were obviously higher than those of N-C-450. Therefore, the N-doped carbon composites with different N-doped contents and N species will exhibit different electrochemical performance.
| Elemental analysis (wt%) | XPS (at%) | N 1s (%) | ||||||
|---|---|---|---|---|---|---|---|---|
| N | C | N | C | O | N-Q | N-5 | N-6 | |
| N-C-450 | 11.54 | 59.89 | 8.53 | 83.66 | 6.87 | 55.06 | 37.04 | 7.90 |
| N-C-550 | 9.98 | 61.88 | 7.66 | 80.76 | 8.81 | 53.70 | 16.80 | 29.50 |
| N-C-650 | 9.44 | 60.92 | 6.99 | 83.70 | 7.86 | 41.43 | 29.80 | 28.77 |
3.2. Electrochemical characterization
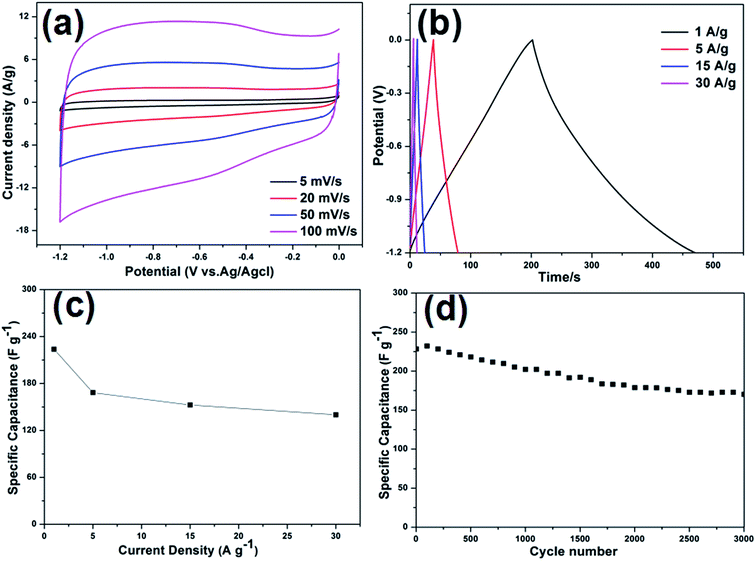
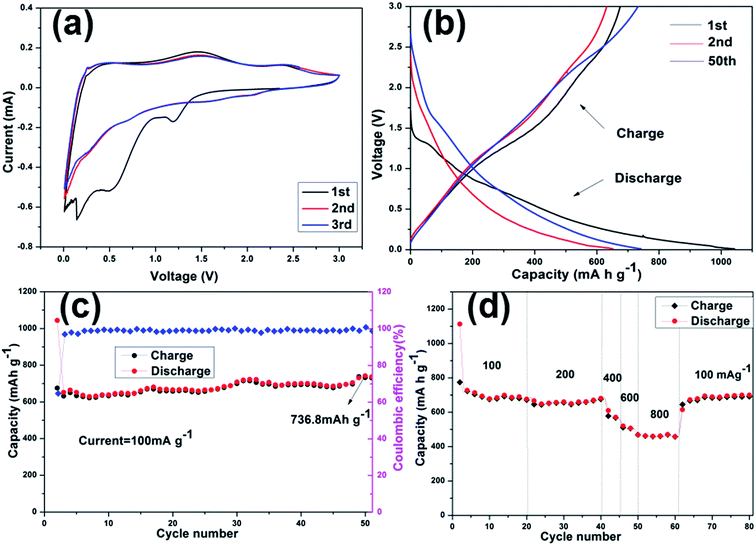
Considering the advantageous features of N-doped carbon composites (high N content and control over the type of N species), the electrochemical performance of the electrode materials were investigated. The CV curves obtained for N-C-450, N-C-550, and N-C-650 used as supercapacitor electrodes at different potential sweep rates are shown in Fig. S6(a–d).† The remarkable difference in the electrochemical surface activities among the three materials can be obviously recognized in the CV curves. Apparently, it can be qualitatively discerned that N-C-450 has an ultra-low specific capacitance. N-C-550 significantly deviates from a rectangular shape, which is mainly ascribed to a higher content of oxygen-containing functional groups on the surfaces.43 However, N-C-650 presents a capacitive behavior with typical rectangular-like shapes observed in the CV curves, which remains unchanged even at a potential scan rate of 100 mV s−1 (Fig. 5a). In contrast, the CV curves obtained for N-C-450 and N-C-550 exhibit an obvious deviation from the rectangular shape upon increasing the scan rate from 5 to 100 mV s−1, which was probably attributed to the incorporation of limited ions into the active electrode materials. Therefore, N-C-650 possesses an excellent capacitor response, according to the cyclic voltammetry characteristics. To further investigate the performance of the three electrodes, the GCD curves of N-C-450, N-C-550, and N-C-650 with the voltage windows ranging from −1.2 to 0 V at various current densities were obtained and are shown in Fig. S7a, c, and 5b, respectively. The results indicate that the specific capacitance of 223.7 F g−1 for N-C-650 was slightly lower than 229.9 F g−1 for N-C-550 and obviously higher than 42 F g−1 for N-C-450 at 1.0 A g−1. Furthermore, the long-term cycling stability of the three electrodes was evaluated using GCD measurements at a current density of 1.0 A g−1. The CS value of N-C-650 as a function of cycle number is displayed in Fig. 5d. It is clear that the CS value of N-C-650 decreased to 78.3% of its initial capacitance after 2000 cycles; however, between 2000 and 3000 cycles, the capacity decay was only 4.86%. The CS value remains at about 170.1 F g−1 after 3000 cycles, whereas the specific capacitances of N-C-550 and N-C-450 only remain at about 108 F g−1 and 17.7 F g−1 after the same number of cycles (Fig. S7b and d†), respectively. The abovementioned results illustrate that the N-C-650 electrode exhibits a good cycling stability when used as a supercapacitive electrode material. In addition, the rate performance of the electrodes is presented in Fig. 5c. The CS values of N-C-650 are 223.7, 168.3, 152.5, and 139.9 F g−1 at the rates of 1, 5, 15, and 30 A g−1, respectively, and show only a slight decrease upon increasing the current density, suggesting that the electrode material possesses an outstanding capacitance retention capability at large current densities. This can be ascribed to the fact that the higher N-Q content in N-C-450 restrains its electrochemical performances, and higher oxygen functional groups and N-6 contents in N-C-550 and N-C-650 represent the pseudo-capacitance effect, consequently are beneficial to improve initial performances of N-C-550 and N-C-650.44 However, the higher residual oxygen content in N-C-550 when compared to that in N-C-650 causes redox reactions, which result in an intensified self-discharge process and finally damage the cycle stability of the N-C-550 electrode materials.20,45,46 When compared with the related work, the electrochemical performances of the N-C-650 as electrode materials of supercapacitors are superior to those of other MOF-derived carbon materials, as indicated in Table S1.† The abovementioned results clearly demonstrate that N-rich doped carbon with a high N-6 content is beneficial for the capacity improvement and possibly explained that N doping plays an important role in improving the electrical conductivity and electrochemical activity during the charge/discharge process.To further understand the electrochemical performance of these electrodes, the successful fabrication of the N-doped carbon materials as anode materials for LIBs was investigated. The first three CV curves obtained for the N-C-450, N-C-550, and N-C-650 electrode materials were obtained at room temperature between 0.1 and 3.0 V at a scan rate of 0.2 mV s−1 (Fig. S8a, 6a and S9a†). The first CV curve observed in N-C-550 was different from those of the subsequent cycles, especially for the discharge curves. For the first discharge cycle, strong peaks were observed at 0.6 V and 1.1 V, which were usually attributed to the occurrence of side reactions on the electrode surfaces and interfaces because of a solid-electrolyte interphase (SEI) film.47 Moreover, the peak intensity of the first cycle was much stronger than that of the following cycles, indicating the occurrence of some irreversible reactions and the formation of an SEI film. According to the results of the second and third cycles, both CV curves almost overlapped, confirming the stable and superior reversibility of the electrode material. Fig. 6b shows the discharge/charge profiles obtained for the 1st, 2nd, and 50th cycles for N-C-550 at a current density of 100 mA g−1 between 0.1 and 3.0 V. The discharge capacity in the first cycle was as high as 1043 mA h g−1, whereas its first reversible specific capacity was only 675 mA h g−1, isolating an initial coulombic efficiency of about 64.71%. The relatively low initial coulombic efficiency can be ascribed to the irreversible capacity loss, indicating the formation of an SEI film and decomposition of the electrolyte. These results also matched the abovementioned CV data, in which the cathodic peaks were present in the first scan, but absent in the following scans. The cycling performance of N-C-550 was evaluated at 100 mA g−1 over a range from 0.1 to 3.0 V versus Li/Li+. As shown in Fig. 6c, N-C-550 as an anode material possessed excellent cycling stability with a relatively high capacity. After 50 cycles, the electrode still maintained a discharge capacity of 736.8 mA h g−1. Fig. 6d presents the rate capabilities of N-C-550 at various current densities. When the current density gradually increased from 100 to 200, 400, 600, and 800 mA g−1, the corresponding average discharge capacities were 716.9, 660.9, 568.8, 490.4, and 460.7 mA h g−1, respectively. When the current density was 100 mA g−1 again, the average discharge capacity returned to about 686.2 mA h g−1, demonstrating the excellent rate performance of the N-C-550 anode material. Furthermore, the electrochemical properties of N-C-450 and N-C-650 as anode materials in LIBs were also investigated. As shown in Fig. S8(b–d) and S9(b–d),† the electrochemical properties of N-C-450 and N-C-650 were similar to that of N-C-550. The reversible capacities of N-C-450 were 588.5 mA h g−1 in the first cycle and 569.7 mA h g−1 after 50 cycles. However, the reversible capacities of N-C-650 were 631.8 mA h g−1 in the first cycle and 476.9 mA h g−1 after 50 cycles. Obviously, the electrochemical performance of N-C-550 was superior to those of N-C-450 and N-C-650, which was attributed to the control over the nitrogen content and type of nitrogen species (especially for N-6) in the nitrogen-doped carbon composites at a suitable ratio through the choice of the carbonization temperature.48 The nitrogen content of N-C-450 was up to 8.53 at%, and high N-Q was unfavorable for Li+ insertion. When compared with N-C-550, N-C-650 had a low capacitance due to its lower nitrogen content. The Nyquist plots of the nitrogen-doped carbon composites in the frequency range from 100 kHz to 10 mHz are shown in Fig. 7. Almost all the plots depicted semicircles in the high-frequency region and straight lines in the low-frequency region. In general, the semicircle in the high frequency region indicates charge-transfer at the electrode/electrolyte interface and the linear portion in the low frequency region was attributed to Warburg impedance or lithium diffusion into the electrolyte.49–51 As depicted in the inset curve of Fig. 7, N-C-550 has a lower high frequency resistance. This suggests that the N-C-550 electrode possessed the smallest semicircle, demonstrating the best electrochemical conductivity. Based on abovementioned analysis, it was observed that the MOF-derived N-C-550 had a potential application as an anode material for use in LIBs.
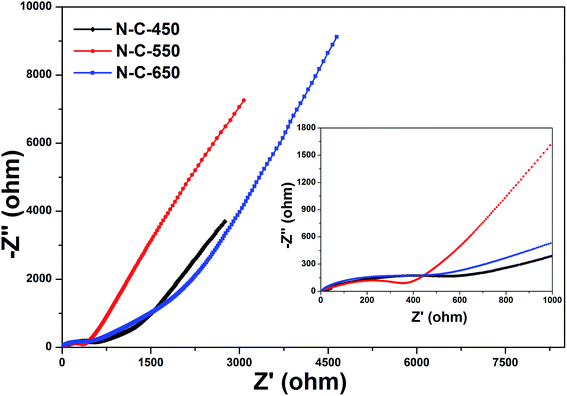 | ||
| Fig. 7 The electrochemical impedance spectra (inset: magnified region) of N-C-450, N-C-550, and N-C-650 obtained under the influence of an ac voltage of 10 mV. | ||
4. Conclusions
In summary, the present study provides a facile and controllable two-step strategy to prepare nitrogen-doped carbon composites on a large scale: this includes the fabrication of Sr-MOFs and a subsequent solid-state thermolysis of the Sr-MOFs, which serve as nitrogen and carbon sources and sacrificial templates. The well-defined nitrogen-doped carbon composites were obtained with a uniform dispersion of N doping and large quantities of diffusion channels in the carbon framework. The as-obtained N-C-650 was used as an electrode material for use in supercapacitors, exhibiting an excellent specific capacitance and cycle durability. The N-C-550 was employed as anode material for LIBs, which had a high reversible capacity and good cycling stability. The improved electrochemical performances were ascribed to the high N contents and control over the type of N species. Therefore, the nitrogen-doped carbon composites may be promising electrode materials for use in supercapacitors and LIBs. Most importantly, the facile solid-phase conversion approach can be easily extended to the scaled-up synthesis of other carbon-based functional materials with well-defined morphologies and architectures.Acknowledgements
This work was supported by the National Natural Science Foundation (51672114, 51272095), the Natural Science Foundation of Jiangsu Province (BK20151328, BK20161357), the Qing Lan Project of Jiangsu Province, the project of the Priority Academic Program Development of Jiangsu Higher Education Institutions, the China Postdoctoral Science Foundation (2014M561578), and the Jiangsu Planned Projects for Postdoctoral Research Funds (1401109C).References
- J. H. Hou, T. Cao, F. Idrees and C. B. Cao, Nanoscale, 2016, 8, 451–457 RSC.
- H. J. Huang and X. Wang, J. Mater. Chem. A, 2014, 2, 6266–6291 CAS.
- Y. L. Wang, H. Q. Xuan, G. X. Lin, F. Wang, Z. Chen and X. P. Dong, J. Power Sources, 2016, 319, 262–270 CrossRef CAS.
- D. Ji, H. Zhou, J. Zhang, Y. Y. Dan, H. X. Yang and A. H. Yuan, J. Mater. Chem. A, 2016, 4, 8283–8290 CAS.
- J. H. Hou, C. B. Cao, X. L. Ma, F. Idrees, B. Xu, X. Hao and W. Lin, Sci. Rep., 2014, 4, 7260 CrossRef CAS PubMed.
- L. M. Zhang, B. Yan, J. H. Zhang, Y. J. Liu, A. H. Yuan and G. Yang, Ceram. Int., 2016, 42, 5160–5170 CrossRef CAS.
- C. R. Zheng, C. B. Cao, R. L. Chang, J. H. Hou and H. Z. Zhai, Phys. Chem. Chem. Phys., 2016, 18, 6268–6274 RSC.
- B. Yan, L. Chen, Y. J. Liu, G. X. Zhu, C. G. Wang, H. Zhang, G. Yang, H. T. Ye and A. H. Yuan, CrystEngComm, 2014, 16, 10227–10234 RSC.
- J. H. Lee, C. S. Yoon, J. Y. Hwang, S. J. Kim, F. Maglia, P. Lamp, S. T. Myung and Y. K. Sun, Energy Environ. Sci., 2016, 9, 2152–2158 CAS.
- J. H. Hou, C. B. Cao, F. Idrees and X. L. Ma, ACS Nano, 2015, 9, 2556–2564 CrossRef CAS PubMed.
- H. G. Wang, Z. Wu, F. L. Meng, D. L. Ma, X. L. Huang, L. M. Wang and X. B. Zhang, ChemSusChem, 2013, 6, 56–60 CrossRef PubMed.
- H. J. Huang, J. X. Zhu, W. Y. Zhang, C. S. Tiwary, J. F. Zhang, X. Zhang, Q. G. Jiang, H. Y. He, Y. P. Wu, W. Huang, P. M. Ajayan and Q. Y. Yan, Chem. Mater., 2016, 28, 1737–1745 CrossRef CAS.
- F. C. Zheng, Y. Yang and Q. W. Chen, Nat. Commun., 2014, 5, 5261 CrossRef CAS PubMed.
- S. L. Candelaria, B. B. Garcia, D. W. Liu and G. Z. Cao, J. Mater. Chem., 2012, 22, 9884–9889 RSC.
- P. Zhang, F. Sun, Z. G. Shen and D. P. Cao, J. Mater. Chem. A, 2014, 2, 12873–12880 CAS.
- B. Xu, S. S. Hou, G. P. Cao, F. Wu and Y. S. Yang, J. Mater. Chem., 2012, 22, 19088–19093 RSC.
- D. S. Yuan, T. X. Zhou, S. L. Zhou, W. J. Zou, S. S. Mo and N. N. Xia, Electrochem. Commun., 2011, 13, 242–246 CrossRef CAS.
- L. T. Song, Z. Y. Wu, H. W. Liang, F. Zhou, Z. Y. Yu, L. Xu, Z. Pan and S. H. Yun, Nano Energy, 2016, 19, 117–127 CrossRef CAS.
- M. Huang, K. Mi, J. H. Zhang, H. L. Liu, T. T. Yu, A. H. Yuan, Q. H. Kong and S. L. Xiong, J. Mater. Chem. A, 2017, 5, 266–274 CAS.
- Z. X. Li, K. Y. Zou, X. Zhang, T. Han and Y. Yang, Inorg. Chem., 2016, 55, 6552–6562 CrossRef CAS PubMed.
- Y. Yan, F. H. Du, X. P. Shen, Z. Y. Ji, X. X. Sheng, H. Zhou and G. X. Zhu, J. Mater. Chem. A, 2014, 2, 15875–15882 CAS.
- Y. Yan, F. H. Du, X. P. Shen, Z. Y. Ji, H. Zhou and G. X. Zhu, Dalton Trans., 2014, 43, 17544–17550 RSC.
- L. M. Zhang, J. H. Zhang, Y. J. Liu, L. Zhang and A. H. Yuan, J. Nanosci. Nanotechnol., 2017, 17, 2571–2577 CrossRef.
- C. A. Di, G. Yu, Y. Q. Liu, X. J. Xu, D. C. Wei, Y. B. Song, Y. M. Sun, Y. Wang, D. B. Zhu, J. Liu, X. Y. Liu and D. X. Wu, J. Am. Chem. Soc., 2006, 128, 16418–16419 CrossRef CAS PubMed.
- S. Wakida, Y. Kohigashi, H. Miyamura, K. Higashi and Y. Ujihira, Anal. Sci., 1996, 12, 989–991 CrossRef CAS.
- C. Avendano, Z. Y. Zhang, A. Ota, H. H. Zhao and K. R. Dunbar, Angew. Chem., Int. Ed., 2011, 123, 6673–6677 CrossRef.
- N. Motokawa, T. Oyama, S. Matsunaga, H. Miyasaka, K. Sugimoto, M. Yamashita, N. Lopez and K. R. Dunbar, Dalton Trans., 2008, 31, 4099–4102 RSC.
- L. R. Melby, R. J. Harder, W. R. Hertler, W. Mahler, R. E. Benson and W. E. Mochel, J. Am. Chem. Soc., 1962, 84, 3374–3387 CrossRef CAS.
- Q. Li, P. F. Yan, G. F. Hou, Y. Wang and G. M. Li, Dalton Trans., 2013, 42, 7810–7815 RSC.
- L. Q. Mai, F. Yang, Y. L. Zhao, X. Xu, L. Xu and Y. Z. Luo, Nat. Commun., 2011, 2, 381 CrossRef PubMed.
- Y. F. Zhang, M. Z. Ma, J. Yang, H. Q. Su, W. Huang and X. C. Dong, Nanoscale, 2014, 6, 4303–4308 RSC.
- A. B. Fuertes and T. A. Centeno, J. Mater. Chem., 2005, 15, 1079–1083 RSC.
- Y. L. Tan, K. Zhu, D. Li, F. Bai, Y. J. Wei and P. Zhang, Chem. Eng. J., 2014, 258, 93–100 CrossRef CAS.
- L. J. Yang, S. J. Jiang, Y. Zhao, L. Zhu, S. Chen, X. Z. Wang, Q. Wu, J. Ma, Y. W. Ma and Z. Hu, Angew. Chem., Int. Ed., 2011, 123, 7270–7273 CrossRef.
- Y. Zhou, Q. L. Bao, L. A. L. Tang, Y. L. Zhong and K. P. Loh, Chem. Mater., 2009, 21, 2950–2956 CrossRef CAS.
- A. Alabadi, X. J. Yang, Z. H. Dong, Z. Li and B. Tan, J. Mater. Chem. A, 2014, 2, 11697–11705 CAS.
- X. Y. Chen, C. Chen, Z. J. Zhang, D. H. Xie, X. Deng and J. W. Liu, J. Power Sources, 2013, 230, 50–58 CrossRef CAS.
- M. I. Sosulnikov and Y. A. Teterin, Dokl. Akad. Nauk SSSR, 1991, 317, 418–421 CAS.
- B. Xu, H. Duan, M. Chu, G. P. Cao and Y. H. Yang, J. Mater. Chem. A, 2013, 1, 4565–4570 CAS.
- B. Xu, S. S. Hou, G. P. Cao, F. Wu and Y. H. Yang, J. Mater. Chem., 2012, 22, 19088–19093 RSC.
- W. Ren, D. J. Li, H. Liu, R. Mi and Y. Zheng, Electrochim. Acta, 2013, 105, 75–82 CrossRef CAS.
- C. C. Ma, X. H. Shao and D. P. Cao, J. Mater. Chem., 2012, 22, 8911–8915 RSC.
- M. Seredych, D. H. Jurcakova, G. Q. Lu and T. J. Bandosz, Carbon, 2008, 46, 1475–1488 CrossRef CAS.
- T. Q. Lin, I. W. Chen, F. X. Liu, C. Y. Yang, H. Bi, F. F. Xu and F. Q. Huang, Science, 2015, 350, 1508–1513 CrossRef CAS PubMed.
- W. Wei, H. W. Liang, K. Parvez, X. D. Zhuang, X. L. Feng and K. Mullen, Angew. Chem., Int. Ed., 2014, 126, 1596–1600 CrossRef.
- J. S. Li, S. L. Li, Y. J. Tang, K. Li, L. Zhou, N. Kong, Y. Q. Lan, J. C. Bao and Z. H. Dai, Sci. Rep., 2014, 4, 5130–5138 CrossRef CAS PubMed.
- A. L. M. Reddy, A. Srivastava, S. R. Gowda, H. Gullapalli, M. Dubey and P. M. Ajayan, ACS Nano, 2010, 4, 6337–6342 CrossRef CAS PubMed.
- D. H. Wu, Y. F. Li and Z. Zhou, Theor. Chem. Acc., 2011, 130, 209–213 CrossRef CAS.
- G. H. Zhang, S. C. Hou, H. Zhang, W. Zeng and F. L. Yan, Adv. Mater., 2015, 27, 2400–2405 CrossRef CAS PubMed.
- Y. Y. Chen, R. Cai, Y. Yang, C. Liu, A. H. Yuan, H. X. Yang and X. P. Shen, J. Alloys Compd., 2017, 698, 469–475 CrossRef CAS.
- D. Ji, H. Zhou, Y. L. Tong, J. P. Wang, M. Z. Zhu, T. H. Chen and A. H. Yuan, Chem. Eng. J., 2017, 313, 1623–1632 CrossRef CAS.
Footnote |
| † Electronic supplementary information (ESI) available. See DOI: 10.1039/c7ra02543b |
| This journal is © The Royal Society of Chemistry 2017 |


