DOI:
10.1039/C7RA02402A
(Paper)
RSC Adv., 2017,
7, 22415-22423
Efficient photocatalytic dye degradation over Er-doped BiOBr hollow microspheres wrapped with graphene nanosheets: enhanced solar energy harvesting and charge separation
Received
26th February 2017
, Accepted 13th April 2017
First published on 24th April 2017
Abstract
In this work, Er-doped BiOBr hollow microspheres wrapped with graphene nanosheets, which acted as a photocatalyst with excellent photocatalytic activity and stability, have been successfully synthesized through a simple two-step hydrothermal method. The related properties of the as-prepared photocatalyst were analyzed and a possible reaction mechanism was proposed. Incorporating the rare-earth element Er into the BiOBr crystal lattice can greatly expand the optical window, maybe owing to the reduced energy band gap by the impurity energy level introduced below the conduction band and indirect utilization of long-wavelength visible light caused by the up-conversion performance. The wrapping with surface graphene nanosheets can efficiently promote charge separation and transmission over the hybrid photocatalyst. The synergistic effect between efficient solar energy harvesting and charge separation gives rise to a remarkable improvement of photocatalytic activity for RhB degradation under simulated sunlight irradiation. In addition, the as-prepared photocatalyst possesses excellent photocatalytic stability, mainly due to the robust coordination interaction between the graphene and the (001) facets of the BiOBr subunits. The rational design of this highly active and stable photocatalyst provides a promising approach for future applications.
1. Introduction
Nowadays, semiconductor photocatalysts, such as TiO2, CdS, MoS2, Bi2MoO6 and WO3, which possess the ability of coupling solar energy into chemical reactions, have been widely investigated for solving some environmental and energy problems.1–13 Nevertheless, the traditional photocatalysts have disadvantages, such as weak visible-light response and inefficient quantum efficiency, forcing us to develop new types of semiconductor photocatalytic materials. As a new type of photocatalyst, BiOX (X = F, Cl, Br, I) are gaining increasing attention due to their unique layered structure, good optical properties and high photocatalytic activities.14,15 In particular, the band gap of BiOBr is the most reasonable.16,17 However, the pure BiOBr photocatalyst still faces some challenges which seriously limit its photocatalytic activity; thus, the further optimization of the conventional BiOBr photocatalyst is quite desirable and urgent.18–20 To our knowledge, the photocatalysis reaction process mainly contains three parts.21–23 The first part is solar energy harvesting, in which the semiconductor photocatalysts absorb solar energy and generate electrons and holes. The second part is charge transfer, where photogenerated carriers migrate to the photocatalyst surface along with the charge recombination process. Finally, the surviving photocarriers over the photocatalyst surface can attack the targets. Thereby, realizing the efficient solar energy harvesting and charge separation can be considered as the effective pathway for improving the catalysis activity of photocatalyst. Illuminated by the aforesaid insight, introducing some foreign ions into BiOBr crystal or incorporating some cocatalysts into BiOBr photocatalysis system, which can efficiently boost the photoelectric conversion efficiency, holds great promise for realizing the overall improvement for the photocatalysis activity of the BiOBr catalyst.24–26
The introduction of foreign ions, namely ion doping, has been proven to be an effective way to improve the photocatalytic activity of BiOBr.27–30 To date, various experiments have been reported, some metal ions (e.g., Zn and Fe) or nonmetal (e.g., B and C) doped BiOBr photocatalysts were successfully prepared31–35 and exhibited good photocatalytic performance, which mainly attributed to several aspects, e.g. impurity energy level introduced into the energy band, internal electric field tuning and capture traps generated for electrons and holes.36,37 Besides that, the inherent nature of dopant also affects the catalytic activity of photocatalyst.38,39 Compared with conventional materials, the up-conversion materials possess the characteristic of converting low-energy photons into high-energy photons.40,41 Inspired this insight, incorporating appropriate amount of up-conversion materials which can indirectly utilize long-wavelength visible-light, holds great promise to extend the spectral response range of BiOBr and hence achieving the effective enhancement for its photocatalytic activity. Generally accepted, rare-earth elements mostly have up-conversion property, where the lanthanide Er possesses rich transition bands in the visible region, for example, at the wavelengths of 488 nm, 520 nm and 650 nm.42 Therefore, we selected Er ions to coupled into the BiOBr crystal lattice, forming the synthetic of Er doped BiOBr, to realize efficient utilization of solar energy.
Graphene, as a novel two-dimensional carbon material, possesses excellent electron mobility, superior optical transparency and high specific surface area.43–45 As the precursor of graphene, graphene oxide (GO) possesses abundant surface oxygen functional groups which enable it compound tightly with other materials and reduced to graphene simultaneously.46 Recently, using GO as the precursor, many BiOBr–graphene composites have been successfully synthesized, in which graphene was performed as an excellent co-catalyst. For example, Lee's group presents the composites via a simple solvothermal route.47 Zhang et al. successfully prepared the hybrids through a single-step microwave irradiation strategy.48 The composites showed good photocatalytic activity, owing to the efficient interface charge separation and transmission caused by the surface presence of graphene over BiOBr catalyst.49 In addition, the high flexibility of graphene and robust coordination interaction between graphene and BiOBr may give rise to high photocatalytic activity and stability of the photocatalyst.
For the first time, Er-doped BiOBr hollow microspheres wrapped with graphene nanosheets were successfully synthesized through a simple two-step hydrothermal method. Utilizing XRD, FT-IR, SEM, TGA, XPS, TEM, BET, UV-diffuse and PL techniques, a series of characterization of the samples were performed. In order to investigate the photocatalytic activity and stability of samples, photocatalytic degradation experiments under simulated visible-light were completed, using rhodamine B (RhB) solution as the target pollutants. Furthermore, the radicals trapping experiment was carried out and a possible mechanism for the photocatalytic reaction was put forward.
2. Experimental
2.1 Materials
2.1.1 Preparation of BiOBr hollow microspheres. In a typical process, Bi(NO3)3·5H2O (240 mg) and NaBr (520 mg) were sequentially dissolved in 20 ml boiled ethylene glycol solution (EG). After stirring for 30 min, the above solution was added drop-wise to 60 ml isopropanol (IPA) solution. Then, the mixture solution was sealed in 100 ml Teflon-lined autoclave, heating at 160 °C for 12 h. The product was collected, washed, and dried under room temperature for further characterization.
2.1.2 Preparation of Er-doped BiOBr hollow microspheres. Typically, the up-conversion element Er-doped BiOBr hollow microspheres were synthesized via a simple modification by adding appropriate amounts of Er(NO3)3·5H2O into the IPA solution in advance. The mole ratios of Er/Bi in as-prepared samples were 0.005, 0.01, 0.015 and 0.02, for convenience, which were marked as BE-0.5%, BE-1%, BE-1.5% and BE-2% respectively.
2.1.3 Synthesis of graphite oxide. GO was prepared from pre-oxidation graphite powder (325 mesh) via a modified Hummers' method as previous published.
2.1.4 Fabrication of BE-1.5% wrapped with graphene nanosheets. The hybrid photocatalysts of BE-1.5% wrapped with graphene nanosheets were prepared by a simple hydrothermal method. The mixture of BE-1.5% and appropriate amounts of GO aqueous solution was vigorous stirred for 4 h, then transferred to 100 ml Teflon-lined autoclave, to fill up to 80% of the total volume and, heated at 100 °C for 12 h. After filtrating, washing and drying, the final grey products were collected for further characterization. The mass ratio of GO and BE-1.5% were 1%, 3%, 5% respectively. According to the mass ratio, the as-prepared photocatalysts were marked as BE@GR-1, BE@GR-3, BE@GR-5, respectively.
2.2 Characterization of the catalysts
The crystalline structure of the samples was characterized via a Shimadzu XRD-6100 diffractometer. Fourier transform infrared spectroscopy (FT-IR, Nicolet 380) was used to determine the surface functional groups. The sample morphology was obtained using a field emission scanning electron microscope (JSM-7800F, JEOL) equipped with an energy dispersive analysis system of X-ray (EDX) and elemental mapping system. X-ray photoelectron spectroscopy (XPS) measurement by a Thermo VG ESCALAB-250 system. TEM images were performed by a JEOL JEM-2100F transmission electron microscope. UV-Vis diffuse reflectance spectra of the samples were measured by UV-Vis spectrophotometer (CARY100&300, VARIAN). The PL spectra of the photocatalysts were obtained using Hitachi F7000 fluorescence spectrophotometer. The TGA analysis was performed by the PerkinElmer diamond TG/DTA analyzer (Japan) at a heating rate of 10 °C min−1. The N2-sorption measurement was performed by using Micromeritics Tristar 3000 at 77 K, the specific surface area and the pore size distribution were estimated using the Brunauer–Emmett–Teller (BET) and Barrett–Joyner–Halenda (BJH) methods, respectively.
2.3 Photocatalytic test
The photocatalytic activity is proportional to the photocatalytic degradation rate, where we adopt RhB solution as the target pollutant. Typically, under simulated sunlight, the photocatalyst (20 mg) was dissolved into RhB solution (10 mg l−1). First, the mixture was stirred for 40 min to achieve adsorption/desorption equilibrium without light irradiation. Then, under illumination, the mixture was sampled every five minutes and centrifuged to remove the photocatalyst. Finally, the samples were quantitatively analyzed by using UV-Vis spectrophotometer. Afterwards, the degradation efficiency (%) was measured, using the following formula:| | |
Degradation efficiency (%) = (C0 − C)/C0 × 100%
| (1) |
where C0 is the initial concentration of RhB and C is the time-dependent concentration of dye upon irradiation. Furthermore, the degradation efficiency (%) in photocatalytic cycle experiments was obtained using the same process.
3. Results and discussion
3.1 XRD analysis
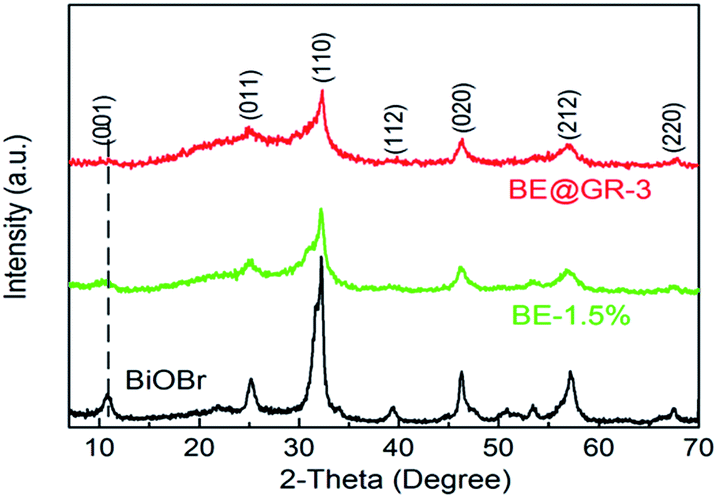
X-ray diffraction (XRD) is an effective way to study the crystal structure. The XRD patterns of BiOBr, BE-1.5% and BE@GR-3 were demonstrated (Fig. 1). Seven distinct diffraction peaks of the samples at 10.9°, 25.3°, 32.3°, 39.4°, 46.3°, 57.3° and 67.6° indexed to (001), (011), (110), (112), (020), (212) and (220) crystal planes (JCPDS 73-2061) of tetragonal phase BiOBr, indicating the successful synthesis of BiOBr-based hybrids. The peaks of Er ion and graphene are not found in the BE-1.5% and BE@GR-3, attributing to the low-amount of the species. For the samples modified with Er ions, their phases keep the same with pure BiOBr. However, the peaks indexed at (001) can be found with slight shift. In addition, the peaks intensity of BE-1.5% and BE@GR-3 are lower than that of pristine BiOBr. The poor intensity and slight shift of diffraction peaks maybe ascribed to the introduction of element Er into BiOBr crystal lattice, which causing the crystal lattice defects of BiOBr. Focusing on (001) crystal planes, BE@GR-3 displays a lower peak intensity compared with BE-1.5%, suggesting the formation of coordination interaction between graphene and the (001) facets of BiOBr subunits.50 In summary, the hybrid photocatalyst (Er-doped BiOBr wrapped with graphene) was successfully synthesized.
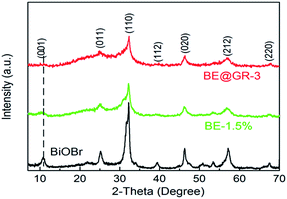 |
| | Fig. 1 XRD patterns of BiOBr, BE-1.5% and BE@GR-3. | |
3.2 FT-IR spectra analysis
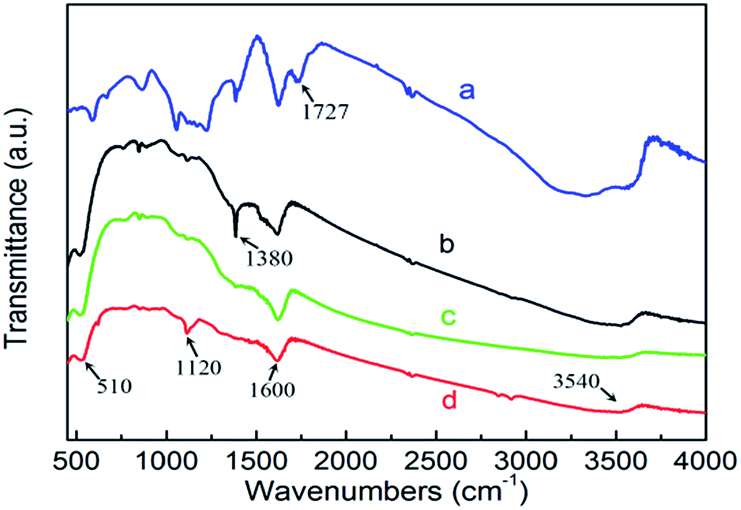
The information of functional groups or chemical bonds over the catalysts was analyzed by FT-IR spectra. Fig. 2 shows the FT-IR spectra of GO, BiOBr, BE-1.5% and BE@GR-3, marked as a, b, c, d respectively. The absorption band at 510 cm−1, as evidenced in the spectrum of BiOBr, BE-1.5% and BE@GR-3, is classified as the Bi–O functional group. Besides that, the absorption peaks of BE@GR-3 consist of O–H stretching vibration (3540 cm−1), C![[double bond, length as m-dash]](https://www.rsc.org/images/entities/char_e001.gif) C stretching vibration and O–H bending vibration (1600 cm−1), and carboxylates C–O stretching vibration (1120 cm−1). Specially, the C–O stretching peak at 1120 cm−1 is found in BE@GR-3 and bare GO, which is absent in the BiOBr and BE-1.5%, indicating the successful synthesis of the BiOBr wrapped with graphene. The CO stretching vibration (1727 cm−1) and other characteristic peaks of GO are not found in the BiOBr-based catalysts, revealing that the reduction of GO. The peak at 1380 cm−1 for pristine BiOBr is classified as carboxyl O–H stretching vibration (1400 cm−1), which is not found in BE-1.5%, owing to the introduction of element Er into BiOBr crystal lattice.
C stretching vibration and O–H bending vibration (1600 cm−1), and carboxylates C–O stretching vibration (1120 cm−1). Specially, the C–O stretching peak at 1120 cm−1 is found in BE@GR-3 and bare GO, which is absent in the BiOBr and BE-1.5%, indicating the successful synthesis of the BiOBr wrapped with graphene. The CO stretching vibration (1727 cm−1) and other characteristic peaks of GO are not found in the BiOBr-based catalysts, revealing that the reduction of GO. The peak at 1380 cm−1 for pristine BiOBr is classified as carboxyl O–H stretching vibration (1400 cm−1), which is not found in BE-1.5%, owing to the introduction of element Er into BiOBr crystal lattice.
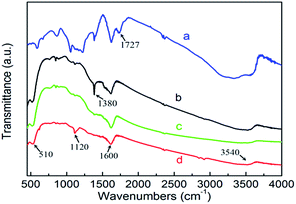 |
| | Fig. 2 FT-IR spectra of (a) GO, (b) BiOBr, (c) BE-1.5% and (d) BE@GR-3. | |
3.3 SEM analysis
The SEM images of BiOBr, BE-1.5% and BE@GR-3 were displayed (Fig. 3). We can see that the pristine BiOBr composed of quasi microspheres with a diameter of 1–2 μm (Fig. 3a). The enlarged view of BiOBr shows the microspheres with hollow structure assembled by irregular nanosheets (Fig. 3b). Compared with the pristine BiOBr, the morphology of BE-1.5% basically unchanged (Fig. 3c), and the hollow structure remained (Fig. 3d). The results demonstrate there is no obvious effect on the morphology structure of the catalyst by incorporating element Er into the BiOBr crystal lattice. Fig. 3e shows the graphene nanosheets with many wrinkles surface coated on BE-1.5% hollow microsphere. High magnification SEM image of BE@GR-3 further determines the hollow microspheres BE-1.5% wrapped with graphene nanosheets (Fig. 3f). The SEM images clearly show the successful formation of Er-doped BiOBr hollow microspheres wrapped with graphene nanosheets.
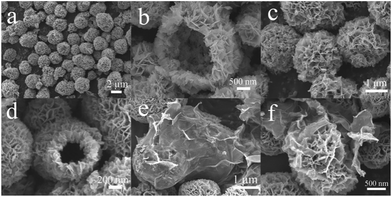 |
| | Fig. 3 SEM images with different magnification of (a and b) BiOBr, (c and d) BE-1.5% and (e and f) BE@GR-3. | |
3.4 EDS analysis
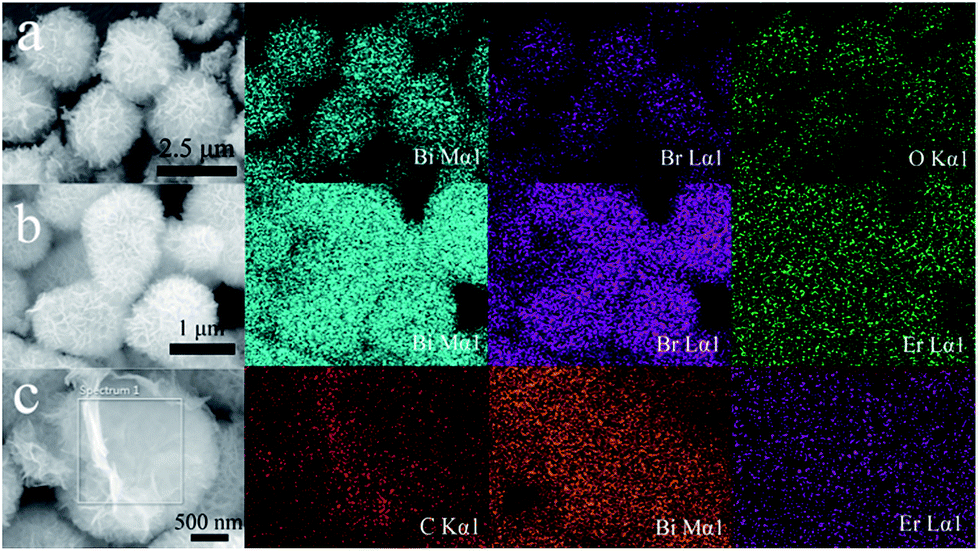
The type and distribution of typically elements from the samples were received from EDS mapping images. Fig. 4a–c represent the EDS mapping images of BiOBr, BE-1.5% and BE@GR-3 respectively. From Fig. 4a, the elements Bi, O and Br are distributed homogeneously within individual microspheres, suggesting the successful synthesis of BiOBr hollow microspheres. The morphology of BE-1.5% remains unchanged comparison with the pristine BiOBr, however, the chemical component is indeed altering after incorporating the element Er into BiOBr matrix (Fig. 4b). The element Er is distributed homogeneously with the element Bi and Br, indicating the successful synthesis of Er-doped BiOBr. Fig. 4c shows the focus of graphene nanosheets which are deposited over the BE-1.5% microspheres, identified as element C, which is in agreement with the conclusion of Er-doped BiOBr microspheres wrapped with graphene nanosheets.
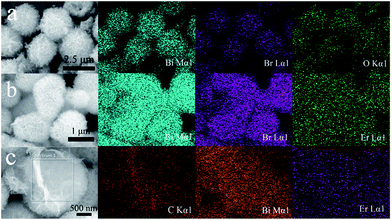 |
| | Fig. 4 SEM images and EDS mappings of (a) BiOBr with Bi, Br, O elemental maps, (b) BE-1.5% with Bi, Br, Er elemental maps and (c) BE@GR-3 with C, Bi, Er elemental maps. | |
3.5 Thermogravimetric analysis (TGA)
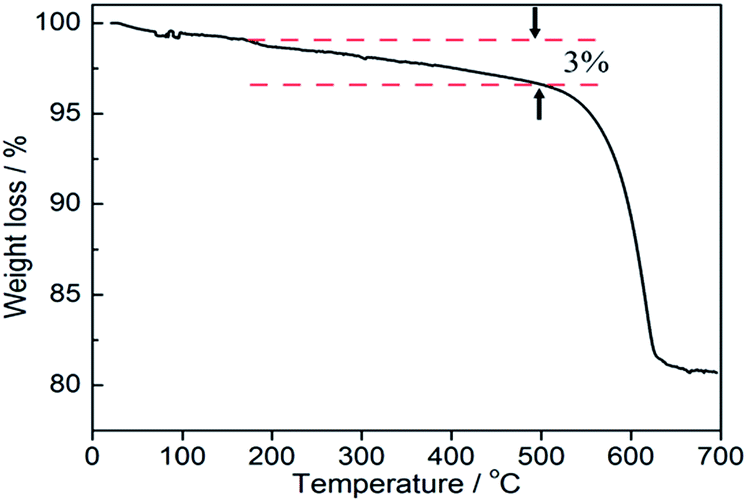
TGA measurement was used to evaluate the weight percentage of graphene in BE@GR-3. As can be seen in Fig. 5, the first weight loss in the temperature range from 20 to 150 °C is mainly assigned to the de-intercalation or removal of moisture content, mainly water molecules. The second major weight loss centered at 200–530 °C was mainly ascribed to the removal of oxygen containing functional groups and the decomposition of carbon skeleton in composite, which is corresponding to the loss of graphene (∼3.0%), consistent with the experimental value. Finally, when the BE@GR-3 composite was heated to 650 °C, the residual mass was calculated as 81%, which reveals the good thermal stability of photocatalyst.51,52 The main reason was the strong interaction between the GO and the BiOBr matrix that made the composite highly stable.
 |
| | Fig. 5 TGA spectrum of BE@GR-3 composite. | |
3.6 XPS analysis
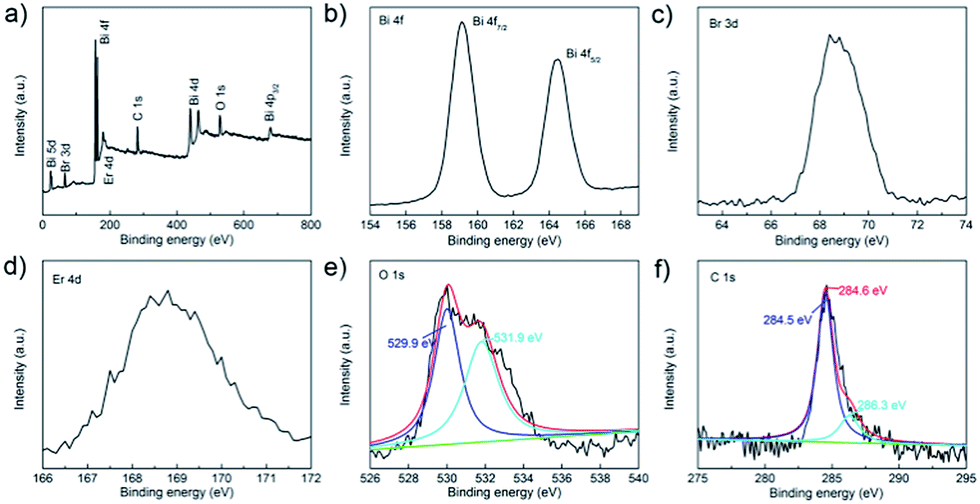
The surface element composition of BE@GR-3 was further studied by X-ray photoelectron spectroscopy (XPS), and the corresponding chemical states were received. The XPS survey spectra of BE@GR-3 reveals that the sample is composed of elements of Bi, Br, Er, O and C (Fig. 6a), which is according with the chemical composition of photocatalyst. The corresponding chemical states of elements were respectively investigated in Fig. 6b–f. Two strong peaks at 159.1 and 164.5 eV in the high-resolution Bi 4f spectra are assigned to Bi 4f7/2 and Bi 4f5/2, which are characteristic of the Bi3+ in BE@GR-3 sample (Fig. 6b). Meanwhile, the peak with binding energy of 68.4 eV (Fig. 6c), belonged to Br 3d, is the characteristic of Br− in the photocatalyst. The peak in Er 4d spectra (Fig. 6d) at 168.6 eV is consistent with erbium in Er2O3,53 revealing the existence of Er3+ in the sample. As shown in Fig. 6e, the spectrum for O 1s can be fitted to two peaks at 529.9 and 531.9 eV, which are ascribed to the lattice oxygen and surface hydroxyl groups of catalyst, respectively. The low intensity of surface hydroxyl groups is compatible with the results of FT-IR analysis. The C 1s spectra centered at 284.6 eV as reference can be deconvoluted to two peaks at 284.5 and 286.3 eV, which are assigned to the typical carbon–carbon (C–C) bonds and C–O bonds, respectively.54 Besides that, the peak of CO bonds around 288.4 eV is also not found, further verifying the FT-IR analysis.
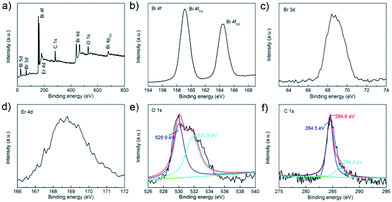 |
| | Fig. 6 XPS spectra of the as-prepared BE@GR-3: (a) survey, (b) Bi 4f, (c) Br 3d, (d) Er 4d, (e) O 1s, and (f) C 1s. | |
3.7 TEM images analysis
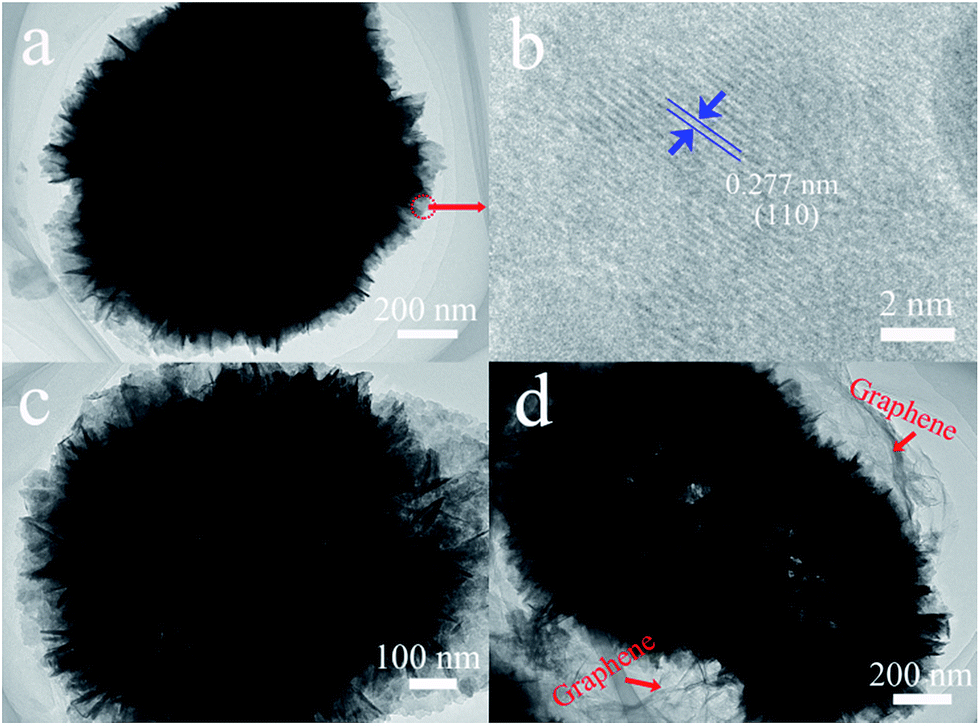
The TEM images further determine above morphology and microstructure analysis. Fig. 7a shows the TEM image of BiOBr with black round edge and bright center, further evidencing the hollow microsphere structure of BiOBr. Besides that, the black round edge is inserted with irregular nanosheets, which is well consistent with the SEM images of BiOBr. The HRTEM image of BiOBr (Fig. 7b) shows crystals with interplanar spacing of 0.277 nm, which corresponding to the (110) spacing of BiOBr. The above results can infer the conclusion of (001) dominant exposed-facet of BiOBr.55 The TEM image of BE-1.5% is similar with the pristine BiOBr, which is according with the SEM analysis (Fig. 7c). As shown in the image of BE@GR-3 (Fig. 7d), ultrathin mist-like graphene with distinct wrinkle were anchored on the hollow microsphere can be clearly observed, confirming the synthesis of BiOBr hollow microspheres wrapped with graphene nanosheets.
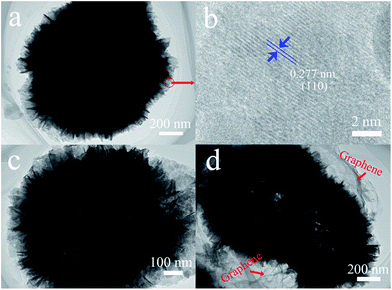 |
| | Fig. 7 TEM images of (a) BiOBr, (c) BE-1.5%, (d) BE@GR-3 and HRTEM image of (b) BiOBr. | |
3.8 BET analysis
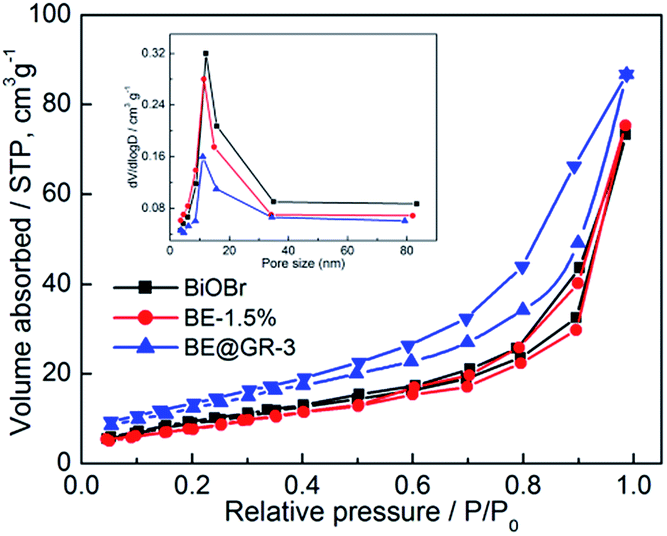
Fig. 8 shows the nitrogen sorption isotherms of BiOBr, BE-1.5% and BE@GR-3, respectively. All the nitrogen sorption isotherms exhibit type IV classification with typical hysteresis loops in the relative pressure (P/P0) range of 0.45–0.95, which belong to mesopore characteristics. The pore sizes of the samples were calculated to be 11 nm, using the Barrette–Joynere–Halenda (BJH) method (Fig. 8 inset). The Brunauer–Emmett–Teller (BET) surface areas are about 29, 27 and 43 m2 g−1 for the pristine BiOBr, BE-1.5% and BE@GR-3, respectively. The specific surface area of BE-1.5% is generally equaled with the pristine BiOBr, confirming the remained of morphology and structure. The increase in the surface area of the BE@GR-3 composites mainly results from the addition of the graphene nanosheets with a low density and high surface area, which may offer a large interface to facilitate the adsorption and catalytic performance.
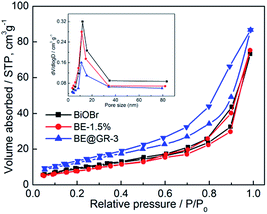 |
| | Fig. 8 Nitrogen adsorption–desorption isotherms of BiOBr, BE-1.5% and BE@GR-3; inset: the corresponding pore-size distribution. | |
3.9 Formation mechanism
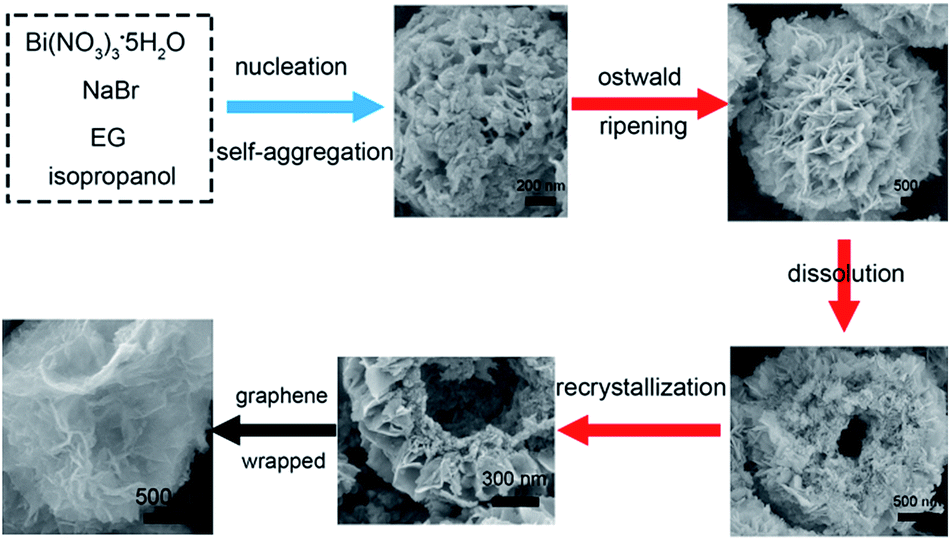
Based on the above experimental results, the BiOBr-based catalysts with hollow sphere structure are indeed synthesized and a possible growth pattern and formation mechanism is shown in Scheme 1. First, the alkoxide complexes formed by Bi3+ cations and EG lead to a slow nucleation of BiOBr, which tend to assemble into spherical agglomerates driven by reducing the surface energy of the nanoparticles (step 1 in Scheme 1).56 To our knowledge, the BiOBr crystalline with tetragonal matlockite structure are constructed by [Bi2O2] slabs interleaving double slabs of bromine atoms, which is partly similar to Bi2WO6 and Bi2MoO6.57,58 Then the solution environment is weakly acidic, the smaller crystallites in the spherical agglomerates are gradually dissolved and Bi2O22+ and Br− ions are generated under solvothermal conditions because of the concentration difference between the solution and the surface of the microspheres, which is similar to the previous research.59 And the ions of Bi2O22+ and Br− in the solution preferential recrystallization on the small protuberances of spherical surface, which provide many high-energy sites for nanocrystalline growth.60 Then, these self-agglomerate spheres would further dissolve and recrystallize to generate BiOBr nanosheets assembled into hollow microspheres for high intrinsic anisotropic properties. Thus, hierarchical BiOBr hollow microspheres are synthesized because of mass diffusion and Ostwald ripening (step 2 in Scheme 1). And, few Er ions doping not obviously affect the growth process, as performed by the experiment result. Finally, the Er-doped BiOBr hollow microspheres wrapped with graphene nanosheets were synthesized via a simple hydrothermal method (step 3 in Scheme 1), using CTAB as the surfactant, which is inspired by Zhao's study.61
 |
| | Scheme 1 The formation mechanism of Er-doped BiOBr hollow microspheres wrapped with graphene nanosheets. | |
3.10 UV-Vis spectroscopy analysis
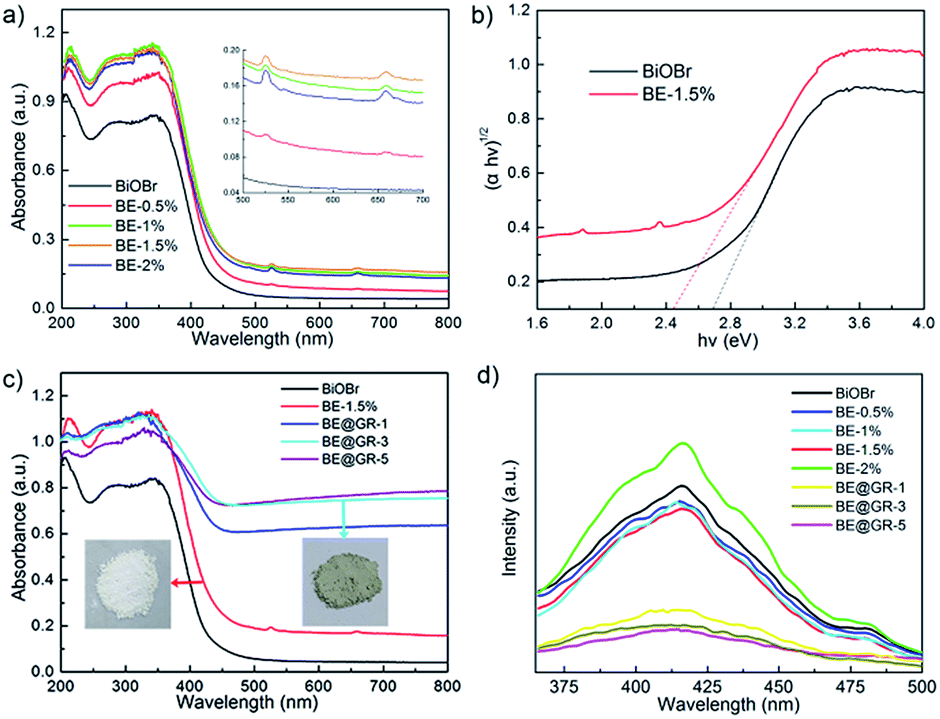
The optical absorption property of samples was tested by UV-Vis diffuse reflectance spectra. The spectra of the samples with different concentrations of Er element were put forward (Fig. 9a). After incorporating element Er into BiOBr crystal lattice, obvious shift of the photoabsorption edges can be found. On the other hand, the intensity and range of the photoabsorption were also significantly improved. Furthermore, the lower absorbance of BE-2% compared with BE-1% and BE-1.5%, which is contrary with the doping amount maybe owing to the resulting poor crystallization. In summary, 1.5% mole ratio doping amount endowed the as-prepared sample with best optical absorption property. Interestingly, two characteristic absorption peaks at the wavelength of 520 nm and 650 nm were found (Fig. 9a inset), which were not found in the pristine BiOBr and other BiOBr-based hybrids. This optical phenomenon can be ascribed to the up-conversion effect of rare earth element Er. Besides that, the energy band gap can be evaluated through using the eqn (2).
 |
| | Fig. 9 (a) UV-Vis diffuses reflectance spectra of the Er-doped BiOBr samples with different Er values and (inset) the corresponding part ranging from 500 nm to 700 nm and (c) BE-1.5% wrapped with different amounts of graphene nanosheets and (inset) digital photographs of catalyst grains of BE-1.5% and BE@GR-3, (b) curves of (αhν)1/2 versus photon energy (hν) of the as-prepared samples and (d) the PL spectra of as-prepared samples. | |
The energy band gap (Eg values) of BiOBr and BE-1.5% were estimated to be about 2.7 eV and 2.45 eV respectively (Fig. 9b), suggesting the impurity energy level introduced below the conduction band. The reduced energy band gap and indirect utilization of long-wavelength visible-light were simultaneously achieved by the novel introduction of up-conversion element Er into the BiOBr photocatalyst.
The spectral responsive property of the BE-1.5% wrapped with graphene nanosheets was investigated (Fig. 9c). No evident shift of the photoabsorption edges of the samples are found, revealing the graphene is surface wrapping the photocatalyst, which is consistent with the FT-IR analysis. The absorbance at the wavelength ranging from 200 nm to 450 nm for BE-1.5%, BE@GR-1, BE@GR-3 and BE@GR-5 is similar. The high absorbance in the tail region can be ascribed to the dark background owing to the graphene nanosheets wrapping. The optical property has been reported in other hybrid photocatalysts coupling with graphene.62,63 In summary, the incorporated graphene is not essentially impacting the solar energy utilization.
3.11 PL spectrum analysis
The separation efficiency of photogenerated electrons and holes was investigated by photoluminescence emission spectra (PL spectra) (Fig. 9d). Generally accepted, high fluorescence intensity represents the high recombination rate of photocarriers which gives rise to low photocatalytic activity. The fluorescence intensity of samples were BE-2%, BiOBr, BE-0.5%, BE-1%, BE-1.5%, BE@GR-1, BE@GR-3 and BE@GR-5 from top to bottom, and the last three were significant lower than that of the others. It is worth noted that minor Er elements doping slightly decreased the fluorescence intensity of catalysts, indicating the enhanced charge separation caused by the impurity energy level incorporating. However, excess impurity ions are incorporated into the photocatalyst which become new charge recombination centers, resulting in a weak charge separation and strong fluorescence effect. After coupling with graphene nanosheets, the fluorescence intensity of photocatalyst was obviously decreased, confirming the incorporated graphene into the photocatalysis system is an effective pathway to repress the recombination of photocarriers and thus resulting efficient charge transfer, which is very beneficial for the enhancement of photocatalytic activity.
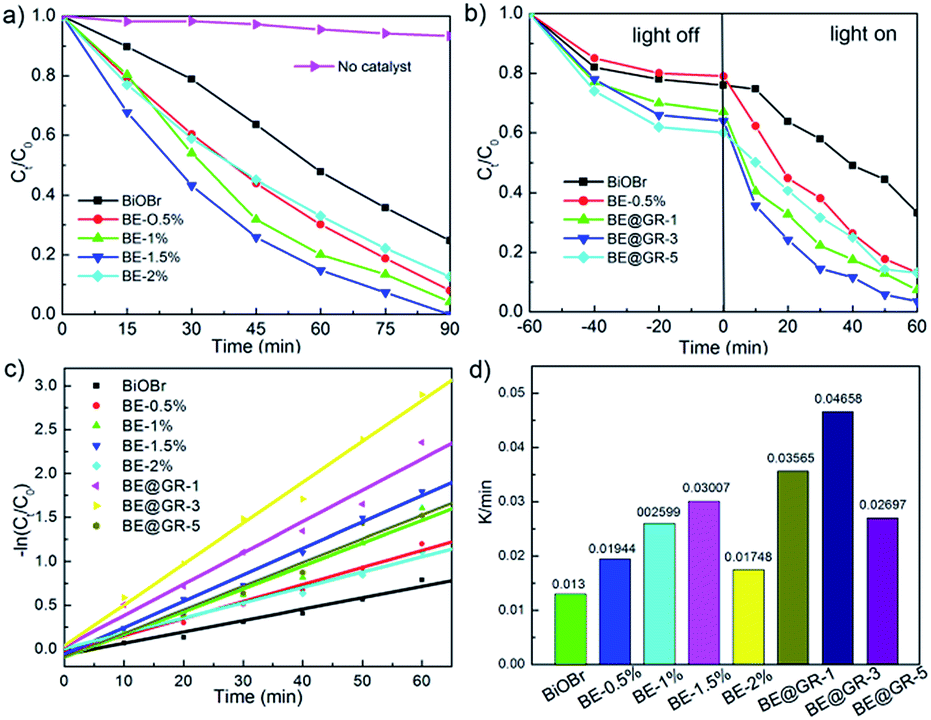
3.12 Photocatalytic activity analysis
Fig. 10 shows the photocatalyst degradation performance over BiOBr-based samples, using RhB as the target pollution. It is found that the self-photodegradation of RhB is almost negligible and the Er-doped BiOBr samples have higher photocatalytic degradation rates (Fig. 10a), confirming the incorporated Er ions have a good effect on the photocatalytic activity. Furthermore, BE-1.5% possesses the best photocatalytic activity, according with the above property analysis. The influence of coupling graphene on the photocatalytic degradation rate was explored (Fig. 10b). Interestingly, the dye absorption performances are significantly increased with graphene wrapping, and when BE-1.5% wrapped with 3 wt% graphene nanosheets exhibits the most excellent photocatalytic activity. To directly observe the photocatalytic activity, the photocatalytic degradation kinetics equation was using (Fig. 10c),where C0 and Ct are the concentrations of RhB at times 0 and t, respectively, and k is the apparent first-order rate constant (min−1). The corresponding k values of samples incorporated with different amounts of Er element and graphene were calculated to be 0.013, 0.01944, 0.02599, 0.03007, 0.01748, 0.03565, 0.04658 and 0.02697 min−1 respectively (Fig. 10d). BE-1.5% possesses the maximum k value in the Er-doped BiOBr samples, which is almost 2.3 times higher than that of the pristine BiOBr. In addition, the BE@GR-3 exhibits the best photocatalytic decomposition efficiency.
 |
| | Fig. 10 Variation of RhB concentration against irradiation time using (a) Er-doped BiOBr samples with different REr values, (b) BE-1.5% wrapped with different concentrations of GO, (c) −ln(Ct/C0) versus irradiation time and (d) the rate constant k of the degradation of RhB in the presence of different catalysts. | |
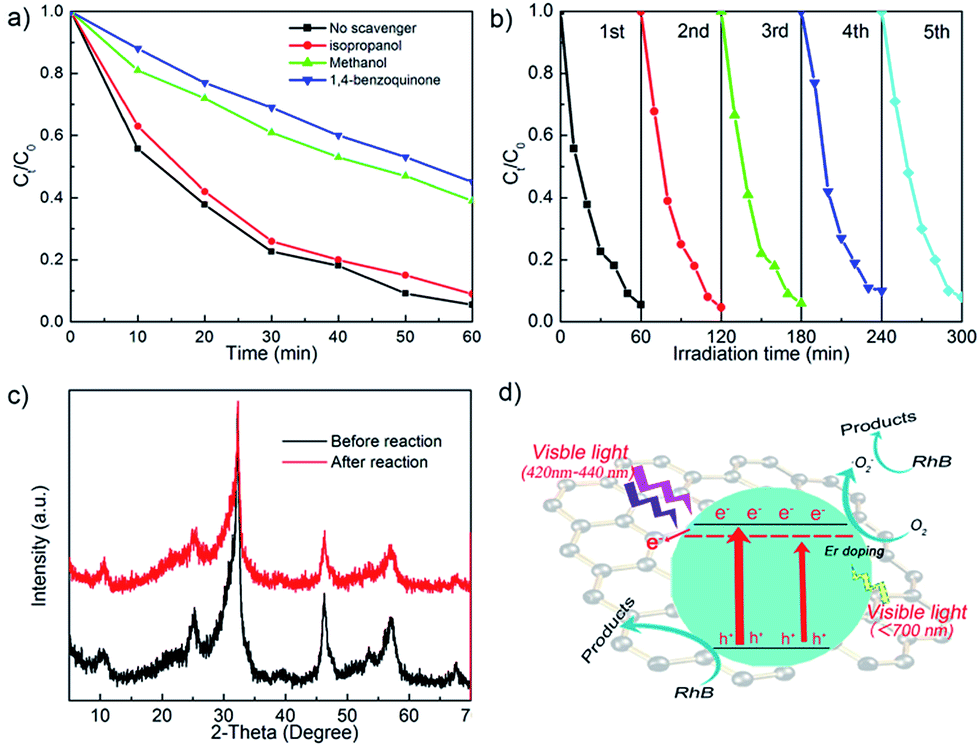
3.13 Radical trapping experiments
To investigate the surface reaction mechanism of BE@GR-3, radical trapping experiments were performed. In the typical degradation experiment, three radical scavengers, isopropanol (IPA), 1,4-benzoquinone (BQ) and methanol as the scavengers of ˙OH, ˙O2− radicals and h+, were added into the degradation process system respectively, and the results were shown in Fig. 11a.
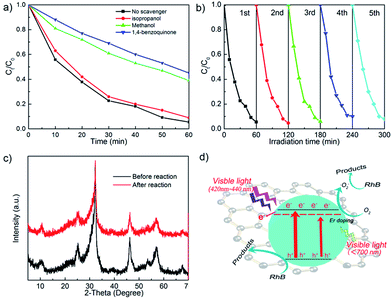 |
| | Fig. 11 (a) Radical trapping experiments over BE@GR-3 using different scavengers, (b) recycling tests over BE@GR-3 for the degradation of RhB under visible light irradiation, (c) XRD diffraction patterns of the BE@GR-3 before and after five cycles and (d) proposed mechanism for the photocatalytic degradation of RhB over BE@GR-3 under visible-light irradiation. | |
As shown, the degradation efficiency of BE@GR-3 with the addition of IPA is nearly coincident with that of the control group, implying ˙OH played little influence upon the reaction. Moreover, higher curves with the presence of methanol and BQ represent the low photocatalytic activity. It can be inferred that both h+ and ˙O2− play key roles in the photocatalytic degradation reaction.
3.14 Photocatalytic stability tests
The excellent photocatalyst should possess high photocatalytic stability for future application. To study the photocatalytic stability of the BE@GR-3, photocatalytic cycle reaction was carried out, and the results were shown in Fig. 11b. After five cycles, the degradation rate of the catalyst is slightly decreased, maybe ascribed to the loss of photocatalyst in the washing stage. The XRD patterns of BE@GR-3 before and after the five cycles were demonstrated (Fig. 11c), which are basically unchanged, further confirming the excellent stability.
3.15 Proposed mechanism
Herein, we propose a possible mechanism for the photocatalytic degradation process (Fig. 11d). Based on the experiment results, BiOBr hollow microspheres wrapped with graphene nanosheets wrapping possess large specific surface area, resulting with strong dye adsorption performance and abundant surface reaction sites. Under simulated sunlight irradiation, the BiOBr microspheres with hollow structure assembled by nanosheets make multiple scattering for incident light, realizing the better solar energy harvesting.3,4 Following, BiOBr photocatalyst can convert the absorbed photons into energetic electrons and holes, respectively. The introduction of up-conversion element Er into the BiOBr crystal lattice gives rises to impurity energy level introduced below the conduction band. The impurity energy level paves a shorter channel for the energy conversion, leading to the broadened photoresponse range. In addition, the dramatic photoresponse at the wavelength around 520 nm and 650 nm of photocatalyst was found, due to the up-conversion property of rare-earth element Er. That is, the introduction of element Er endows BiOBr matrix the ability to absorb the nearly all visible light, which greatly broaden the optical window, resulting the efficient solar energy harvesting. As a result, the efficient solar energy harvesting leads to the more photoinduced electrons (or holes) generated. Then, the electrons can be captured and transferred rapidly by the graphene nanosheets, thus greatly suppressing the surface charge recombination. The active electrons on the surface of catalysts can react with adsorbed O2 and generate ˙O2−, in which ˙O2− can decompose the RhB. On the other hand, the photoinduced holes can directly oxidize the RhB. The synergistic effect between efficient solar energy harvesting and charge separation is contributed to the high photocatalyst activity. Moreover, the robust coordination interaction between graphene and the (001) facets of BiOBr subunits, enables the remarkable photocatalytic stability for repeated utilization of photocatalyst.
4. Conclusion
In summary, we successfully synthesized the novel photocatalyst of Er-doped BiOBr hollow microspheres wrapped with graphene nanosheets, which possesses excellent photocatalytic activity and stability. The Er-doped BiOBr hollow microspheres possess efficient solar energy harvesting, attributing to two aspects, one is the reduced energy band gap by introducing impurity energy level into the energy band, and the other is indirectly utilizing long-wavelength visible-light caused by up-conversion effect. The sample wrapped with graphene nanosheets displays better photocatalytic activity, owing to the efficient interface charge separation and transmission. What's more, the high photocatalytic stability of as-prepared sample maybe ascribed to the robust coordination interaction between graphene and the (001) facets of BiOBr subunits. This work sheds light on the comprehensive promoting the photocatalytic activity by means of a rational design.
Acknowledgements
This research was supported by the National Natural Science Foundation of China (Grant no. 21476033 and 21577008).
Notes and references
- Z. Xiong, H. B. Wang, N. Y. Xu, H. L. Li, B. Z. Fang, Y. C. Zhao, J. Y. Zhang and C. G. Zheng, Int. J. Hydrogen Energy, 2015, 40, 10049–10062 CrossRef CAS.
- S. Q. Fan, C. Kim, B. Z. Fang, K. X. Liao, G. J. Yang, C. J. Li, J. J. Kim and J. Ko, J. Phys. Chem. C, 2011, 115, 7747–7754 CAS.
- B. Z. Fang, A. Bonakdarpour, K. Reilly, Y. Xing, F. Taghipour and D. P. Wilkinson, ACS Appl. Mater. Interfaces, 2014, 6, 15488–15498 CAS.
- B. Z. Fang, Y. Xing, A. Bonakdarpour, S. C. Zhang and D. P. Wilkinson, ACS Sustainable Chem. Eng., 2015, 3, 2381–2388 CrossRef CAS.
- Z. Z. Wu, B. Z. Fang, Z. P. Wang, C. L. Wang, Z. H. Liu, F. Y. Liu, W. Wang, A. Alfantazi, D. Z. Wang and D. P. Wilkinson, ACS Catal., 2013, 3, 2101–2107 CrossRef CAS.
- Z. Z. Wu, C. Y. Tang, P. Zhou, Z. H. Liu, Y. S. Xu, D. Z. Wang and B. Z. Fang, J. Mater. Chem. A, 2015, 3, 13050–13056 CAS.
- K. Honda and A. Fujishima, Nature, 1972, 238, 37–38 CrossRef.
- J. Schneider, M. Matsuoka, M. Takeuchi, J. Zhang, Y. Horiuchi, M. Anpo and D. W. Bahnemann, Chem. Rev., 2014, 114, 9919–9986 CrossRef CAS PubMed.
- E. M. El-Menyawy, I. T. Zedan and A. A. Azab, J. Alloys Compd., 2017, 695, 3429–3434 CrossRef CAS.
- R. X. Zhao, X. P. Li, J. X. Su and X. H. Gao, Appl. Surf. Sci., 2017, 392, 810–816 CrossRef CAS.
- Y. C. Hao, X. L. Dong, S. R. Zhai, X. Y. Wang, H. C. Ma and X. F. Zhang, Chem.–Eur. J., 2016, 22, 1–8 CrossRef.
- Y. C. Hao, X. L. Dong, S. R. Zhai, X. Y. Wang, H. C. Ma and X. F. Zhang, RSC Adv., 2016, 6, 35709–35718 RSC.
- Y. C. Hao, X. L. Dong, X. Y. Wang, H. C. Ma and X. F. Zhang, RSC Adv., 2016, 6, 102155–102158 RSC.
- J. Li, Y. Yu and L. Z. Zhang, Nanoscale, 2014, 6, 8473–8488 RSC.
- M. Shang, W. Z. Wang and L. Zhang, J. Hazard. Mater., 2009, 167, 803–809 CrossRef CAS PubMed.
- W. B. Li, Y. P. Zhang, Y. Y. Bu and Z. Y. Chen, J. Alloys Compd., 2016, 680, 677–684 CrossRef CAS.
- C. Q. Xu, H. H. Wu and F. L. Gu, J. Hazard. Mater., 2014, 275, 185–192 CrossRef CAS PubMed.
- F. F. Duo, Y. W. Wang, C. M. Fan, X. C. Zhang and Y. F. Wang, J. Alloys Compd., 2016, 685, 34–41 CrossRef CAS.
- L. Lin, M. H. Huang, L. P. Long and D. H. Chen, J. Alloys Compd., 2014, 615, 929–932 CrossRef CAS.
- Y. C. Feng, L. Li, J. W. Li, J. F. Wang and L. Liu, J. Hazard. Mater., 2011, 192, 538–544 CrossRef CAS PubMed.
- S. Bai, J. Jiang, Q. Zhang and Y. J. Xiong, Chem. Soc. Rev., 2015, 44, 2893–2939 RSC.
- S. Q. Liu, Z. R. Tang, Y. G. Sun, J. C. Colmenares and Y. J. Xu, Chem. Soc. Rev., 2015, 44, 5053–5075 RSC.
- D. Robert and S. Malato, Sci. Total Environ., 2002, 291, 85–97 CrossRef CAS PubMed.
- X. M. Zhang, G. B. Ji, Y. S. Liu, X. G. Zhou, Y. Zhu, D. N. Shi, P. Zhang, X. Z. Cao and B. Y. Wang, Phys. Chem. Chem. Phys., 2015, 17, 8078–8086 RSC.
- Y. C. Hao, X. L. Dong, S. R. Zhai, X. Y. Wang, H. C. Ma and X. F. Zhang, Chem. Commun., 2016, 52, 6525–6528 RSC.
- Y. C. Hao, X. L. Dong, S. R. Zhai, X. Y. Wang, H. C. Ma and X. F. Zhang, J. Mater. Chem. A, 2016, 4, 8298–8307 CAS.
- X. Li, G. H. Jiang, Z. Wei, X. H. Wang, W. X. Chen and L. Shen, MRS Commun., 2013, 3, 219–224 CrossRef CAS.
- Z. S. Liu, B. T. Wu, Y. L. Zhao, J. N. Niu and Y. B. Zhu, Ceram. Int., 2014, 40, 5597–5603 CrossRef CAS.
- B. Pare, B. Sarwan and S. B. Jonnalagadda, Appl. Surf. Sci., 2011, 258, 247–253 CrossRef CAS.
- R. Wang, G. Jiang, X. Wang, R. Hu, X. Xi, S. Bao, Y. Zhou, T. Tong, S. Wang, T. Wang and W. Chen, Powder Technol., 2012, 228, 258–263 CrossRef CAS.
- G. H. Jiang, X. H. Wang, Z. Wei, X. Li, X. G. Xi, R. B. Hu, B. L. Tang, R. J. Wang, S. Wang, T. Wang and W. X. Chen, J. Mater. Chem. A, 2013, 1, 2406–2410 CAS.
- D. Wu, S. T. Yue, W. Wang, T. C. An, G. Y. Li, H. Y. Yip, H. J. Zhao and P. K. Wong, Appl. Catal., B, 2016, 192, 35–45 CrossRef CAS.
- J. Li, K. Zhao, Y. Yu and L. Z. Zhang, Adv. Funct. Mater., 2015, 25, 2189 CrossRef CAS.
- X. C. Song, Y. F. Zheng, H. Y. Yin, J. N. Liu and X. D. Ruan, New J. Chem., 2016, 40, 130–135 RSC.
- J. Li, L. J. Cai, J. Shang, Y. Yu and L. Z. Zhang, Adv. Mater., 2016, 28, 4059–4064 CrossRef CAS PubMed.
- X. M. Jia, J. Cao, H. L. Lin, M. Y. Zhang, X. M. Guo and S. F. Chen, RSC Adv., 2016, 6, 55755–55763 RSC.
- Q. Y. Wang, R. C. Jin, M. Zhang and S. M. Gao, J. Alloys Compd., 2017, 690, 139–144 CrossRef CAS.
- X. D. Chen, X. Su, H. M. Duan, B. L. Liang, Y. Q. Huang and T. Zhang, Catal. Today, 2017, 281, 312–318 CrossRef CAS.
- C. Regmi, Y. K. Kshetri, S. K. Ray, R. P. Pandey and S. W. Lee, Appl. Surf. Sci., 2017, 392, 61–70 CrossRef CAS.
- W. W. Wu, D. Q. Chen, Y. Zhou, Z. Y. Wan and Z. G. Ji, J. Alloys Compd., 2016, 682, 275–283 CrossRef CAS.
- J. X. Xia, M. X. Ji, W. B. Li, J. Di, H. Xu, M. Q. He, Q. Zhang and H. M. Li, Colloids Surf., A, 2016, 489, 343–350 CrossRef CAS.
- Z. J. Zhang, W. Z. Wang and Y. Zhou, Appl. Surf. Sci., 2014, 319, 250–255 CrossRef CAS.
- X. F. Chang, M. A. Gondal, B. Zhang, Y. S. Liu, G. B. Ji and X. M. Zhang, Appl. Surf. Sci., 2012, 258, 7826–7832 CrossRef.
- C. Lai, M. M. Wang, G. M. Zeng, Y. G. Liu, D. L. Huang, C. Zhang, R. Z. Wang, P. Xu, M. Cheng, C. Huang, H. P. Wu and L. Qin, Appl. Surf. Sci., 2016, 390, 368–376 CrossRef CAS.
- X. Pan, Y. Zhao, S. Liu, C. L. Korzeniewski, S. Wang and Z. Y. Fan, ACS Appl. Mater. Interfaces, 2012, 4, 3944–3950 CAS.
- E. Yazici, S. Yanik and M. B. Yilmaz, Carbon, 2017, 111, 822–827 CrossRef CAS.
- T. T. Jiang, J. L. Li, Z. Sun, X. J. Liu, T. Lu and L. K. Pan, Ceram. Int., 2016, 42, 16463–16468 CrossRef CAS.
- S. Y. Song, W. Gao, X. Wang, X. Y. Li, D. P. Liu, Y. Xing and H. J. Zhang, Dalton Trans., 2012, 41, 10472–10476 RSC.
- H. P. Li, T. X. Hu, N. Du, R. J. Zhang, J. Q. Liu and W. G. Hou, Appl. Catal., B, 2016, 187, 342–349 CrossRef CAS.
- H. Li, J. Shang, Z. H. Ai and L. Z. Zhang, J. Am. Chem. Soc., 2015, 137, 6393–6399 CrossRef CAS PubMed.
- Y. J. Mai, D. Zhang, Y. Q. Qiao, C. D. Gu, X. L. Wang and J. P. Tu, J. Power Sources, 2012, 216, 201–207 CrossRef CAS.
- Z. Qiong, H. Y. Qiu, C. X. Gang, H. D. Hu, L. L. Jiang, Y. Ting and J. L. Li, Chin. Sci. Bull., 2011, 56, 331–339 CrossRef.
- Z. S. Liu, Z. L. Liu, J. L. Liu, J. W. Zhang, T. F. Zhou and X. Ji, Mater. Res. Bull., 2016, 76, 256–263 CrossRef CAS.
- Z. H. Ai, W. K. Ho and S. C. Lee, J. Phys. Chem. C, 2011, 115, 25330–25337 CAS.
- D. Wu, B. Wang, W. Wang, T. C. An, G. Y. Li, T. W. Ng, H. Y. Yip, C. M. Xiong, H. K. Lee and P. K. Wong, J. Mater. Chem. A, 2015, 3, 15148–15155 CAS.
- M. Shang, W. Z. Wang and H. L. Xu, Cryst. Growth Des., 2009, 9, 991 CAS.
- L. W. Zhang, T. G. Xua, X. Zhao and Y. F. Zhua, Appl. Catal., B, 2010, 98, 138 CrossRef CAS.
- H. Xu, W. Wang, W. Zhu and L. Zhou, Nanotechnology, 2006, 17, 3649 CrossRef CAS.
- G. C. Xi, K. Xiong, Q. B. Zhao, R. Zhang, H. B. Zhang and Y. T. Qian, Cryst. Growth Des., 2006, 6, 577 CAS.
- L. S. Zhang, W. Z. Wang, Z. G. Chen, L. Zhou, H. L. Xu and W. Zhu, J. Mater. Chem., 2007, 17, 2526 RSC.
- F. X. Wang, C. Wang, Y. J. Zhao, Z. C. Liu, Z. Chang, L. J. Fu, Y. S. Zhu, Y. P. Wu and D. Y. Zhao, Small, 2016, 12, 6207–6213 CrossRef CAS PubMed.
- H. Huang, X. Han, X. Li, S. Wang, P. K. Chu and Y. Zhang, ACS Appl. Mater. Interfaces, 2015, 7, 482–492 CAS.
- X. J. Wen, C. Zhang, C. G. Niu, L. Zhang, D. W. Huang, X. Y. Wang, X. G. Zhang and G. M. Zeng, RSC Adv., 2016, 6, 4035 RSC.
|
| This journal is © The Royal Society of Chemistry 2017 |
Click here to see how this site uses Cookies. View our privacy policy here. 
 Open Access Article
 This Open Access Article is licensed under a Creative Commons Attribution-Non Commercial 3.0 Unported Licence
 *,
Yuchen Hao,
Xiuying Wang,
Hongchao Ma and
Xiufang Zhang
*,
Yuchen Hao,
Xiuying Wang,
Hongchao Ma and
Xiufang Zhang