
 Open Access Article
 This Open Access Article is licensed under a
 Creative Commons Attribution 3.0 Unported Licence
Functionalization of BaTiO3 nanoparticles with electron insulating and conducting organophosphazene-based hybrid materials†
George S. Pappas a,
Chaoying Wan*a,
Chris Bowenb,
David M. Haddletonc and
Xiaobin Huangd
a,
Chaoying Wan*a,
Chris Bowenb,
David M. Haddletonc and
Xiaobin Huangd
aInternational Institute for Nanocomposites Manufacturing (IINM), WMG, University of Warwick, CV4 7AL, UK. E-mail: chaoying.wan@warwick.ac.uk
bMaterials and Structures Centre, Department of Mechanical Engineering, University of Bath, BA2 7AY, UK
cDepartment of Chemistry, University of Warwick, CV4 7AL, UK
dSchool of Aeronautics and Astronautics, Shanghai Jiao Tong University, 200240, P. R. China
First published on 3rd April 2017
Abstract
Novel core–shell structured organophosphazene (OPZ) coated BaTiO3 nanoparticles (OPZ@BaTiO3) were produced via a facile and rapid one-step nucleophilic substitution reaction in ambient conditions. The morphology, structure and textural properties of the core–shell nanoparticles were analysed via electron microscopy, spectroscopy, thermogravimetry and porosimetry, and the dielectric properties were evaluated by impedance spectroscopy. The thickness of the cross-linked OPZ shell was readily tailored by varying the weight ratio of the OPZ monomers to BaTiO3, which in turn affected the relative permittivity and the frequency dependence of the OPZ/BaTiO3 particles. A subsequent carbonisation treatment of the OPZ@BaTiO3 at 700 °C transformed the polymeric OPZ shell to a microporous carbonaceous shell, which dramatically increased the electrical conductivity of the particles. Organophosphazene chemistry offers a facile route to functionalise BaTiO3 nanoparticles without any pre-treatment, and generate a range of core–shell BaTiO3 nanoparticles with tailored dielectric and electrically conductive properties that can be used as active fillers for polymer based nanocomposites and energy storage applications. The effectiveness and advantages of OPZ chemistry over other reported methods in forming core–shell particles are demonstrated.
1 Introduction
Ferroelectric poly(vinylidenefluoride) (PVDF) and its copolymers, such as poly(vinylidenefluoride-co-trifluoroethylene) (PVDF-co-TrFE), are attractive materials for applications in dielectric devices due to their high dielectric strength (Eb ∼ 4 MV cm−1) and convenient processability. However, their energy storage is limited by their low relative dielectric constant (εr ∼ 10).1,2 In order to further enhance the relative permittivity and energy density of PVDF-based composites, ferroelectric ceramics, such as BaTiO3, with a significantly higher relative permittivity (εr ∼ 1700) has been utilised as a dielectric additive.3,4 The incorporation of BaTiO3 nanoparticles into a polymer matrix, usually involves a surface modification process in order to prevent agglomeration and phase separation, and to increase their interfacial interaction with the polymers. A variety of surface-treatment approaches have been investigated which include: introduction of surface hydroxyls by chemical etching of BaTiO3 particles with H2O2,5 chemical modification with pentafluorobenzyl phosphonic acid6 or fluorosilane,7 and polymeric coatings such as polydopamine8 and polyaniline.9 Furthermore, polymer brushes grafted on BaTiO3 nanoparticles, have been synthesized by controlled free radical surface-initiated polymerization techniques such as the reversible addition–fragmentation chain transfer (RAFT),10,11 and the atom transfer radical polymerization (ATRP).12 Despite the promising results, the methods employed above involve extensive pre-treatment of the surface of BaTiO3 particle prior to further functionalisation. The existing processing routes therefore require multi-step reaction and purification procedures which leads to low production yield and high cost.In addition to dielectric and ferroelectric ceramics, electrically conductive carbons can be used to enhance the relative permittivity of PVDF/BaTiO3 composites while maintaining a low dielectric loss.13,14 Furthermore, the presence of BaTiO3 in these composite systems can also facilitate the dispersion of carbons in the polymer matrix, resulting in a higher interfacial interaction with the PVDF matrix.15 In such systems, the increased relative permittivity by the addition of conductive fillers, is attributed to the interfacial polarization resulting from the Maxwell–Wagner–Sillars (MWS) effect.16 Recently, the decoration of BaTiO3 with conductive graphitic carbon via a chemical vapour deposition (CVD) process, showed its beneficial role in the energy storage of PVDF-HFP composites.17
Here we have explored a facile core–shell approach to functionalise BaTiO3 nanoparticles through organophosphazene (OPZ) chemistry. A highly cross-linked OPZ shell is formed on the BaTiO3 surface via a one-step reaction at room temperature and ambient conditions. The formation mechanism of OPZ is based on the SN2 nucleophilic substation of hexachlorocyclotriphosphazene (HCCP) by a multifunctional aromatic compound to generate numerous primary oligomers, and simultaneous aggregation to form a stable and highly cross-linked structure.18–20 The reaction takes place in the presence of an aprotic polar solvent (acetonitrile, tetrahydrofuran, etc.) and an excess amount of triethylamine (TEA) which traps the Cl− released from the substitution on the P atoms of the HCCP. The nature of the above reaction provides an efficient route for producing core–shell nanostructures by applying the same chemistry in the presence of a template.21 Furthermore, the OPZ shell can be transformed to an electrically conductive carbon shell by carbonisation under inert atmosphere at high temperatures. The produced carbon structure is highly microporous with small graphitic crystals in a “house of cards” arrangement and with a relatively high degree of heteroatom-doping provided from the monomers.22,23 The core–shell nanoparticles can readily serve as a dielectric or conductive additives for polymer-based nanocomposites and energy storage applications. In this context, core–shell OPZ/BaTiO3 nanoparticles with tailored shell structure are studied. The structure and properties of the dielectric OPZ@BaTiO3 and the electrically conducting carbon coated BaTiO3 (C@BaTiO3) are discussed.
2 Experimental
2.1 Materials
Hexachlorocyclotriphosphazene (HCCP, Sigma-Aldrich, UK), 4,4′-sulphonyldiphenol (BPS, Sigma-Aldrich, UK), triethylamine (TEA, Fisher Sci, UK), CH3CN were used as received. BaTiO3 (Sigma-Aldrich UK, cubic, <50 nm) particles were dispersed in acetonitrile (CH3CN) and sonicated for at least three hours before experiments. Acetone and distilled water were used for the purification of the products.2.2 Synthesis of core–shell OPZ@BaTiO3 and C@BaTiO3
Organophosphazene coated BaTiO3 nanoparticles were successfully prepared by the polycondensation reaction of HCCP and BPS in the presence of BaTiO3 nanoparticles. In a typical synthesis (OPZ@BaTiO3-1), 0.5 g of BaTiO3 were dispersed in 333 ml of CH3CN by sonication for at least 3 hours. HCCP (203 mg) and BPS (463 mg) were added to the above mixture and left under sonication for 10 min before the flask was transferred on a magnetic stirrer. Under mild stirring, 5 ml of TEA was added and the reaction mixture left for 20 hours. The solids were collected by centrifugation, washed 1× acetone and 2× acetone/water mixture and then dried in a vacuum oven at 50 °C. Carbon coated BaTiO3 nanoparticles were obtained by carbonization of the as prepared OPZ@BaTiO3 nanoparticles in a tube furnace at 700 °C under N2 flow. The heating rate was 2.5 °C min−1 and an isothermal step at 700 °C was maintained for 2 hours before the furnace physically let to cool down at room temperature.2.3 Synthesis of dense OPZ nanospheres
Dense poly(cyclotriphosphazene-co-sulphonyl diphenol) nanospheres where synthesized in similar manner as the OPZ@BaTiO3 core–shell particles. In a 250 ml round bottom flask containing 150 ml of acetonitrile, HCCP (170 mg) and BPS (387 mg) were dissolved by sonication. The flask was transferred on a magnetic stirrer and TEA was added under a mild stirring speed (400 rpm, 3 cm stirring bar). The particle formation was observed in less than 10 seconds after the addition of the base and the mixture was left under continuous stirring for 3 hours. The OPZ nanospheres were collected by centrifugation at 8000 rpm, washed once with acetone and twice with acetone/water mixture and then dried in vacuum oven at 50 °C. This sample was used for the TGA comparison with the OPZ@BaTiO3.2.4 Characterization
Field emission gun-scanning electron microscopy (FEG-SEM) and X-ray electron dispersive spectroscopy analysis (EDS) were performed on a Zeiss SIGMA SEM. AuPd sputtering was applied to the samples before observation. The carbonized samples did not require any preparation due to their high electrical conductivity. Transmission electron microscopy (TEM) micrographs were obtained on JEOL 2000FX operated at 200 kV. Raman spectra were recorded on Renishaw inVia spectrometer equipped with 514 nm and 633 laser-lines. Thermogravimetric analysis curves were obtained with a Mettler Toledo instrument in the temperature range 25–700 °C at a heating rate of 10 °C min−1 under N2 gas flow (100 ml min−1). The weight percentage of the carbon shell was calculated from TGA measurements under air flow. Nitrogen adsorption–desorption isotherms were obtained on a Quadrasorb Evo Analyser (Quantachrome). The specific surface area of the OPZ@BaTiO3 samples was calculated by the Brunauer–Emmett–Teller (BET) equation applied on the linear part of the adsorption branch (0.05–0.30 P/P0) and the pore size distribution was obtained by the Barrett–Joyner–Halenda (BJH) method applied on the desorption branch data. For the C@BaTiO3 samples the specific surface area was calculated by the t-plot method and the pore size distribution by Nonlocal Density-Functional Theory (NLDFT) and applying the ‘slit-like pores’ model of carbon. The samples were degassed at 100 °C for 19 hours under high vacuum before measurements. The X-ray diffraction (XRD) patterns were recorded on a Panalytical Empyrean diffractometer with a CoKα radiation source (1.7902 Å) operated at 45 kV and 40 mA. The scanning step width was 0.013° 2θ. X-ray Photoelectron Spectroscopy measurements (XPS) were contacted on a Kratos Axis Ultra DLD spectrometer using monochromatic Al Kα source (hν = 1486.6 eV). Survey spectra (1200–0 eV) were collected with a pass energy of 160 eV, while the high-resolution spectra were obtained using a 20 eV pass energy with a resolution approximately 0.4 eV. Peak fitting was performed on CasaXPS software, using mixed Gaussian–Lorentzian (Voigt) line shapes and Shirley backgrounds. For electrical measurements, pressed and electroded pellets of the powders were characterised; samples were 5 mm in diameter and typically 1–2 mm thick. Samples were dried for 24 h prior to electrical measurement to remove any adsorbed moisture. Electrical characterisation was undertaken by measurement of the real and imaginary impedance using a Solatron 1260 impedance analyzer with a Solatron 1296 dielectric interface at 0.1 Vrms at frequencies from 1 Hz to 1 MHz. The ac conductivity, σ, was calculated using,
 | (1) |
 | (2) |
![[thin space (1/6-em)]](https://www.rsc.org/images/entities/char_2009.gif) δ) was determined from,
δ) was determined from,| θ = tan−1(Z′′/Z′) | (3) |
|
tanδ = −Z′/Z′′
| (4) |
3 Results and discussion
3.1 Morphology and microstructure characterization
Poly(organophosphazene)-coated dielectric nanoparticles (OPZ@BaTiO3) were synthesised via a nucleophilic substitution reaction between HCCP and BPS in the presence of BaTiO3 nanoparticles. Before the synthesis, the as-purchased commercial BaTiO3 powders consisted of micron-sized (∼20 μm) spherical agglomerates were broken down and dispersed under extensive sonication in CH3CN. The high polarity index of solvent was beneficial for: (i) assisting the dispersion and stabilization of the BaTiO3 nanoparticles in the solution, and (ii) promoting the nucleophilicity and therefore the reactivity of the BPS towards the P atoms of the HCCP. The previously described reaction mechanism for the formation of OPZ materials, can be also extended to the synthesis of core–shell particles; in the presence of BaTiO3 nanoparticles (or any other sub-micron particles), the primary HCCP–BPS oligomers formed the initial nuclei, which subsequently adsorbed on the surface of the BaTiO3 driven by the tendency to minimize their high free energy. Thus, there is no requirement for functional groups on the surface of the template nanoparticles, which is one the advantages of the current chemical method. After this stage, more HCCP and BPS monomers and/or HCCP–BPS oligomers, were diffused onto the coated BaTiO3 surface where the substitution reaction further took place and led to the growth of a cross-linked OPZ shell (Fig. 1).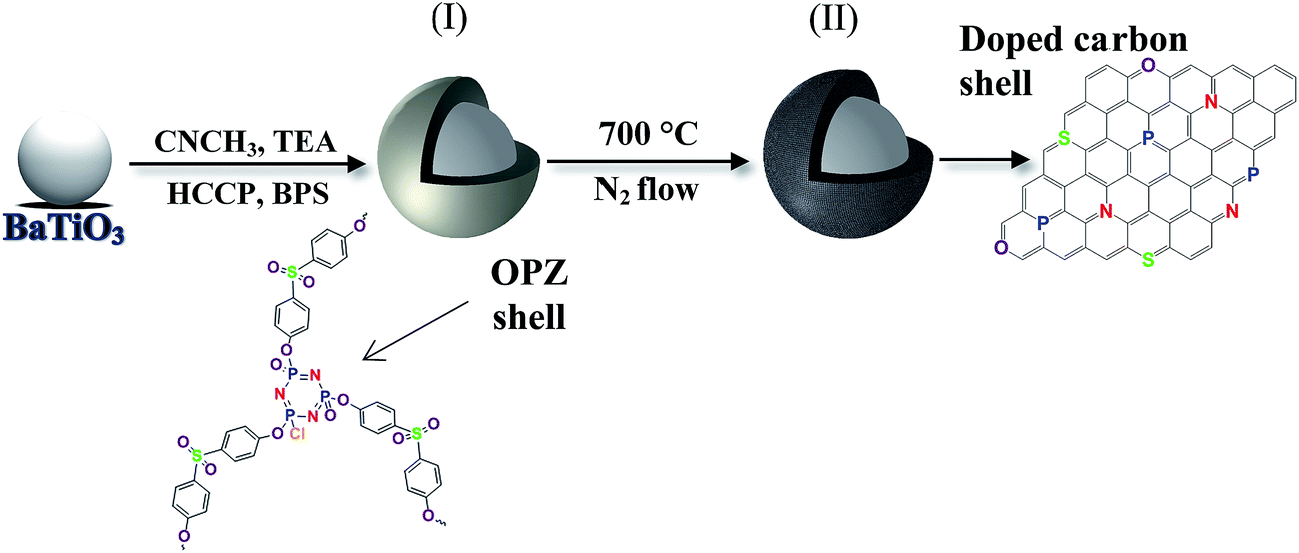 | ||
| Fig. 1 Schematic illustration of the synthetic route for the production of (I) OPZ-coated BaTiO3 and (II) carbon-coated BaTiO3 particles after a carbonization process. | ||
OPZ@BaTiO3 nanoparticles with different shell-thicknesses were prepared by varying the weight ratio of the monomers to BaTiO3 from 0.25:1 to 4:1, while maintaining a constant molar ratio of the monomers of BPS to HCCP at 3:1 (Table S1†). Fig. 2 shows the SEM images of the bare BaTiO3 nanoparticles and the core–shell OPZ@BaTiO3 particles prepared at different [HCCP–BPS]/[BaTiO3] weight ratios. The shell thickness increased with an increase of the monomer concentration, and the shape of the particles became more regular as they grow to the sub-micron scale (Fig. 2e). The EDX spectrum revealed the elements existed in the core–shell structure (Fig. 2f) and the chemical composition of all the samples is summarized in Table S2.† The ability to modify the BaTiO3 surface was confirmed for all the samples and no free BaTiO3 particles or dense OPZ spheres were observed; this result demonstrates that the presented OPZ chemistry can be applied to a wide range of [monomers]/[template] ratios and template concentrations without the need of extensive synthesis optimization. The absence of BaTiO3-free OPZs particles indicated that the nucleation and growth steps followed the “LaMer mechanism” where the initial fast nucleation lowered the monomers' concentration below a critical point and no further formation of new primary nuclei took place.24 In addition, the HCCP concentration was relatively low in order to prevent any secondary OPZ-particle formation.
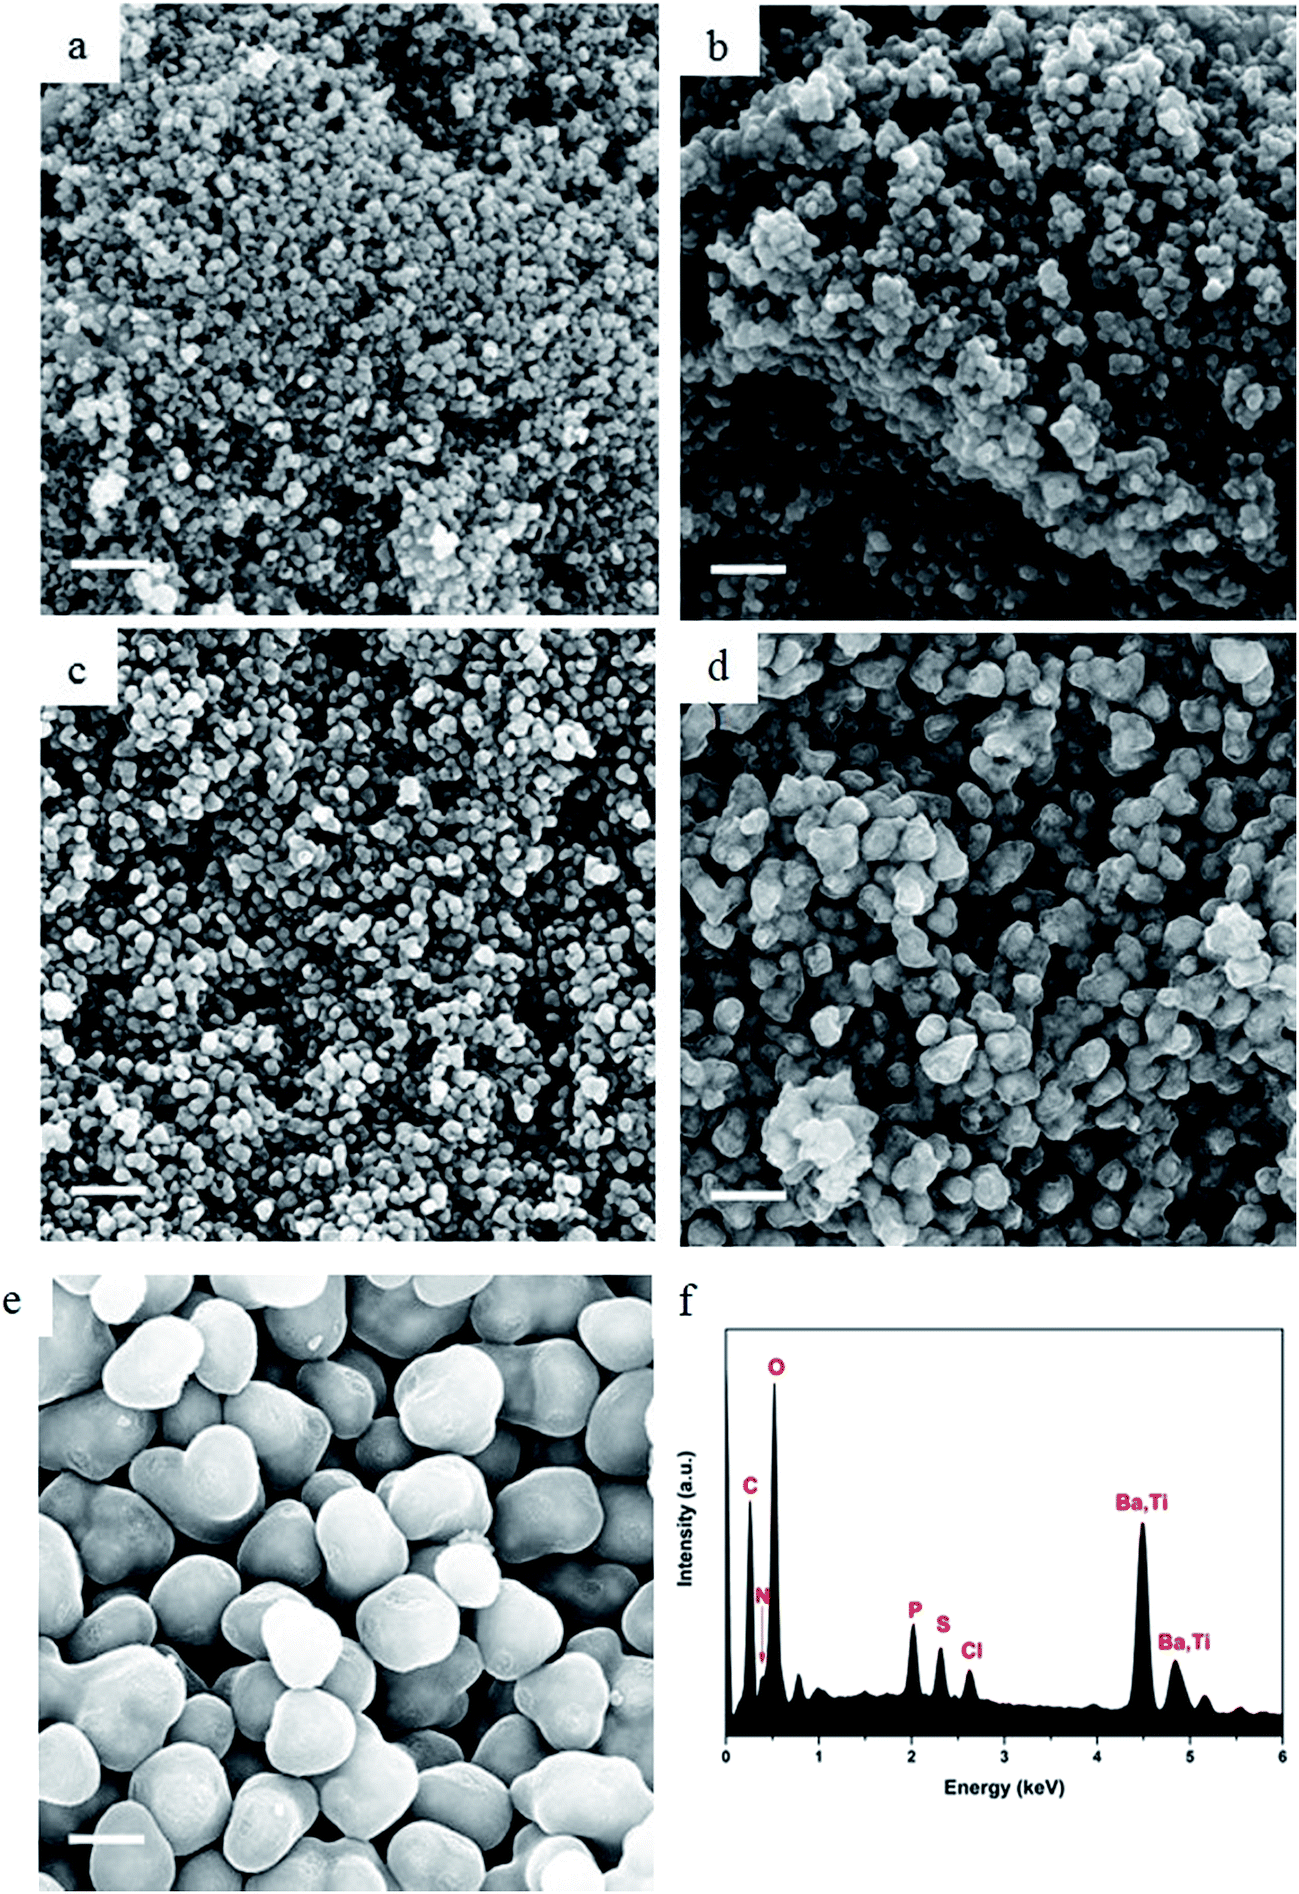 | ||
| Fig. 2 SEM images of (a) the commercial BaTiO3 particles after sonication, (b) OPZ@BaTiO3-0.25, (c) OPZ@BaTiO3-0.5, (d) OPZ@BaTiO3-1, (e) OPZ@BaTiO3-4. Scale bar at 500 nm. (f) Representative spectra from EDX elemental analysis. | ||
By taking advantage of the capability of the In-lens detector to collect secondary electrons (SE) over a wide range of energies, even at relatively low primary beam energy (10 kV), the core–shell structure can be identified from the materials density difference (“Z contrast”).25 The core (BaTiO3) nanoparticles are almost visible under scanning electron microscopy (SEM) observation and this is more readily observed in the case of carbonized samples in Fig. 3 where the carbon shell has a more “transparent” appearance than the OPZ shell, giving the appearance of “TEM-like” images. This phenomenon is attributed to the conductivity of the carbon shell as well as to a lower density, compared to the OPZ shell, which allows the excited photoelectrons to escape from the structure more easily.
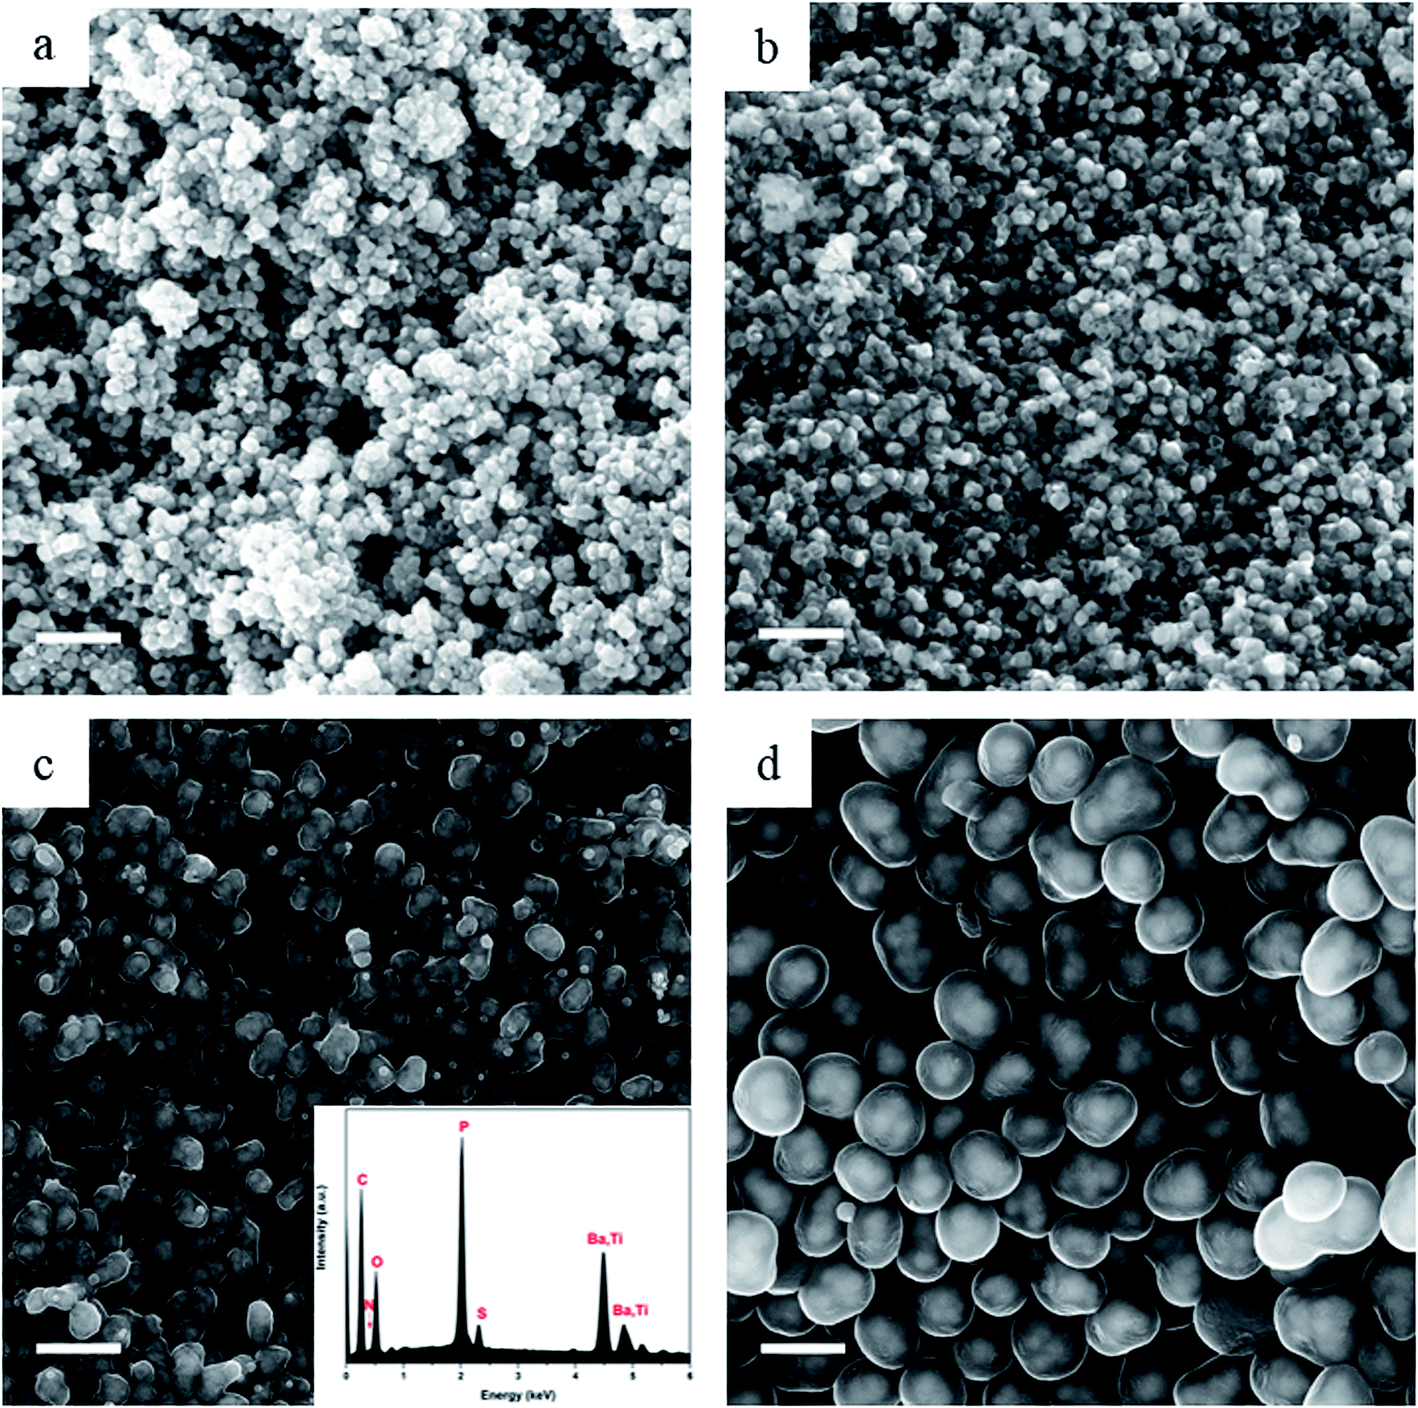 | ||
| Fig. 3 SEM images after carbonization at 700 °C of (a) C@BaTiO3-0.25, (b) C@BaTiO3-0.5, (c) C@BaTiO3-1, and (d) C@BaTiO3-4. Scale bar at 500 nm. | ||
Fig. 3 shows the morphology of the carbonized samples C@BaTiO3, with shells of different thickness. The cross-linked OPZ shell was directly converted to a carbon shell doped with phosphorus, nitrogen, sulfur and oxygen as shown in the characteristic EDX spectrum (Fig. 3c, inset). After the carbonization process the overall size of the C@BaTiO3 particles decreased, since the conversion of the OPZ shell to carbon under N2 is followed by a significant mass loss, as shown from the TGA curves (Fig. 4). The onset decomposition temperature (Ton) for all the OPZ@BaTiO3 samples is located approximately at 465 °C. It is important to note that the thermogravimetric curves have a negative slope at 700 °C, therefore the mass loss during carbonization in the furnace (2 h at 700 °C) should be slightly higher than calculated from the TGA curves. The mass loss percentage of the shell content of the OPZ@BaTiO3 and C@BaTiO3 core–shell structures was calculated from the TGAair curves shown in Fig. S1(a and b)† and all the results are summarized in Table 1. The TGAair of the OPZ@BaTiO3 showed an initial steep mass loss at 475 °C due to the decomposition of the organic part (BPS) of the nanospheres and the process continued at a slower rate above 500 °C. In order to understand the thermal degradation behaviour, dense OPZs nanospheres were also evaluated under the same conditions; see OPZs in Fig. S1a.† Above 500 °C, a similar behaviour to the OPZ@BaTiO3 samples was observed, which attributed to the slower decomposition of the inorganic part of the nanospheres with some oxidation (mainly the P) taking place simultaneously and resulting in a residual mass of 16 wt%. The TGA under air of the bare BaTiO3 particles did not show any oxidation stage, as would be expected since BaTiO3 is already in an oxidized state. However, the OPZ@BaTiO3-0.25 and OPZ@BaTiO3-0.5 show a slight mass increase at high temperatures which was attributed to the oxidation of the P atoms. In contrast, the P oxidation was not evident for the samples with thicker OPZ shells due to the ongoing organic content decomposition at 800 °C, which resulted to negative slopes. According to the above findings, and taking in to account that there is some inorganic residue from the hybrid OPZ shell after TGA under air, the mass percentage of the BaTiO3 in OPZ@BaTiO3 can be calculated from eqn (5) where the OPZ residue is 16 wt% and OPZ weight loss is 84 wt%.
 | (5) |
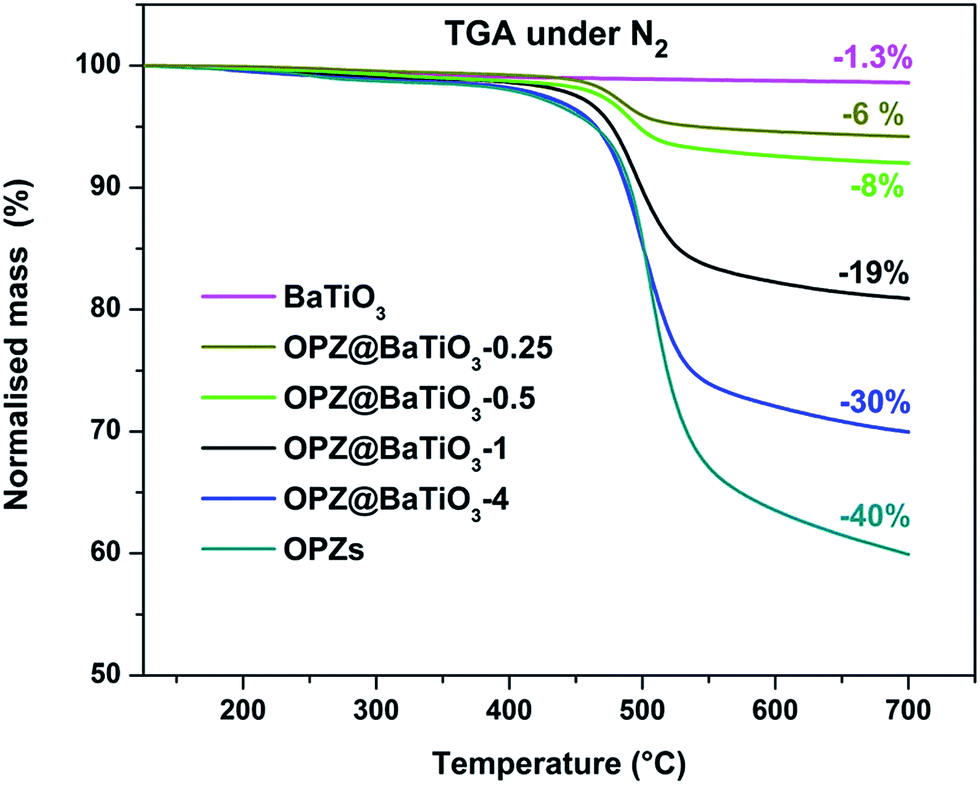 | ||
| Fig. 4 TGA curves under N2 the OPZ@BaTiO3 and the bare BaTiO3 nanoparticles. | ||
| Atmosphere | Nitrogen | Air | BaTiO3 wt% |
|---|---|---|---|
| Sample name [shell@core] | Mass loss (%) | Mass loss (%) | |
| BaTiO3 | 1.3 | 1.6 | 100 |
| OPZ@BaTiO3-0.25 | 6 | 10 | 88 |
| OPZ@BaTiO3-0.5 | 8 | 13 | 84.5 |
| OPZ@BaTiO3-1 | 19 | 33 | 61 |
| OPZ@BaTiO3-4 | 30 | 56 | 33 |
| OPZ nanospheres | 40 | 84 | 0 |
| C@BaTiO3-0.25 | — | 3.5 | 96.5 |
| C@BaTiO3-0.5 | — | 7 | 93 |
| C@BaTiO3-1 | — | 21 | 79 |
| C@BaTiO3-4 | — | 38 | 62 |
More detailed information for the morphology and structure of the core–shell particles was provided by the TEM micrographs (Fig. 5). The OPZ@BaTiO3 samples consisted of multiple BaTiO3 nanoparticles cores covered with the cross-linked OPZ shell of thickness proportional to the monomers' concentration. Thus, the thinnest OPZ shell (∼4 nm) was observed for the OPZ@BaTiO3-0.25 (Fig. 5b), while the OPZ@BaTiO3-4 had a shell thickness of 40–70 nm (Fig. 5d). The shell thickness distribution was observed for all the samples which was attributed to the shape irregularity of the BaTiO3 particles and the multiple-nanoparticle core structure as well. The TEM-EDX mapping showed a uniform distribution of all the elements originating from the cross-linked HCCP–BPS network around the BaTiO3 particles (Fig. S2†). A representative morphology of the core–shell structure after carbonization is shown in Fig. S3a.† As expected, no graphitic carbon was observed since the OPZ shell, due to its high cross-linking degree, could not undergo graphitization and resulted to a “hard carbon” structure, instead. Additionally, the diffusive diffraction rings shown in the selected area of diffraction (SAED) (Fig. S3b†), confirmed the amorphous nature or low crystallinity of the carbon shell, while the “spotty” diffraction peaks indicated a polycrystalline BaTiO3 core.
 | ||
| Fig. 5 TEM micrographs of OPZ@BaTiO3 with (a and b) 0.25:1, (c) 1.33:1 and (d) 4:1 feed ratio. | ||
A representative Raman spectra of the OPZ@BaTiO3 is shown in Fig. S4a.† The characteristic peaks at 729, 1154, 1588 and 3070 cm−1 were assigned to the C–S, symmetric O![[double bond, length as m-dash]](https://www.rsc.org/images/entities/char_e001.gif) SO, aromatic C–C and aromatic C–H stretch vibrations, respectively. Additionally, peaks from the BaTiO3 core particles were observed at lower Raman shifts (514, 304, 248 and 185 cm−1) of the spectrum. For all the samples the intensities of the OPZ and BaTiO3 peaks were proportional and inversely proportional, respectively, to the shell thickness. The C@BaTiO3 samples (Fig. S4b†) showed the presence of the characteristic broad peaks at 1588 cm−1 (G band), 1344 cm−1 (D band), and their second order vibrations at the higher frequency range of the spectra, of hard carbons derived from high temperature pyrolysis. The broadening of the peaks suggested that they consisted of a combination of other peaks and a deconvolution process was required in order to reveal the true carbon structure. The first-order Raman peaks consists of a combination of mixed Gaussian and Lorentzian distributions while the second-order peaks were fitted with Lorentzian-shaped bands. The extent of graphitization was calculated from the ID1/IG ratio, resulting in a value of 1.08 which is representative of carbonaceous materials with a low degree of graphitization (hard carbons) and small graphene sheets with a “house of cards” arrangement.26,27
SO, aromatic C–C and aromatic C–H stretch vibrations, respectively. Additionally, peaks from the BaTiO3 core particles were observed at lower Raman shifts (514, 304, 248 and 185 cm−1) of the spectrum. For all the samples the intensities of the OPZ and BaTiO3 peaks were proportional and inversely proportional, respectively, to the shell thickness. The C@BaTiO3 samples (Fig. S4b†) showed the presence of the characteristic broad peaks at 1588 cm−1 (G band), 1344 cm−1 (D band), and their second order vibrations at the higher frequency range of the spectra, of hard carbons derived from high temperature pyrolysis. The broadening of the peaks suggested that they consisted of a combination of other peaks and a deconvolution process was required in order to reveal the true carbon structure. The first-order Raman peaks consists of a combination of mixed Gaussian and Lorentzian distributions while the second-order peaks were fitted with Lorentzian-shaped bands. The extent of graphitization was calculated from the ID1/IG ratio, resulting in a value of 1.08 which is representative of carbonaceous materials with a low degree of graphitization (hard carbons) and small graphene sheets with a “house of cards” arrangement.26,27
The XRD patterns of the OPZ@BaTiO3 showed sharp peaks assigned to the cubic crystal structure (paraelectric) of BaTiO3 while the C@BaTiO3 showed additionally a broad and intensity below 2θ = 25° which was attributed to the hard carbon shell (Fig. S5†). Although, the higher dielectric constant of BaTiO3 is originated from the tetragonal crystalline phase usually formed at sintering temperatures >800 °C,28 here, the OPZ@BaTiO3 were heat treated as fine powders (not pressed pellets) in order to prevent breakage of the hybrid shell and aggregation at high temperatures.29 It is worth noting that, despite the findings from the XRD analysis, the Raman spectra showed a peak at 304 cm−1 which is characteristic of the tetragonal phase of BaTiO3, indicated the mixed crystal structure of the as-received commercial material.30,31 The second characteristic peak at ∼715 cm−1 of the tetragonal structure, appeared as a shoulder due to the overlapping with the C–S vibration at 729 cm−1 (Fig. S4c†).
N2 adsorption–desorption isotherms were used to determine the textural properties of the materials and the representative isotherms from each group of samples are shown in Fig. S6a,† since all the related samples had similar sorption behaviour. The OPZ@BaTiO3 exhibited a Type-III isotherm, typical of non-porous powder materials with a characteristic steep adsorption close to the saturation pressure (>0.9 P/P0) due to the capillary condensation that takes place in the inter-particle space. The BET specific surface, calculated at the range 0.05–0.30 P/P0, decreased from 34 to 7 m2 g−1 area as the shell thickness increased and was attributed to the transformation of the thin-shelled irregular particles to more regular thick-shelled particles at a higher monomer feeding ratio. As the OPZ shell transformed to high disordered and heteroatom-doped carbon, a “knee” appeared at the low P/P0 region and the N2 adsorbed amount was significantly increased. The isotherm could be assigned as a mixed Type-I isotherm (micropores) and Type-IV (mesopores) due to the presence of micropores in the carbon shell, the pore filling took place before or at the same P/P0 range where the multilayer adsorption is usually taking place and a calculation with the BET method, in the traditional range of 0.05–0.35 P/P0, resulted in negative C constant. For this reason, an updated BET method was used where the P/P0 points are selected in the range of continuously increasing V(1 − P/P0) values.32 The contribution of the micropores in the total specific surface area was determined by the t-plot method (Carbon Black model) applied in the range 0.01–0.05 P/P0. The textural properties of all the samples are summarized in Table S3.† The pore size distribution of the C@BaTiO3 samples was obtained from the non-local density functional theory (NLDFT) approach and selecting a model for carbons with a slit pore geometry. As shown in Fig. S5b,† there are two major peaks at 1.3 and 2.1 nm (micropores) and a small number of suprapores at 3.3–4.3 nm and mesopores at 4.4–6.4 nm. The microporous structure of the carbon shell was attributed to: (i) degradation and transformation of the organic part of OPZ shell to carbon, (ii) the presence of heteroatoms that escape the shell during carbonization and leave gaps behind, (iii) the size and concentration variety of heteroatoms which introduced more defected structure, and (iv) the “hard-carbon” nature of the formed material. The porous structures were difficult to observe or identify with TEM analysis, due to the high mixed and disorder structure consisted of with amorphous carbon and small graphitic crystals of random orientations.
XPS analysis was performed in order to examine in more detail the composition of the nanostructures. The survey wide scans of the OPZ@BaTiO3-4 and C@BaTiO3-4 in Fig. 6, which are representative for all the samples, show the presence of the all the elements that are expected to be observed in the OPZ shell and the carbon shell after the pyrolysis process. The atomic weight percentages were calculated from the core-level scanning of each element and the results are presented in Table S4.† The P/S ratio (∼1) indicated that the monomeric unit of the cross-linked OPZ structure consisted of one phosphonitrilic trimer connected with three BPS molecules which is in agreement with the initial molar ratio of the monomers (3:1). It is known from previous reports that nucleophiles with a relative large and non-planar structure take part only in non-geminal substitution of the P–Cl, thus each P atom is bonded with only one BPS molecule.33 The remaining P–Cl could be substituted by any H2O molecules that are present in the commercial chemicals (monomers, solvents) and in the atmosphere, forming PO or P–OH bonds. A small amount of Cl (<1 at%) mainly originated from unreacted P–Cl and some Cl with ionic character (TEA·HCl) that may be trapped in the structure and its presence, even in a small percentage here, contributed in the formation of the microporous carbon structure during pyrolysis.34 The resolved spectra of the high-resolution scans also showed a multi-binding state for all the elements before and after carbonization (Fig. S5†). In particular, the O 1s peak of the OPZ@BaTiO3 was resolved in three different peaks with the most significant, at 531.4 eV, assigned to the surface aromatic C–OH which is important property for a good dispersion in organic solvents and high interaction of these materials in dielectric polymer matrices (PVDF). The absence of Ba 3d and Ti 2p peaks in the OPZ@BaTiO3-4 sample is attributed to the thick OPZ shell which is much larger than the penetration depth of the incident beam (∼10 nm).
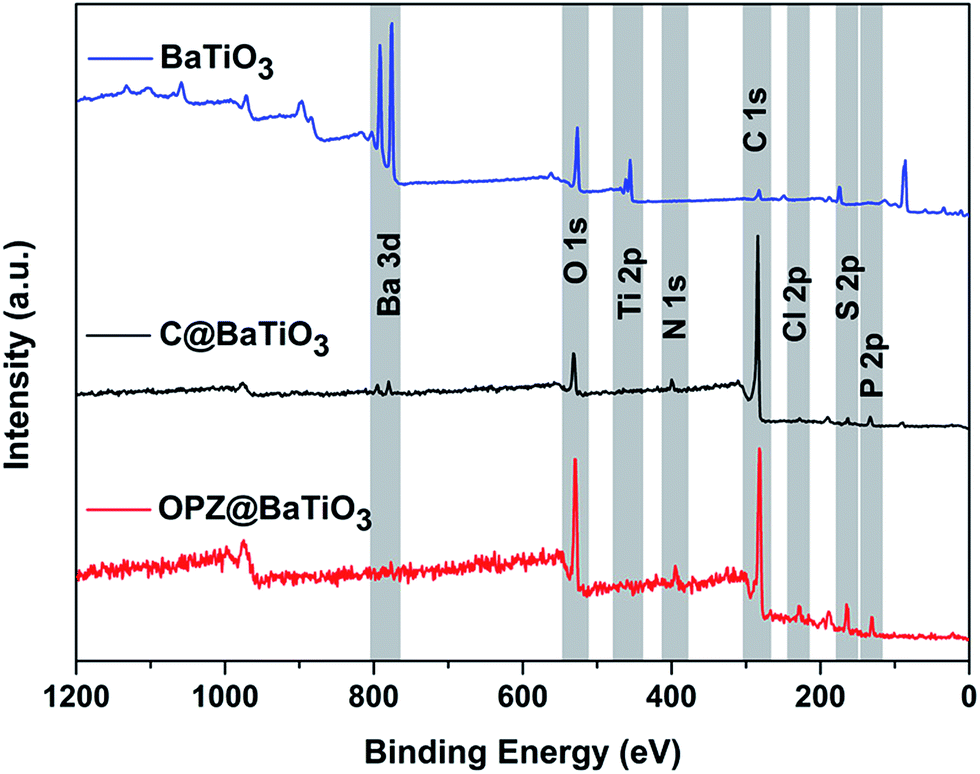 | ||
| Fig. 6 XPS survey scans of the as received BaTiO3 and the core–shell particles before and after carbonization. | ||
After the pyrolysis process the converted carbon structure doped with O, P, N and S, showed a significant change of the elements binding states and it is well known that the presence of heteroatoms in carbons significantly alter their electronic as well as their textural properties.35,36 The analysis of the N 1s peak showed the presence of three different components at 398.2, 400.2 and 402.6 eV assigned to pyridinic, pyrrolic/quaternary and oxidized nitrogen which contribute to the electronic properties of the carbon. P and S showed a decrease in the number of the different components which is explained by their presence mainly as oxides in the structure that contributes to the formation of the extended microporous structure of the carbon shell23 (Fig. S6c–e†). Among the heteroatoms, S had the lowest at% while the highest was for O due to some oxidation that took place during carbonization in the furnace. In contrast to OPZ@BaTiO3, the survey spectrum of the carbonized samples clearly showed the peaks from the BaTiO3 core particles. Specifically, the spin–orbital splitting of the Ba 3d peak was observed in the C@BaTiO3-4 despite the fact that its shell was thicker than the non-carbonized OPZ@BaTiO3-1 (thin shell). This observation was related with two factors: (i) the difference in electronic conductivity between the OPZ (insulator) and C (conductor) shell so that the exited photoelectrons can “travel” easier through the C shell. (ii) The lower density of the C shell allows for deeper penetration of the incident X-ray beam and decreased inelastic energy loss of the extracted photoelectrons.
3.2 Dielectric properties of the core–shell particles
Fig. 7 shows the frequency dependent ac conductivity, permittivity, phase angle and dielectric loss for the core–shell powders along with impedance measurements on dense OPZ nanospheres. The OPZ@BaTiO3 samples exhibited low ac conductivity and the linear relationship with frequency in Fig. 7a was a result of the frequency dependences of the admittances of the capacitive regions (iωC) that contributed to the conduction paths in these highly insulating materials. This can also be observed in Fig. 7b, whereby in these purely capacitive materials the ac current lagged the ac voltage by 90°; this is a further indication of the dielectric and capacitive nature of the OPZ@BaTiO3 samples. The dense OPZ nanospheres and the OPZ@BaTiO3-4 core–shell particles with the thicker OPZ shells exhibited the lowest ac conductivities (Fig. 7a) and the highest phase angle (Fig. 7b) due to the insulating nature of the OPZ shell.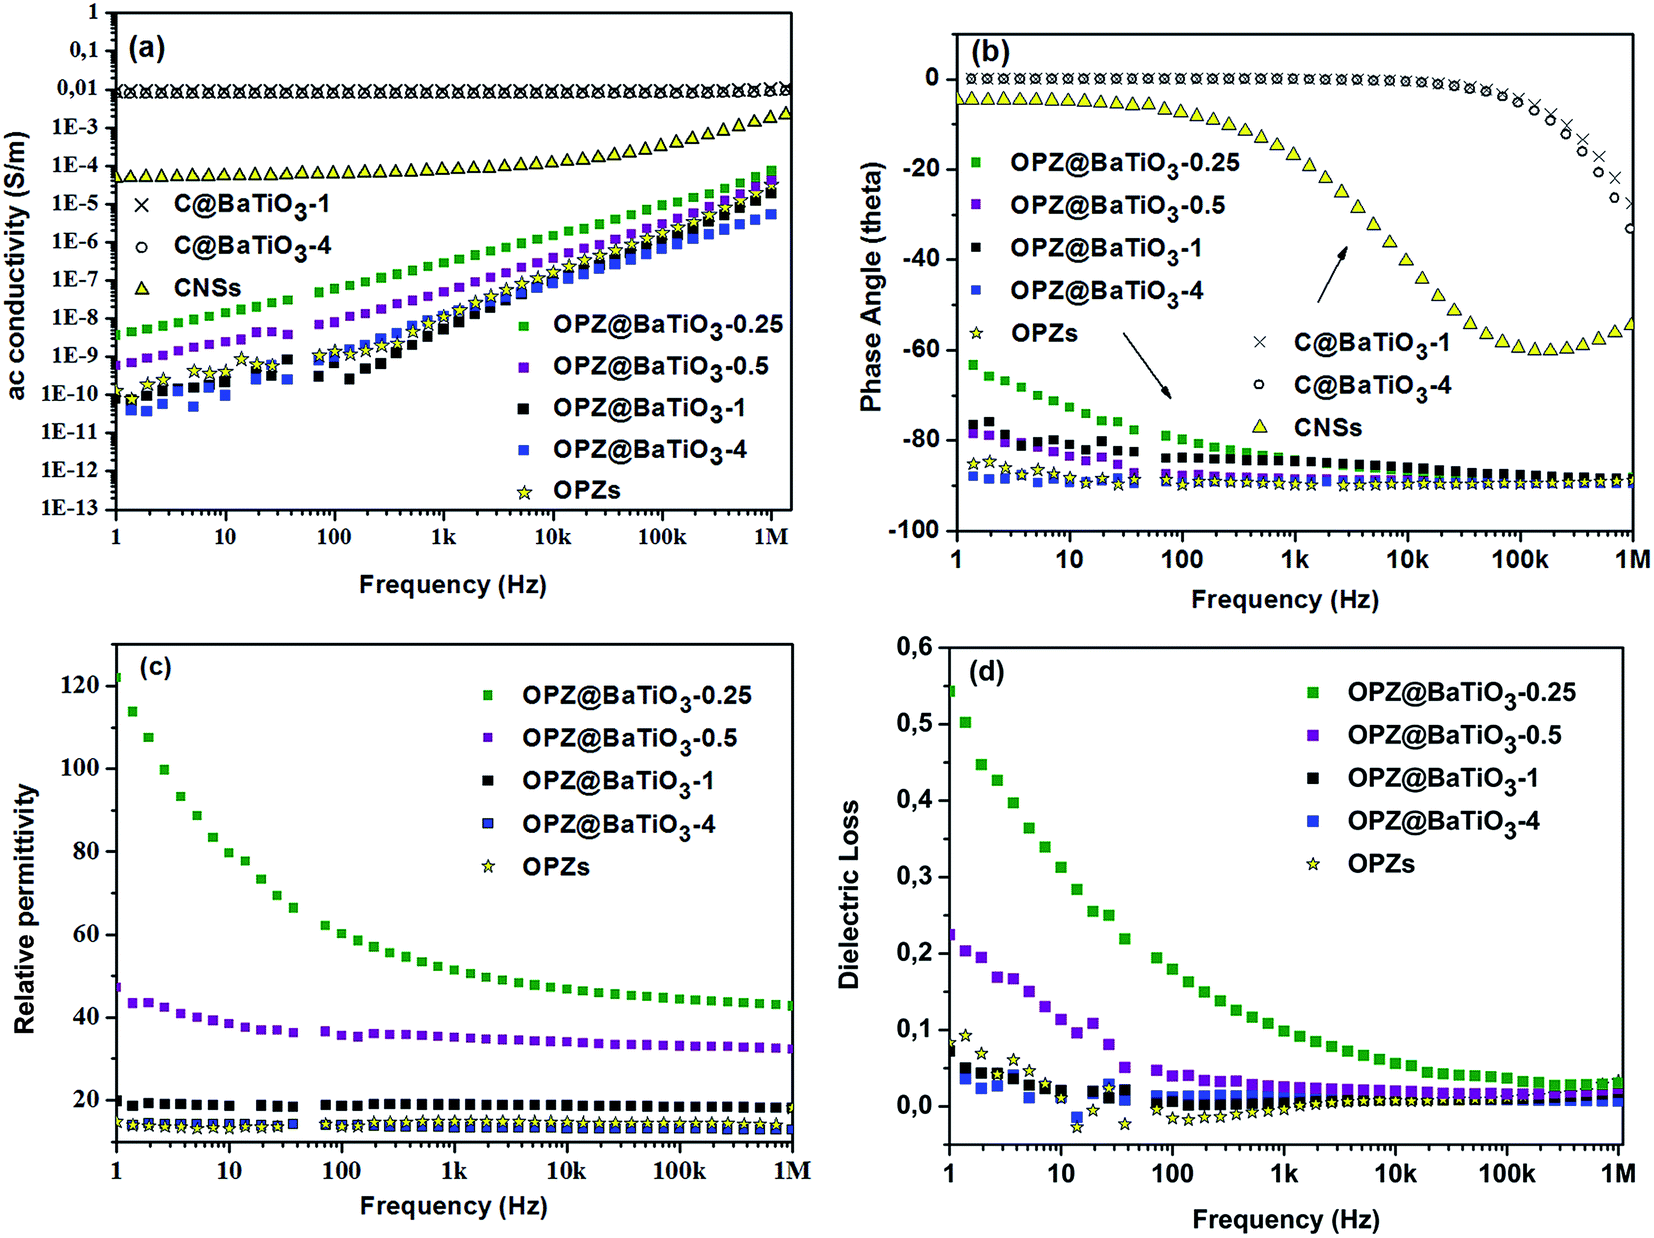 | ||
| Fig. 7 (a) AC conductivity of the OPZ@BaTiO3 and C@BTO samples and comparison with the dense OPZ, (b) phase angle of OPZ@BaTiO3 and C@BTO samples. Phase angle approaching 0 deg indicates conductive behavior, approaching 90 deg indicates capacitative behavior, (c) relative permittivity of the OPZ@BaTiO3 samples and comparison with the dense OPZ nanospheres. (d) Dielectric loss of the OPZ@BaTiO3 samples and comparison with the dense OPZ nanospheres. | ||
In contrast, the C@BaTiO3 samples had much higher conductivity at low frequencies (DC conductivity) and the conductivity in these core–shell particles was frequency independent (Fig. 7a). Such a response is indicative of conductive behaviour since the admittance of a resistor is simply 1/R and this can also be seen in Fig. 7b where the phase angle approaches 0° where current and voltage are now in phase.
Fig. 7c shows the frequency dependent relative permittivity of the OPZ@BaTiO3 materials. The relative permittivity increased as the OPZs shell becomes thinner and the contribution of BaTiO3 to the relative permittivity is more effective; this can also be seen in Table 2. The observed frequency dependence of the permittivity in Fig. 7c, at low frequencies, was more pronounced in the samples with a thin OPZ layer and has been shown to be related to the presence of conductivity in the material.37 This can be seen in Fig. 7d where the samples with higher dielectric loss exhibited the stronger frequency dependence at low frequencies (Fig. 7c). At higher frequencies the admittance of the capacitive regions (iωC) increased and ac currents flowed through the capacitative (insulating) regions of the material and the influence of conductivity on permittivity and dielectric loss was therefore reduced; see Fig. 7c and d where the responses are almost frequency independent above 103 Hz. The C@BaTiO3 samples are not shown since they exhibit high ac conductivity and the permittivity is not relevant.
| Sample name [shell@core] | Relative permittivity ε′ | Dielectric loss | BaTiO3 wt% |
|---|---|---|---|
| OPZ@BaTiO3-0.25 | 51 | 0.098 | 88 |
| OPZ@BaTiO3-0.5 | 35 | 0.025 | 85 |
| OPZ@BaTiO3-1 | 19 | 0.005 | 61 |
| OPZ@BaTiO3-4 | 13 | 0.015 | 33 |
| OPZ nanospheres | 15 | 0.006 | 0 |
Since the bare OPZ nanospheres showed very low conductivity and frequency independent permittivity, the conductivity was likely to originate from the BaTiO3. Indeed, the high resolution XPS of the “as received” BaTiO3 showed the presence of BaCO3 as it can be seen from the deconvolution of the C 1s, Ba 3d5/2 and O 1s peaks (Fig. S7†). The presence of carbonate, which contributes to the conductivity, is common for the perovskite materials and it is originated from the synthetic procedures as well as from the reaction with the atmospheric CO2.38–40 Therefore, the nanoparticles with a thin shell showed higher dielectric losses compared to the thick OPZ shells which provide more insulating characteristics. A decreasing permittivity and dielectric loss with increasing frequency, has been observed for thin films of BaTiO3–polymer core–shell particles with even lower ac conductivities than reported here.41,42 In this work the measurements were conducted on pressed powders and the presence of low-permittivity air between the inter-particle spaces can lower the measured effective permittivity and give some inaccuracy. However, the dielectric losses for all the OPZ@BaTiO3 were surprisingly low. The above results in Fig. 7 suggest that the electrical properties of organophosphazene-decorated BaTiO3 particles, can therefore be readily tailored from highly insulating (capacitive) and low dielectric loss (OPZ@BaTiO3) to electrically conducting (C@BaTiO3), by varying the shell thickness and chemical structure. The above properties could make these materials good candidates as hybrid fillers (OPZ@BaTiO3) in ferroelectric polymer nanocomposites for the improvement of the high dielectric loss of the polymer matrix, as well as active fillers (C@BaTiO3) in dielectric percolative composites.
4 Conclusions
This paper presented a facile and novel method to functionalise BaTiO3 nanoparticles with an organophosphazene insulating shell at ambient conditions and within a short timescale. It was demonstrated that the OPZ shell thickness can be readily controlled by adjusting the feeding ratio of the monomers to BaTiO3. The electrically insulating core–shell OPZ@BaTiO3 nanoparticles could also be transformed into electrically conducting carbon coated BaTiO3 nanoparticles with well-preserved morphologies by a simple carbonization treatment. This work provides a facile and cost-effective method to generate novel core–shell nanoparticles with well-defined shell structures and properties that range from electrically insulating (OPZ) to highly conductive (carbon). The resultant products can be readily applied as active materials in electrochemical energy storage applications.Acknowledgements
G. S. P. acknowledges the PhD research funding sponsored by WMG at the University of Warwick and Dr Marc Walker (Physics) for helping with the XPS measurements and Dr Geoff West (WMG) for TEM-EDX. C. Wan acknowledges the funding from EPSRC-iCASE award 6560. C. B. acknowledges funding from the European Research Council under the European Union's Seventh Framework Programme (FP/2007–2013)/ERC Grant Agreement no. 320963 on Novel Energy Materials, Engineering Science and Integrated Systems (NEMESIS).References
- A. J. Lovinger, Science, 1983, 220, 1115–1121 CAS.
- Q. M. Zhang, Science, 1998, 280, 2101–2104 CrossRef CAS PubMed.
- S. Cho, J. S. Lee and J. Jang, Adv. Mater. Interfaces, 2015, 2, 1500098 CrossRef.
- K. Yang, X. Huang, M. Zhu, L. Xie, T. Tanaka and P. Jiang, ACS Appl. Mater. Interfaces, 2014, 6, 1812–1822 CAS.
- T. Zhou, J. W. Zha, R. Y. Cui, B. H. Fan, J. K. Yuan and Z. M. Dang, ACS Appl. Mater. Interfaces, 2011, 3, 2184–2188 CAS.
- P. Kim, N. M. Doss, J. P. Tillotson, P. J. Hotchkiss, M. J. Pan, S. R. Marder, J. Li, J. P. Calame and J. W. Perry, ACS Nano, 2009, 3, 2581–2592 CrossRef CAS PubMed.
- X. Zhang, Y. Ma, C. Zhao and W. Yang, Appl. Surf. Sci., 2014, 305, 531–538 CrossRef CAS.
- N. Jia, Q. Xing, X. Liu, J. Sun, G. Xia, W. Huang and R. Song, J. Colloid Interface Sci., 2015, 453, 169–176 CrossRef CAS PubMed.
- X. Zhang, S. Wei, N. Haldolaarachchige, H. A. Colorado, Z. Luo, D. P. Young and Z. Guo, J. Phys. Chem. C, 2012, 116, 15731–15740 CAS.
- K. Yang, X. Huang, Y. Huang, L. Xie and P. Jiang, Chem. Mater., 2013, 25, 2327–2338 CrossRef CAS.
- M. Zhu, X. Huang, K. Yang, X. Zhai, J. Zhang, J. He and P. Jiang, ACS Appl. Mater. Interfaces, 2014, 6, 19644–19654 CAS.
- L. Xie, X. Huang, Y. Huang, K. Yang and P. Jiang, J. Phys. Chem. C, 2013, 117, 22525–22537 CAS.
- A. C. Patsidis, K. Kalaitzidou, D. L. Anastassopoulos, A. A. Vradis and G. C. Psarras, J. Chin. Adv. Mater. Soc., 2014, 2, 207–221 CrossRef CAS.
- Z. M. Dang, L. Wang, Y. Yin, Q. Zhang and Q. Q. Lei, Adv. Mater., 2007, 19, 852–857 CrossRef CAS.
- Z.-M. Dang, S.-H. Yao, J.-K. Yuan and J. Bai, J. Phys. Chem. C, 2010, 114, 13204–13209 CAS.
- J.-K. Yuan, S.-H. Yao, Z.-M. Dang, A. Sylvestre, M. Genestoux and J. Bai, J. Phys. Chem. C, 2011, 115, 5515–5521 CAS.
- Y. Feng, W. L. Li, J. P. Wang, J. H. Yin and W. D. Fei, J. Mater. Chem. A, 2015, 3, 20313–20321 CAS.
- Y. Zhu, X. Huang, W. Li, J. Fu and X. Tang, Mater. Lett., 2008, 62, 1389–1392 CrossRef CAS.
- L. Zhu, Y. Xu, W. Yuan, J. Xi, X. Huang, X. Tang and S. Zheng, Adv. Mater., 2006, 18, 2997–3000 CrossRef CAS.
- P. Zhang, X. Huang, J. Fu, Y. Huang, Y. Zhu and X. Tang, Macromol. Chem. Phys., 2009, 210, 792–798 CrossRef CAS.
- S. Yang, C. Cao, Y. Sun, P. Huang, F. Wei and W. Song, Angew. Chem., 2015, 54, 2661–2664 CrossRef CAS PubMed.
- J. Fu, Q. Xu, J. Chen, Z. Chen, X. Huang and X. Tang, Chem. Commun., 2010, 46, 6563–6565 RSC.
- G. Pappas, S. Ferrari, X. Huang, R. Bhagat, D. Haddleton and C. Wan, Materials, 2016, 9, 35 CrossRef.
- V. K. LaMer and R. H. Dinegar, J. Am. Chem. Soc., 1950, 72, 4847–4854 CrossRef CAS.
- J. B. Ledeuil, A. Uhart, S. Soule, J. Allouche, J. C. Dupin and H. Martinez, Nanoscale, 2014, 6, 11130–11140 RSC.
- A. Sadezky, H. Muckenhuber, H. Grothe, R. Niessner and U. Pöschl, Carbon, 2005, 43, 1731–1742 CrossRef CAS.
- J. R. Dahn, W. Xing and Y. Gao, Carbon, 1997, 35, 825–830 CrossRef CAS.
- P. K. Dutta, R. Asiaie, S. A. Akbar and W. Zhu, Chem. Mater., 1994, 6, 1542–1548 CrossRef CAS.
- C. W. Beier, M. A. Cuevas and R. L. Brutchey, Langmuir, 2010, 26, 5067–5071 CrossRef CAS PubMed.
- M. B. Smith, K. Page, T. Siegrist, P. L. Redmond, E. C. Walter, R. Seshadri, L. E. Brus and M. L. Steigerwald, J. Am. Chem. Soc., 2008, 130, 6955–6963 CrossRef CAS PubMed.
- M. El Marssi, F. Le Marrec, I. A. Lukyanchuk and M. G. Karkut, J. Appl. Phys., 2003, 94, 3307 CrossRef CAS.
- M. Thommes, K. Kaneko, A. V. Neimark, J. P. Olivier, F. Rodriguez-Reinoso, J. Rouquerol and K. S. W. Sing, Pure Appl. Chem., 2015, 87, 1051–1069 CrossRef CAS.
- R. De Jaeger and M. Gleria, Prog. Polym. Sci., 1998, 23, 179–276 CrossRef CAS.
- Y. Zhu, H. Cui, X. Meng, J. Zheng, P. Yang, L. Li, Z. Wang, S. Jia and Z. Zhu, ACS Appl. Mater. Interfaces, 2016, 8, 6481–6487 CAS.
- X. Wang, G. Sun, P. Routh, D. H. Kim, W. Huang and P. Chen, Chem. Soc. Rev., 2014, 43, 7067–7098 RSC.
- G. Hasegawa, T. Deguchi, K. Kanamori, Y. Kobayashi, H. Kageyama, T. Abe and K. Nakanishi, Chem. Mater., 2015, 27, 4703–4712 CrossRef CAS.
- D. P. Almond and C. R. Bowen, Phys. Rev. Lett., 2004, 92, 157601 CrossRef CAS PubMed.
- C. Miot, E. Husson, C. Proust, R. Erre and J. P. Coutures, J. Eur. Ceram. Soc., 1998, 18, 339–343 CrossRef CAS.
- M. Wegmann, L. Watson and A. Hendry, J. Am. Ceram. Soc., 2004, 87, 371–377 CrossRef CAS.
- M. D. C. B. López, G. Fourlaris, B. Rand and F. L. Riley, J. Am. Ceram. Soc., 1999, 82, 1777–1786 CrossRef.
- L. Xie, X. Huang, C. Wu and P. Jiang, J. Mater. Chem., 2011, 21, 5897 RSC.
- L. Xie, X. Huang, Y. Huang, K. Yang and P. Jiang, ACS Appl. Mater. Interfaces, 2013, 5, 1747–1756 CAS.
Footnote |
| † Electronic supplementary information (ESI) available. See DOI: 10.1039/c7ra02186k |
| This journal is © The Royal Society of Chemistry 2017 |