
 Open Access Article
 This Open Access Article is licensed under a
 Creative Commons Attribution 3.0 Unported Licence
The distribution and role of nanoclay in lignocellulose–polymer blends
Sriharsha Karumuriab,
Salim Hizirogluc and
A. Kaan Kalkan*ab
aFunctional Nanomaterials Laboratory, Oklahoma State University, Stillwater, OK 74078, USA. E-mail: kaan.kalkan@okstate.edu; Tel: +1 405 744 5907
bDepartment of Mechanical Engineering, Oklahoma State University, Stillwater, OK 74078, USA
cDepartment of Natural Resource Ecology and Management, Oklahoma State University, Stillwater, OK 74078, USA
First published on 31st March 2017
Abstract
Lignocellulose–polymer blends (LCPBs), particularly those manufactured from wood biomass and recycled plastics, have gained significance as a green alternative to concrete and wood. In the present work, we investigate the mechanisms as to how nanoclay additives improve water-sorption resistance and durability in LCPBs. The microstructure of our extruded and molded clay–redcedar–polyethylene blends are imaged by micro-computed tomography (μ-CT), a promising technique for the characterization of composites. This recent and powerful 3D micro-imaging technique allows noninvasive revelation of the macroscopic to microscopic interactions between different components in a composite. Specifically, our μ-CT study reveals the smearing of clay nanoplatelets over the lignocellulose domains with partial impregnation into the lignocellulose void network. The μ-CT images also suggest partial disintegration of wood cellular structure in clay-added LCPBs. We attribute this modification to penetration of organocations from clay to lignocellulose, as validated by vibrational spectroscopy. To gain further insight, we also monitor the water-sorption kinetics. The kinetics revalidates the well-established role of clay in impeding water's diffusion. In addition, our analysis of the kinetics reveals a novel role of clay in water-sorption resistance. The clay, smeared over hygroscopic lignocellulose particles serves as a sealant and blocks the entry of water.
1. Introduction
Harnessing of recycled plastics and underutilized lignocellulosic biomass (such as, wood particles/fibers) in lignocellulose–polymer blends (LCPBs) or wood–plastic composites offers a green alternative to conventional structural materials, such as wood and concrete.1–3 Although LCPBs are superior to wood in terms of durability, they somewhat inherit vulnerability of wood biomass to moisture that poses a concern in the long term.4–7 The primary cause of degradation in LCPBs is moisture sorption, which directly results in dimensional instability.6 In addition, moisture in wood biomass indirectly degrades stability by promoting radiation damage, fungi, and termites.7,8 Clay nanoplatelets, when dispersed in a polymer matrix, are known to reduce permeability and diffusion of water. This function of nanoclay is generally attributed to the creation of tortuous diffusion paths for water molecules.9,10Typically, dispersion and exfoliation of nanoplatelets in a plastic matrix are achieved by either high-speed shear mixing or sonication of clay in the polymer melt, that involves overcoming of the electrostatic binding between nanoplatelets.10 However, such mixing processes will increase the production cost and greenhouse-gas emissions of LCPBs, which are already higher by 15 and 67%, respectively, compared to conventional pressure-treated wood lumber production.11 We envision two solutions to this problem. First, simpler and lower energy budget processes are needed for dispersion and exfoliation of clay particles in LCPBs. Second, the lifetime of the nanoclay-added LCPBs may be maximized by better understanding nanoclay's role in reducing permeability of water. Indeed, the present work reveals multiple mechanisms, how nanoclay impedes water's permeation.
In the present work, we establish smearing of clay nanoplatelets over the wood particles with partial impregnation into the lignocellulose void network during extrusion. Thereby, the nanoclay seals the hygroscopic wood particles and hinders penetration of water. This is a different role of nanoclay in improving dimensional stability than elongating water molecules' diffusion trajectories. Our work shows this clay–lignocellulose interaction is facilitated by the affinity of cations in the clay particles to weak acids over wood particles. For example, the major constituent of wood biomass, cellulose, is mildly acidic.12 This acidity of wood biomass further increases with the impurities, which promotes interaction of cellulose chains with cations and anions.13,14
Additionally, the present work explores distribution of clay in LCPBs. Although clay-added LCPBs have been demonstrated previously, dispersion of nanoplatelets has not been understood fully. Generally, dispersion of clay in polymer matrices has been evaluated by electron microscopy or X-ray diffraction. However, electron microscopy provides a poor contrast between clay and wood biomass fillers. As for X-ray diffraction, the signal from clay is masked by that of wood biomass fillers.
In the present work, we have been able to circumvent these shortcomings by micro-computed tomography (μ-CT) imaging. μ-CT offers high contrast between the composite components due to phase shift and difference in absorption. As we have demonstrated in the present work, this noninvasive imaging technique can elucidate macroscopic to microscopic interactions between different components in the blend structure. Indeed, for extruded polyethylene–lignocellulose blend samples, it reveals smearing of clay nanoplatelets over the lignocellulose particles with partial impregnation into the lignocellulose void network. Using vibrational spectroscopy (FTIR), we explain how smearing of the clay around lignocellulose particles occurs without sonication or high-speed shear mixing. Our FTIR work has revealed that the organocations in clay penetrate into the cell wall modifying lignocellulose to cationic. Subsequently, with the migration of cations from the clay, the negatively-charged nanoplatelets not only become loose, but also smear over the modified wood biomass surface.
The present work also exercises a potential approach to convert an underutilized resource in Oklahoma, namely Eastern redcedar (Juniperus virginiana L.), into a value-added green product. Eastern redcedar (ERC) is considered as an invasive species in Oklahoma playing an adverse role on overall ecology and wildlife due to its uncontrolled population increase.15,16 Previous work has evaluated properties of particleboard and sandwich-type panels made from ERC and demonstrated a performance level comparable to that of commercial products manufactured from other wood species.17–19
2. Materials and methods
2.1. Materials
ERC particles were screened to a size of 400 μm or smaller. High density polyethylene (HDPE) with melt flow index of 7.0 g per 10 min at 90 °C and density of 0.96 g cm−3 was purchased from Nova Chemicals, Inc. under the trade name SCLAIR 2908 resin. We employed a quaternary ammonium salt modified montmorillonite clay, which was supplied by Southern Clay Products as Cloisite 15A. To improve adhesion between plastic and wood, maleic anhydride grafted-polyethylene (MAPE) was employed (Eastman, Inc.).2.2. Preparation of LCPB samples
First, a mixture of 40% ERC and 60% HDPE by weight was prepared. Prior to mixing with ERC, HDPE was premixed with the coupling agent (5% by weight). Next, for the clay-added samples, separate mixtures were prepared by adding 3 and 6 weight percent clay. Subsequently, all three different mixtures (0, 3 and 6% clay) were separately mixed in a high-speed blender for 10 s for uniformity. Subsequently, each mixture was passed through a conical counter rotating twin-screw extruder, Conicor TSE, at a rotating speed of 50 rpm. The temperature profile of the screws was 160, 155, and 140 °C, from the conical hopper to the rod ride to the die, respectively. Prior to pelletizing, the extruded strands were washed in a water bath and cooled in a refrigerator. Next, the LCPB pellets were molded into dog-bone (ASTM D638-14, Type-I) and rectangular (115 × 13 × 3.2 mm3) specimens using a Boy 30 T2 injection molder. A total of 60 samples, 20 of each composition (i.e., 0, 3, and 6% clay) were prepared. The temperature profile of the conveyor screw in the injection molder was set to 170 and 160 °C, at the hopper and die, respectively.2.3. Mechanical testing
Tensile tests were performed on the injection-molded samples, which were prepared according to Type-I specification of the ASTM D638-14 standard. An Instron 5814 system was employed with an extensometer of 1-inch gauge-length and load-cell of 100 kN capacity. The elongation rate was set to 5 mm min−1. The average and standard error values were reported for three samples per case.2.4. FTIR spectroscopy
A Nicolet iS50 FTIR was employed in attenuated total reflectance mode (ATR) to verify the crosslinking reaction between MAPE and lignocellulose particles in LCPB samples as well as change in the lignocellulose structure during LCPB fabrication. The spectra were acquired in the range of 400 to 4000 cm−1, at a resolution of 2 cm−1, and after averaging 64 scans.2.5. Roughness measurement
A Hommel T-500 stylus profilometer (equipped with a Tk-300 skid type pick-up) was employed to characterize surface roughness of the samples. A total of 6 measurements were performed on each sample using a tracing span of 15 mm. Average roughness was acquired, as discussed in detail in previous studies.20,21 Surface roughness of control samples and those exposed to 8 days of water soaking was measured.2.6. Dimensional stability tests
Dimensional stability of LCPB samples was evaluated in the form of thickness swelling and water sorption. We adopted ASTM D570-98, according to which the LCPB samples were soaked in water at room temperature, followed by measurement of gain in mass, m, and thickness, d, due to water sorption for every 24 h. We acquired d and m at accuracy levels of 0.01 mm and 0.1 g, respectively. The percentage of thickness swelling, TS (%), and mass gain, Δm (%), were computed using eqn (1) and (2), respectively.
 | (1) |
 | (2) |
2.7. Micro-tomography
Microstructure and dispersion of nanoclay in LCPB samples were investigated using an Xradia 410 Versa μ-CT system. A series of radiographs with 1.08 μm pixel size were acquired from 0 and 6% clay-added LCPB samples at a voltage of 40 kV and a power of 9.8 W. In Xradia 410 Versa, the μ-CT scintillator is mounted on a microscope to magnify the visible radiation, which is obtained from the conversion of transmitted X-rays. Here, we employed a magnification of 10× in converting X-rays into visible radiation. These acquired radiograph images were converted into tomographic slices by reconstruction using Zeiss Dual Scan Contrast Visualizer software. Additionally, visualization of these μ-CT images and segmentation were performed using Avizo 8.0 software.3. Results and discussion
3.1. Micro-tomography; distribution and interaction of nanoclay
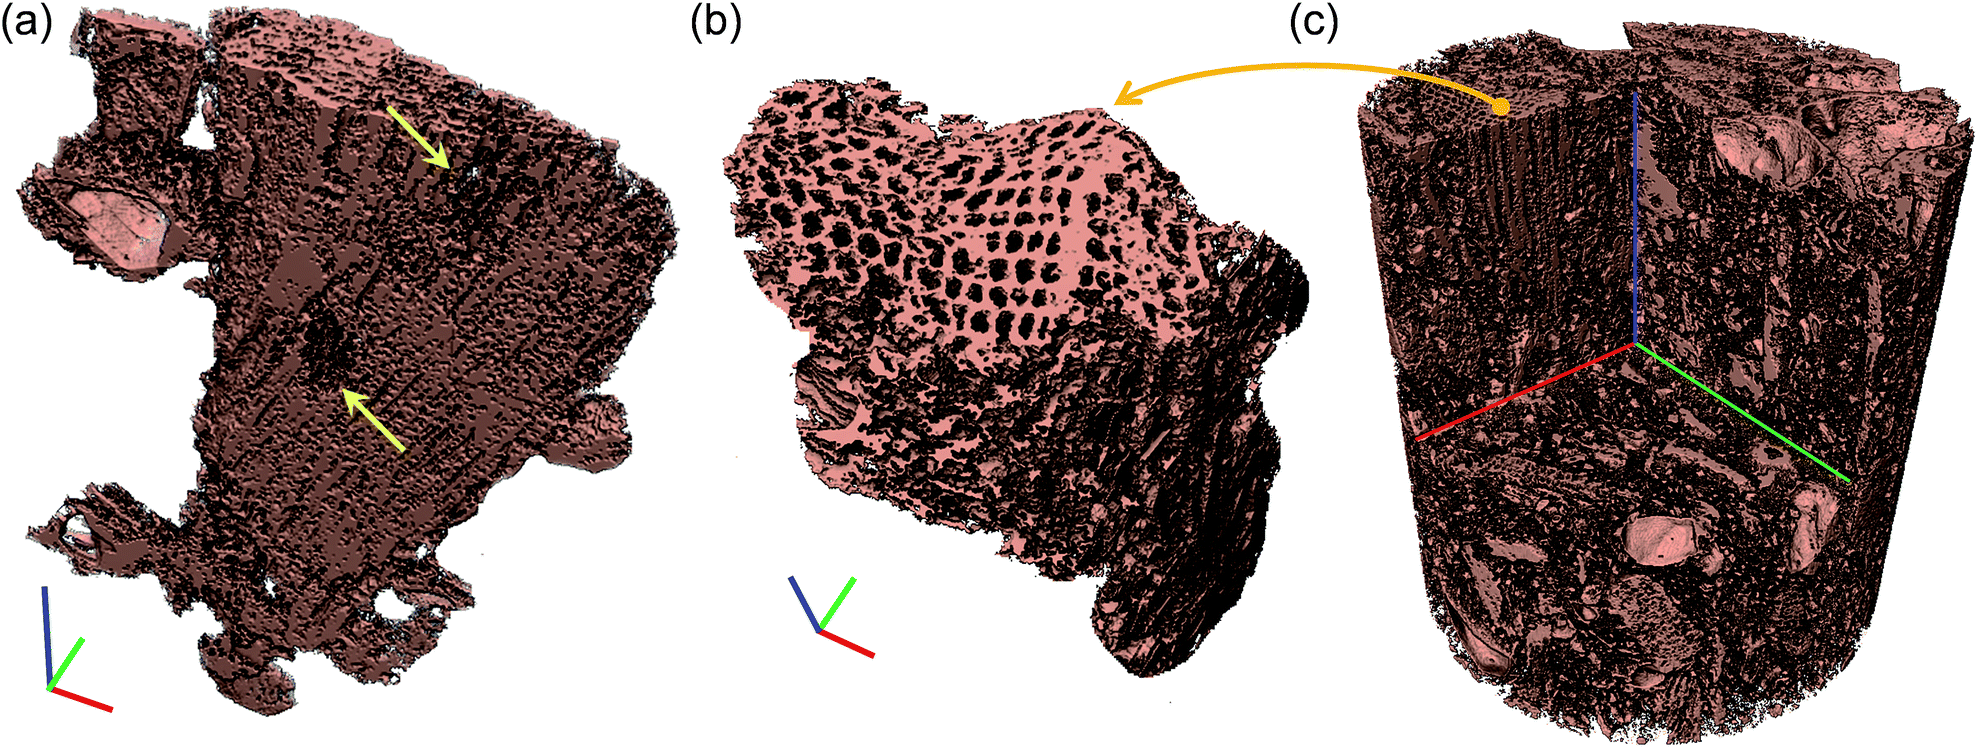
Fig. 1a depicts a representative 3D tomography image of the 6% clay-added LCPB sample with a voxel size of 1.08 μm, which is reconstructed from the radiographs acquired. The brightest features (red arrows) represent clay particles, as clay has a higher X-ray absorption coefficient than wood and HDPE, whereas the darkest domains correspond to voids. Likewise, ERC (lignocellulose) particles (white arrows) appear brighter than HDPE (yellow arrows) because of their higher X-ray absorption. Higher absorption coefficient of the lignocellulose is attributable to high degree of crystallinity in the arrangement of biopolymers in lignocellulose than polymer chains in HDPE. Depending upon contrast against background (air), which is assigned as zero brightness level, each component is segmented by a threshold in the intensity values. Then, the segmented components are rendered in pseudo colors as shown in Fig. 1b.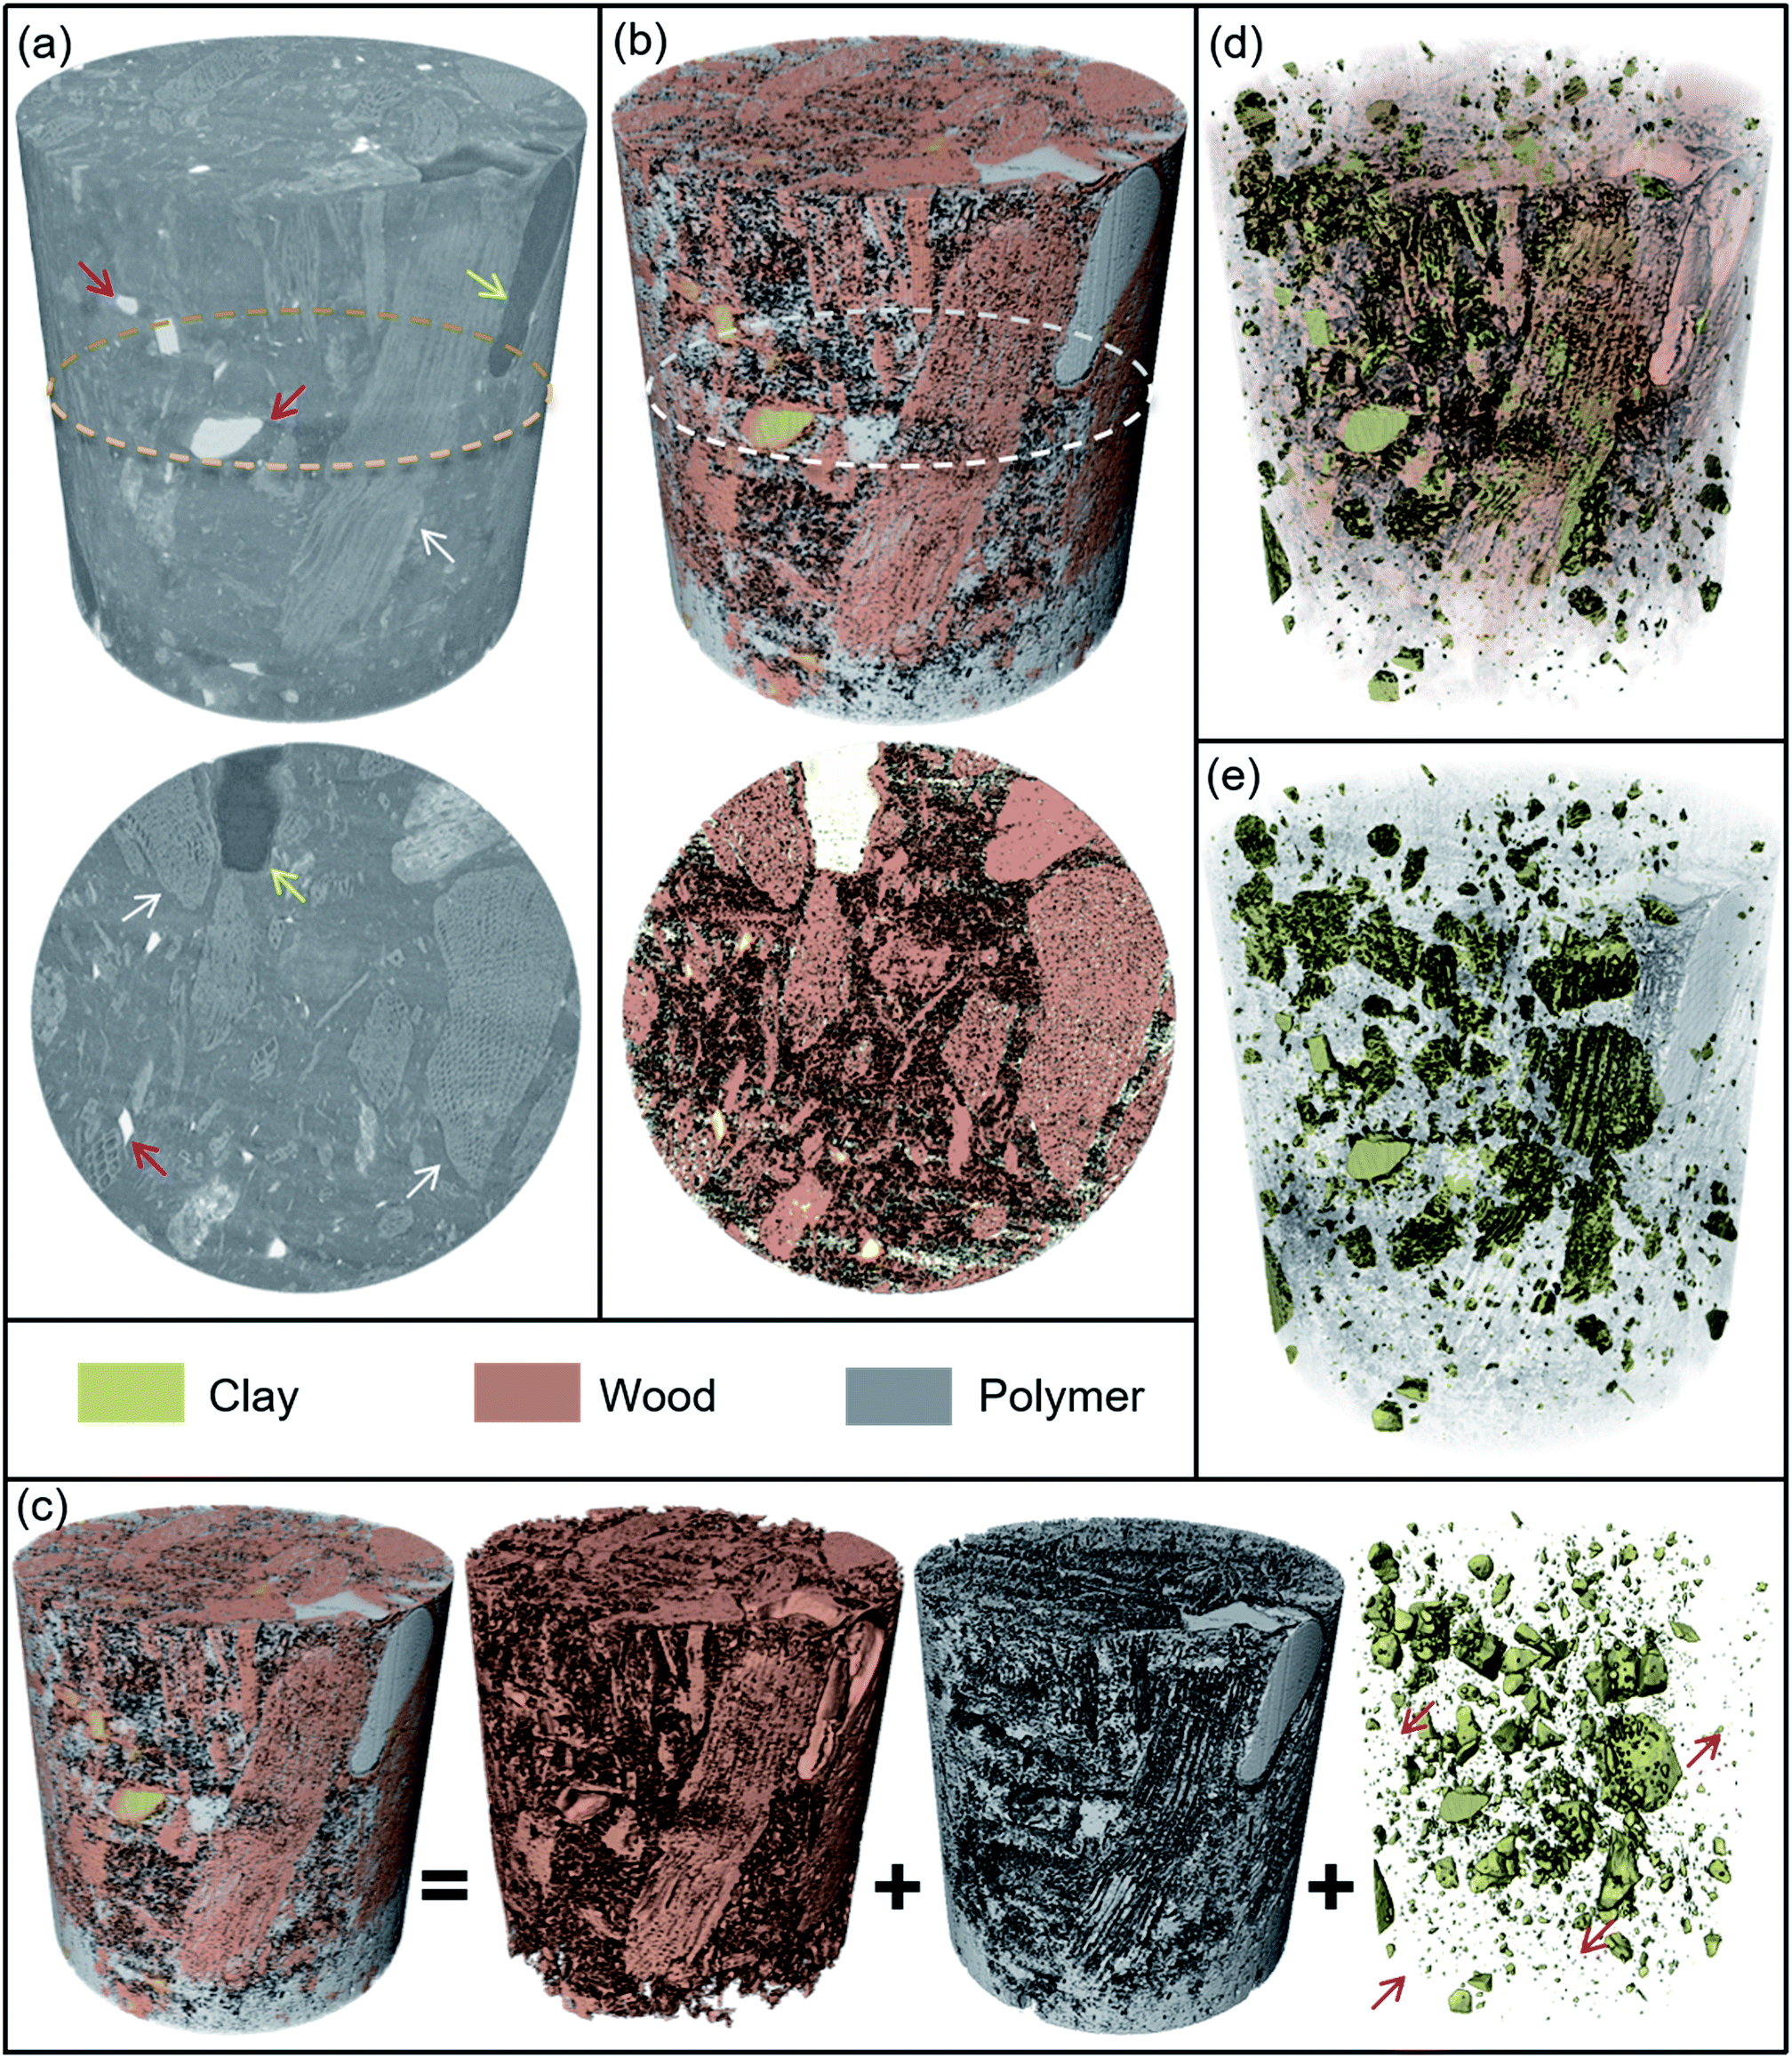 | ||
| Fig. 1 (a) 3D rendering of 6% clay-added LCPB constructed from 969 μ-CT slices. The representative sites of clay, polymer, and lignocellulose (wood) are shown by arrows in red, yellow, and white, respectively. The circular micrograph below the 3D image is the corresponding cross section acquired at half the height. (b) Segmented 3D μ-CT image in pseudo colors. The circular micrograph below the 3D image is the corresponding cross section acquired at half the height. (c) Lignocellulose, polymer and clay components of the blend structure in (b) are filtered by image processing and shown as individual constituent segments. (d) Interaction of clay with lignocellulose surface is imaged by setting lignocellulose to semitransparent and filtering polymer using image processing. (e) Interaction of clay with polymer by setting polymer to transparent and filtering lignocellulose using image processing. Pseudo color for each component is indicated in the legend. The representative dispersed clay nanoplatelets are depicted by arrows (in red) in the 3D clay image. The tomography renderings here are 1000 μm in diameter and 1000 μm in length. | ||
The segmented tomography images of each component in the blend structure are displayed in Fig. 1c. In addition, interaction of clay with lignocellulose surface is imaged in Fig. 1d by applying partial (semitransparent) and complete filter (fully transparent or invisible) on lignocellulose and polymer, respectively. Whereas, Fig. 1e reveals interaction of clay with polymer by applying partial and complete filter on polymer and lignocellulose, respectively. For the lignocellulose component, the cellular structure is clearly seen constituting tracheids, pits, and vessels for transportation of water. However, a significant damage in the cellular structure is also visible from region to region in the form of fractured walls and disintegration (randomized porous structure). This disruption of wood's natural structure is led by shear forces during extrusion and injection molding. However, the high level of disintegration observed here, has not been evidenced for LCPBs without clay although same magnitude of shear stresses is present.
The difference in the extent of damage in two cases, with (6%) and without clay, is demonstrated by μ-CT slices (in Fig. 2a–h) and 3D tomography images (in Fig. 3a–c). Here, we observe two modes of failure in the lignocellulose (ERC) particles: (i) the fracture as well as deformation of the cell walls, and (ii) disintegration in the cellular structure of lignocellulose particles. The difference in the level of cell wall damage in two cases is revealed by the μ-CT slices displayed by Fig. 2a–h. The representative μ-CT slices of control LCPB (0% clay) in Fig. 2a–d show characteristic features of cellular structure, such as tracheids, taxodioid pits, perforation plates, and vessels. These characteristic features of cellular structure exhibit no apparent fracture or deformation. Whereas, for the 6% clay-added LCPB, there is discernible deformation and fracture in the characteristic features of the cellular structure as highlighted by arrows in Fig. 2e–h. Fig. 3a shows 3D tomography image of a representative lignocellulose particle selected from the 6% clay-added LCPB sample. Here, a significant level of disintegration is seen at the highlighted sites. In comparison with a representative lignocellulose particle selected from a control sample (0% clay), whose tomography image is shown in Fig. 3b, the extent of damage in the lignocellulose particle of the 6% clay-added LCPB sample is higher. The location of the representative wood particle (Fig. 3b) inside the control LCPB is shown in Fig. 3c.
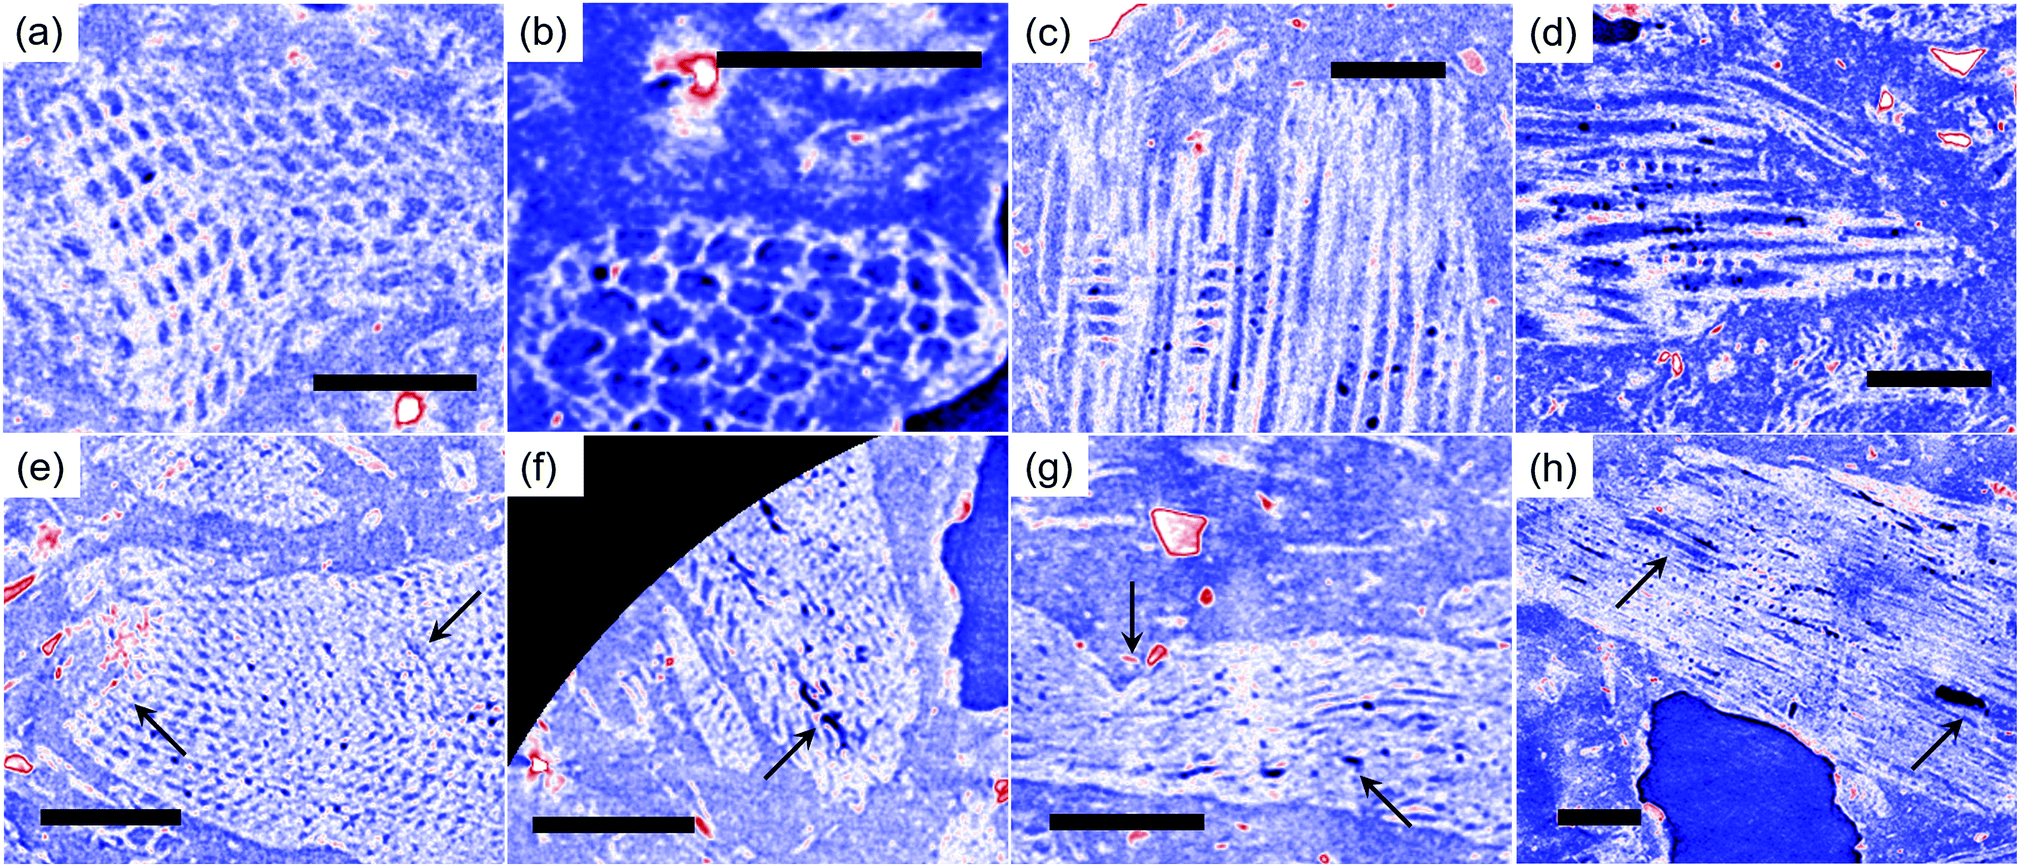 | ||
| Fig. 2 Representative μ-CT slices comparing the cellular structure of lignocellulose particles in 0% (a–d) and 6% (e–h) clay-added LCPBs. The μ-CT slices of 0% clay-added LCPBs show undamaged tracheids (a) and (b); taxodioid pits (c); perforation plates and vessels (d) of the wood cellular structure. Whereas, fracture and disintegration of wood cell walls in 6% clay-added LCPBs at tracheids (e) and (f); vessels (g); perforation plates (g); and taxodioid pits (h) are observed as indicated by the arrows. The scale bars in these μ-CT slices correspond to 100 μm. Here, the gray scale μ-CT slices are shown in black-blue-white-red color scheme, where the order corresponds to increasing brightness. | ||
 | ||
| Fig. 3 (a) 3D rendering of a representative lignocellulose particle in 6% clay-added LCPB. The disintegrated sites in the wood particle are highlighted by arrows. The x-, y-, z-axis bars (red, green, blue) are 55 μm long, each. (b) 3D view of a representative wood particle selected from the tomography image of the control LCPB (0% clay) sample (c). The axis bars in (b) are 38 μm long, each. The tomography rendering in (c) is 1000 μm in diameter and 1000 μm in length. The location of the selected lignocellulose particle in (b) is shown by the arrow. | ||
Accordingly, the observed disruption must be facilitated by a mechanism unique to the presence of clay. We anticipate softening of the cell wall occurs due to hydrogen bonding cleavage in cellulose domains under the action of organocations diffusing from the clay stacks during the high temperature process (i.e., extrusion). Indeed, the organocations akin to those in organoclay have been employed in pretreatment of wood biomass for easing biofuel extraction.22,23 During pretreatment in such a process, the organocations of ionic liquids create disorder in lignocellulose structure because of which the penetration of enzymes into wood is enhanced for hydrolysis.22,23 This pretreatment involves interaction of cations and anions with wood biomass at high temperatures (i.e., >150 °C). In our case, ionization of clay–organocation complexes as well as migration of their organocations should be facilitated by an electrolyte or a polar medium. Inherently, water is trapped inside cellular network of lignocellulose particles acting as a polar medium. This trapped water likely transforms to steam during the extrusion and is easily transported to the wood particle surfaces enabling the organocation penetration into lignocellulose. Further, the diffused-out water during extrusion is replenished by the next steps of washing and refrigeration prior to molding. The presence of water during the molding stage further allows for organocation penetration. The temperatures ranging from 140 to 170 °C during extrusion and injection molding suffice the high temperature requirement for the organocation penetration. In addition, the observed structural damage is most likely synergized by the clay particles, which act as microgrinders.
Other notable features in the wood particles (in Fig. 1e) are deep impressions shown with arrows (white) in which clay and HDPE have penetrated. On the other hand, the segmented tomography image of HDPE in Fig. 1e shows structural wood patterns imprinted on or transferred to polymer internal surface. This pattern transfer indicates strong adhesion of polymer to wood biomass because of modification of the lignocellulose surface chemistry by MAPE coupling agent from polar to nonpolar. The segmented tomography image of clay particles in Fig. 1e shows clay domains in a wide size distribution from the measurement resolution limit of 1 μm (red arrows) to 50 μm. Typical organo-clay, which is employed in this work, consists of stacks of negatively-charged silicate nanosized platelets (of diameter 2 to 13 μm) held together by quarternary ammonium salt. As seen in the highlighted regions (red arrows) in the figure, organo-clay is partially dispersed in the LCPB matrix.
Further, to investigate the interaction of clay with lignocellulose and HDPE, we apply a partial filter for wood particles and complete filter for HDPE as seen in Fig. 1c, as well as vice versa in Fig. 1d. Fig. 1c reveals the clay nanoplatelets are smeared over the lignocellulose particles. Impregnated clay aggregates are also seen inside the lignocellulose particles. This smearing of clay platelets validates the claim that the shearing action during LCPB fabrication induces dispersion of clay as a result of release and penetration of organocations into lignocellulose. With organocation penetration into lignocellulose surface, the wood biomass surface transforms to cationic, because of which the smearing of negatively-charged nanoclay platelets is favoured. On the other hand, as seen in Fig. 1e, the interaction of clay and HDPE (wood particles are filtered) is inferred to be poorer. Unlike lignocellulose, HDPE is not modified into cationic; therefore, it does not exhibit strong attraction with negatively-charged clay nanoplatelets. In addition, the shear forces are too low in LCPB fabrication of the present work to overcome surface tension of the polymer melt and promote diffusion of HDPE chains into clay stacks.
3.2. Vibrational spectroscopy; elucidation of nanoclay interaction with lignocellulose
In this section, we report our FTIR spectroscopy analysis, which validates two important attributes of the clay: (i) delivery of organocations to the lignocellulose and (ii) smearing of nanoclay over lignocellulose particles. We also confirm crosslinking of maleic anhydride groups in the coupling agent (MAPE) to hydroxyls of lignocellulose. Although we focus on the role of clay in the present work, we will first discuss MAPE–wood crosslinking in this section, because such background knowledge will be necessary to reveal clay's contribution in the FTIR spectra.During lignocellulose–MAPE crosslinking, the grafted maleic anhydride groups of the coupling agent react with the hydroxyls on the lignocellulose surface as illustrated in Fig. 4a. As seen in the schematic, this reaction grafts polyethylene chain to lignocellulose by either mono- or di-ester groups. In case of the mono-ester link, carboxyl acid group is generated. Whereas, in case of di-ester link, water is produced as the byproduct. The modification of lignocellulose surface with MAPE crosslinking changes the ERC particle surface to nonpolar. Thus, the interaction of wood biomass with HDPE chains is enhanced during LCPB fabrication.
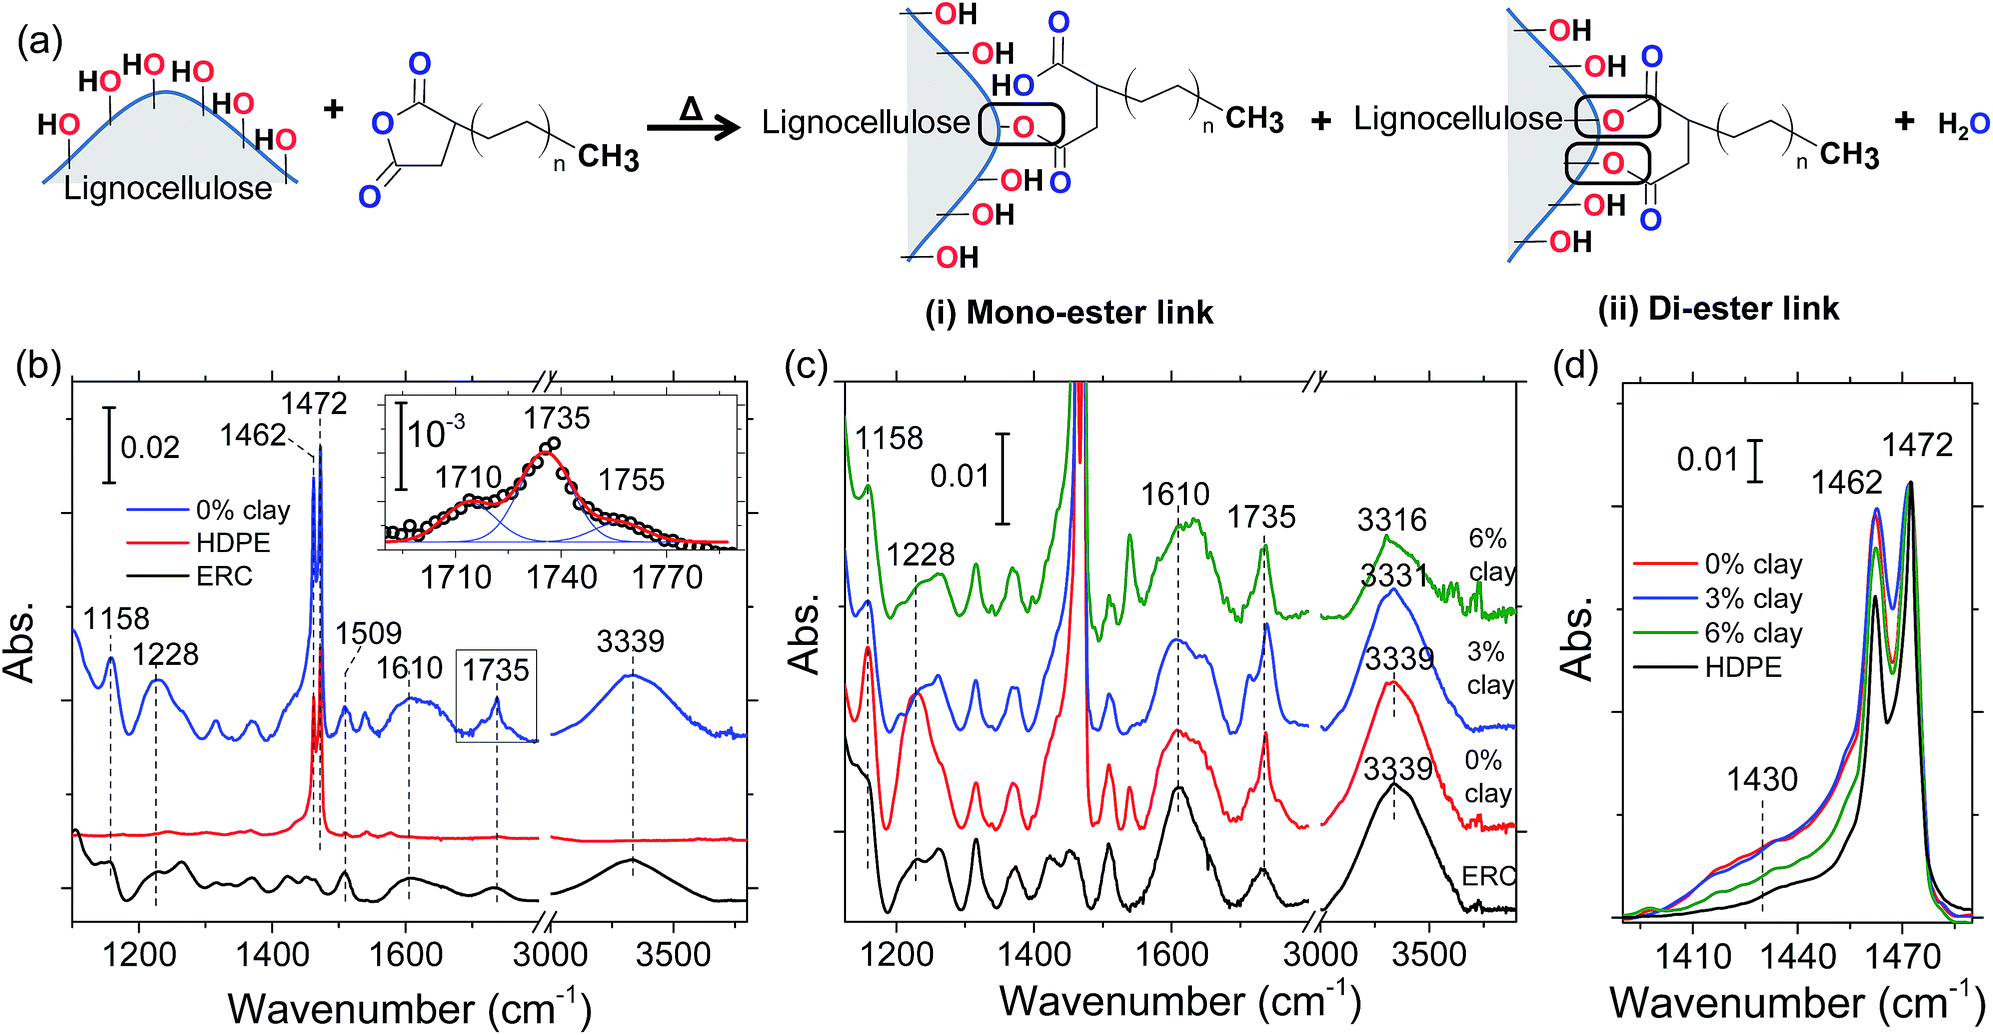 | ||
| Fig. 4 (a) Schematic illustrating the crosslinking reaction between the coupling agent and lignocellulose surface. (b) FTIR spectra of LCPB precursors (i.e., ERC particles and HDPE) and LCPB. The inset shows emergence of the 1755 cm−1 peak in the deconvoluted spectrum of LCPB. FTIR spectra of LCPBs (0, 3, and 6% clay) in comparison with that of ERC particles (c) and HDPE (d). | ||
Fig. 4b shows the FTIR spectra of LCPB, HDPE, and ERC particles. The peak at 1610 cm−1 in LCPB and ERC spectra is ascribed to C![[double bond, length as m-dash]](https://www.rsc.org/images/entities/char_e001.gif) C stretching in phenyl groups of lignin.24–26 Since those groups are unreacted during LCPB fabrication, we normalize the LCPB and ERC spectra with respect to 1610 cm−1 peak intensity.24,25 The peaks at 1460 and 1472 cm−1 in the FTIR spectra of HDPE and LCPB are associated with C–H bending in CH2 groups of the HDPE matrix.27 The frequency splitting of this mode is due to stronger and weaker van der Waals attractions between adjacent HDPE chains in the crystalline and amorphous structures, respectively.27 The intensity ratio of these two peaks (I1460/I1472) is less for LCPB than HDPE (as received). The lower ratio in LCPB indicates reduction in crystallinity of HDPE during LCPB processing, which is owed to higher level of disorder because of rapid cooling during injection molding as well as presence of wood/polymer interfaces.
C stretching in phenyl groups of lignin.24–26 Since those groups are unreacted during LCPB fabrication, we normalize the LCPB and ERC spectra with respect to 1610 cm−1 peak intensity.24,25 The peaks at 1460 and 1472 cm−1 in the FTIR spectra of HDPE and LCPB are associated with C–H bending in CH2 groups of the HDPE matrix.27 The frequency splitting of this mode is due to stronger and weaker van der Waals attractions between adjacent HDPE chains in the crystalline and amorphous structures, respectively.27 The intensity ratio of these two peaks (I1460/I1472) is less for LCPB than HDPE (as received). The lower ratio in LCPB indicates reduction in crystallinity of HDPE during LCPB processing, which is owed to higher level of disorder because of rapid cooling during injection molding as well as presence of wood/polymer interfaces.
The peak at 1735 cm−1 in the lignocellulose and LCPB spectra (Fig. 4b) is assigned to stretching of CO in esters, whereas the peak at 1755 cm−1 (in the inset of Fig. 4b) is characteristic of CO stretching in carboxylic acid groups.24,25 Clearly, the 1755 cm−1 peak is only seen for LCPB. This appearance indicates the formation of carboxylic acid groups in the crosslinking reaction during mono-ester formation as described in the schematic of Fig. 4a. Meanwhile, the band at 3339 cm−1 in the lignocellulose and LCPB spectrum (Fig. 4b) is ascribed to O–H stretching in hydroxyl groups of lignocellulose.24,25 The ratio of integrated intensities of the peaks associated with CO (i.e., 1735 and 1755 cm−1) and O–H stretching, ICO/IO–H, in wood particles is 0.097. Whereas, in case of LCPB, the ratio is 0.154. This increase is explained in terms of an increase in the density of ester/carboxylic acid groups as well as decrease in the hydroxyl concentration after crosslinking reaction of hydroxyls with maleic anhydride. Hence, crosslinking between hydroxyls of lignocellulose and maleic anhydride of coupling agent is corroborated. The crosslinking is also validated by the peaks at 1158 and 1228 cm−1, which are associated with C–O stretching in ester and carboxylic acid groups, respectively.24 As seen in Fig. 4b, the normalized intensities of these peaks (with respect to 1610 cm−1) are higher in LCPB than ERC. This increase indicates a rise in the density of ester and carboxylic acid groups due to crosslinking between MAPE and ERC particles.
Next, we validate our hypothesis about penetration of organocations into lignocellulose. We focus on the O–H stretching band at 3339 cm−1, whose intensity decreases during lignocellulose–polymer crosslinking. However, fractional decrease of this band does not exhibit a systematic trend with the clay content, as shown in Fig. 4c. We explain this irregular behavior as follows. Two subsequent events influence the O–H band spectrally. In the first step, organocations penetrate into lignocellulose and lead to cleavage of H-bonds between adjacent cellulose chains. Typically, the cleavage of the H-bonds in cellulose is expected to result in intensity increase and high-frequency shift of the O–H stretching band due to increased dipole moment as well as bond stiffness, respectively, in O–H.28 On the contrary, herein we observe a lower-frequency shift of the O–H band to 3331 and 3316 cm−1 for 3% and 6% clay, respectively. This opposite trend is attributed to the interaction of organocations with the lone pair electrons of O in hydroxyls of cellulose, subsequent to H-bond cleavage. As a result of this interaction, the bond stiffness and dipole moment in O–H are reduced leading to low-frequency shift in stretching and simultaneous weakening in the intensity. Thus, under the influence of two opposite effects of organocations on the O–H bond dipole moment, we observe an irregular change in intensity of O–H bond with clay content. Nevertheless, we infer these changes are indicative of the organocation penetration into lignocellulose. Moreover, here we observe heterogeneous broadening of O–H stretching band in 3 and 6% clay spectra. This broadening is attributed to new population of hydroxyls that are interacting with organocations.
To further purport our assertion about organocation penetration, we examine the crystallinity of cellulose in ERC (lignocellulose) particles. Accordingly, we inspect bending mode of C–H moieties. Generally, C–H bending in cellulose is characterized by the 1460 cm−1 peak.24 However, frequency splitting occurs (i.e., at 1430 and 1460 cm−1 in Fig. 4d) in lignocellulose owing to the stronger and weaker van der Waals attractions in crystalline and amorphous structures, respectively. Fig. 4d shows a decrease in the intensity of 1430 cm−1 peak with clay content. This intensity reduction signifies disruption of the cellulose crystallinity, which is inferred to occur due to cleavage of H-bonds by organocation penetration.
Additionally, with the release of organocations from the clay, the loosely-stacked nanoplatelets can adhere over modified lignocellulose particles. Indeed, our tomography investigation has already revealed clay is smeared over lignocellulose particles during LCPB process. For further corroboration, we compare FTIR spectra of LCPBs of different clay contents (0, 3, and 6%) in Fig. 4c. These spectra are also normalized with respect to the 1610 cm−1 peak intensity. As seen, the increase (with respect to ERC) in the normalized intensities of 1158, 1228, and 1735 cm−1 (i.e., markers of wood–polymer crosslinking) is the highest for 0% clay LCPB sample. This situation is attributed to impediment of crosslinking between MAPE and lignocellulose by the clay nanoplatelets smeared onto wood particles.
3.3. Variation of mechanical properties with nanoclay
Fig. 5a shows the stress–strain curves of the LCPB samples with 0, 3, and 6% clay content by weight. Apparently, LCPB samples exhibit a brittle failure. The photos in the inset of Fig. 5a indicate the samples failed at the leading edge in the injection direction. Therefore, we infer a higher density of voids at this location, likely caused by increasing viscosity and decreasing mobility of the melt inside the mold with temperature decrease in the direction of flow. The fractured surface images in Fig. 5b and c show the voids formed during injection molding that resulted in the brittle failure. The modulus of elasticity and tensile strength as a function of clay content are evaluated from the stress–strain curves and displayed in Fig. 6. The average and standard error values are presented in Table 1.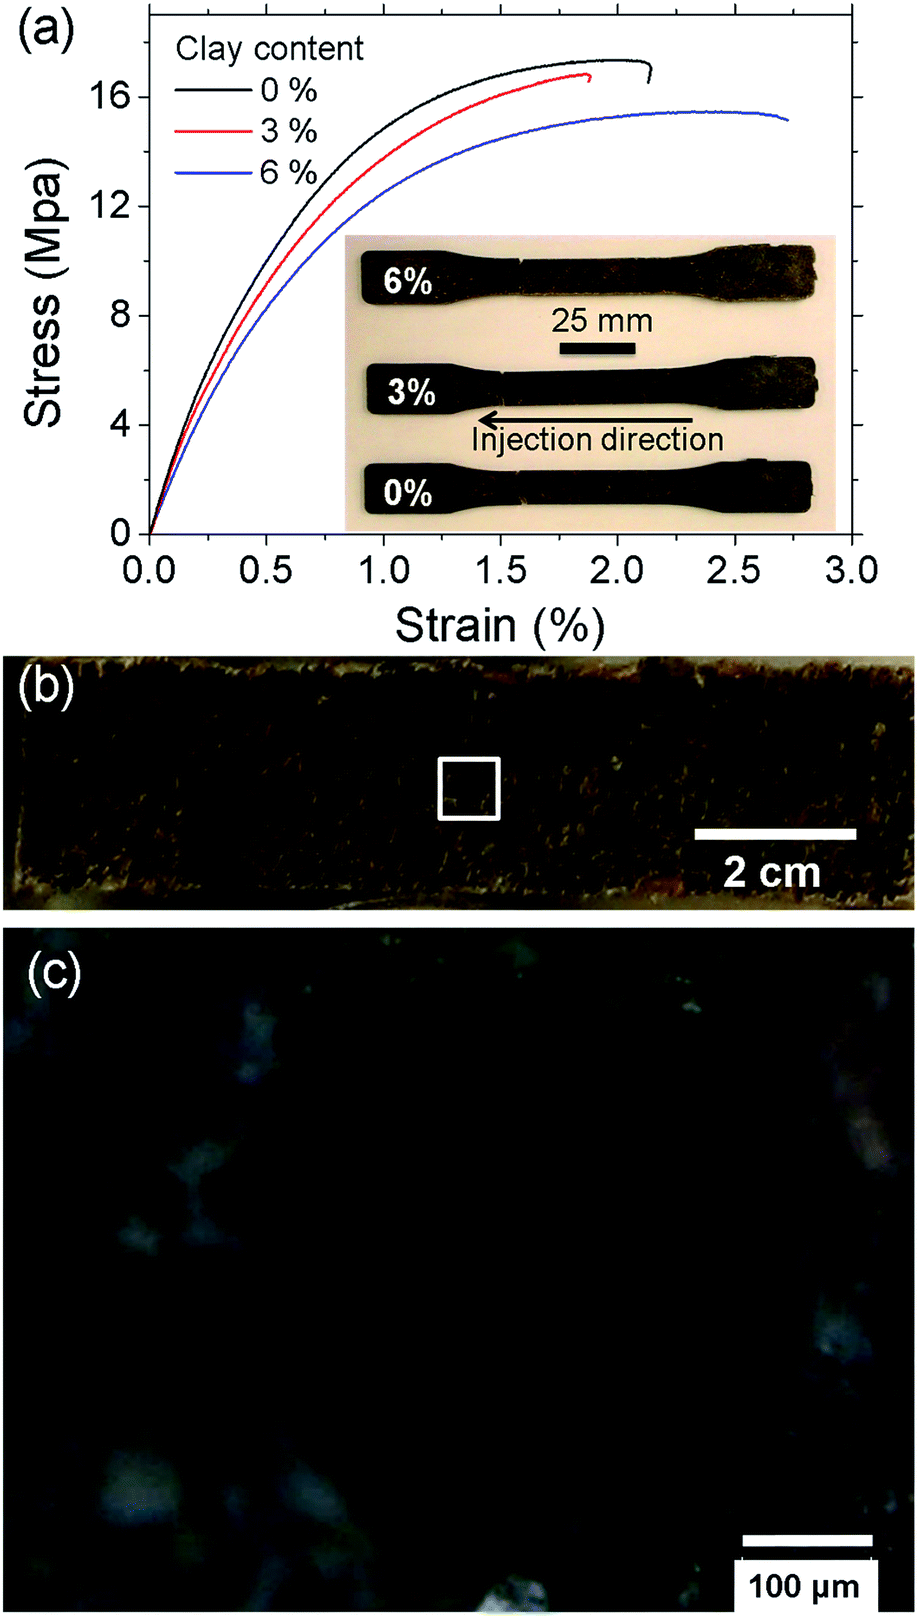 | ||
| Fig. 5 (a) Stress–strain behavior of the LCPB samples of varying clay content. The inset shows the fractured samples. (b) Micrograph shows a representative fractured surface. (c) Magnified image of the highlighted area in (b). | ||
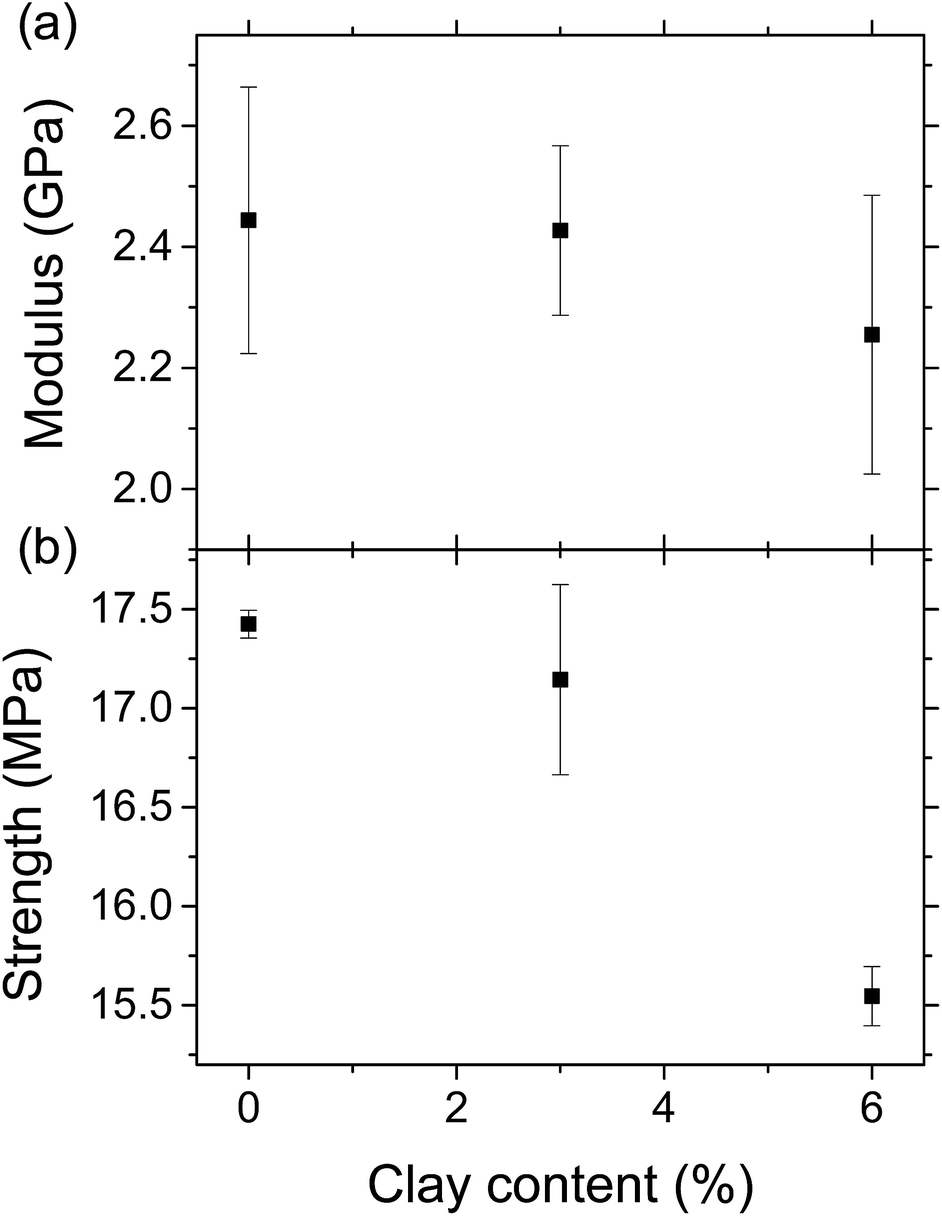 | ||
| Fig. 6 Modulus of elasticity (a) and tensile strength (b) of the LCPB samples. | ||
| 0% clay | Average | Error | |||
| Modulus (GPa) | 2.65 | 2.54 | 2.14 | 2.44 | 0.22 |
| Strength (MPa) | 17.34 | 17.43 | 17.51 | 17.43 | 0.07 |
![[thin space (1/6-em)]](https://www.rsc.org/images/entities/char_2009.gif) |
|||||
| 3% clay | Average | Error | |||
| Modulus (GPa) | 2.24 | 2.48 | 2.56 | 2.43 | 0.14 |
| Strength (MPa) | 16.79 | 16.82 | 17.82 | 17.15 | 0.48 |
|
|||||
| 6% clay | Average | Error | |||
| Modulus (GPa) | 2.56 | 2.21 | 1.99 | 2.26 | 0.23 |
| Strength (MPa) | 15.76 | 15.47 | 15.42 | 15.56 | 0.15 |
The elastic modulus for 0% clay LCPB (shown in Table 1) is 130% higher than that of neat HDPE (E = 1050 MPa), being attributed to reinforcement by wood biomass.29 As seen from Fig. 6a and b, the elastic modulus does not change, while the tensile strength is slightly reduced with clay content. In case of 6% clay, the tensile strength has reduced by 11% with respect to neat LCPB. The primary reason for clay not improving the mechanical properties is due to lack of its dispersion and exfoliation in the PE matrix. Because the fabrication of LCPBs is performed by direct blending of clay, lignocellulose, and HDPE pellets together in the twin-screw mixer, the level of shear mixing is limited, while adhesion of clay onto wood particles is promoted by release and penetration of organocations into wood from clay particles. As a result of smearing clay nanoplatelets around wood particles, the density of crosslinks between MAPE and ERC particles is expected to decrease, that is indeed verified by vibrational spectroscopy (previous section). This reduction in the crosslinking density weakens lignocellulose–HDPE interaction leading to a decreased tensile strength.
3.4. Impact of nanoclay on dimensional stability
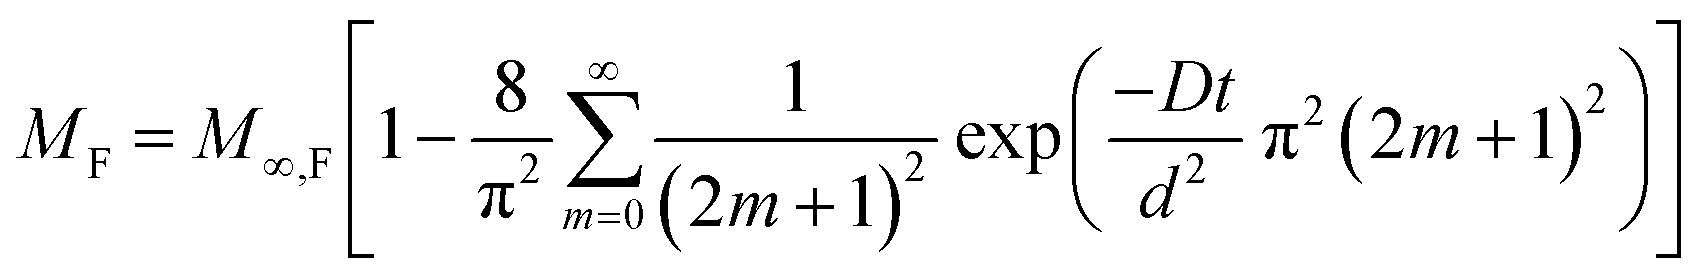
An important attribute of LCPBs that is inherited with the addition of clay is reduction in water sorption. Typically, it has been already known that clay improves the barrier properties of polymer matrix because of creation of tortuous paths for penetrant molecules.9 However, the present work reveals a previously unknown role of nanoclay in water-sorption resistance, which is by means of sealing of hygroscopic lignocellulose particles. As Fig. 7a shows, water sorption of the control is 0.31% at the end of 1 day water soaking test, whereas it is 0.28 and 0.18% for 3 and 6% clay-added specimens, respectively. After 8 days of water soaking, water sorption is measured as 1.15, 1.10, and 0.96% for specimens of 0, 3, and 6% clay, respectively (Fig. 7a). Benthien and Ohlmeyer measured water sorption for LCPBs as 1.4% at the end of 7 days of water soaking test, which is within the range of data acquired in our work.30 Similarly, nanoclay improves the resistance of LCPB to thickness swelling as shown in Fig. 7b. As a result of 8 days of water soaking, control samples exhibit an average thickness swelling of 0.59%, while those samples with 3% and 6% clay swell by 0.50% and 0.46%, respectively. Apparently, the presence of nanoclay enhances dimensional stability of the samples.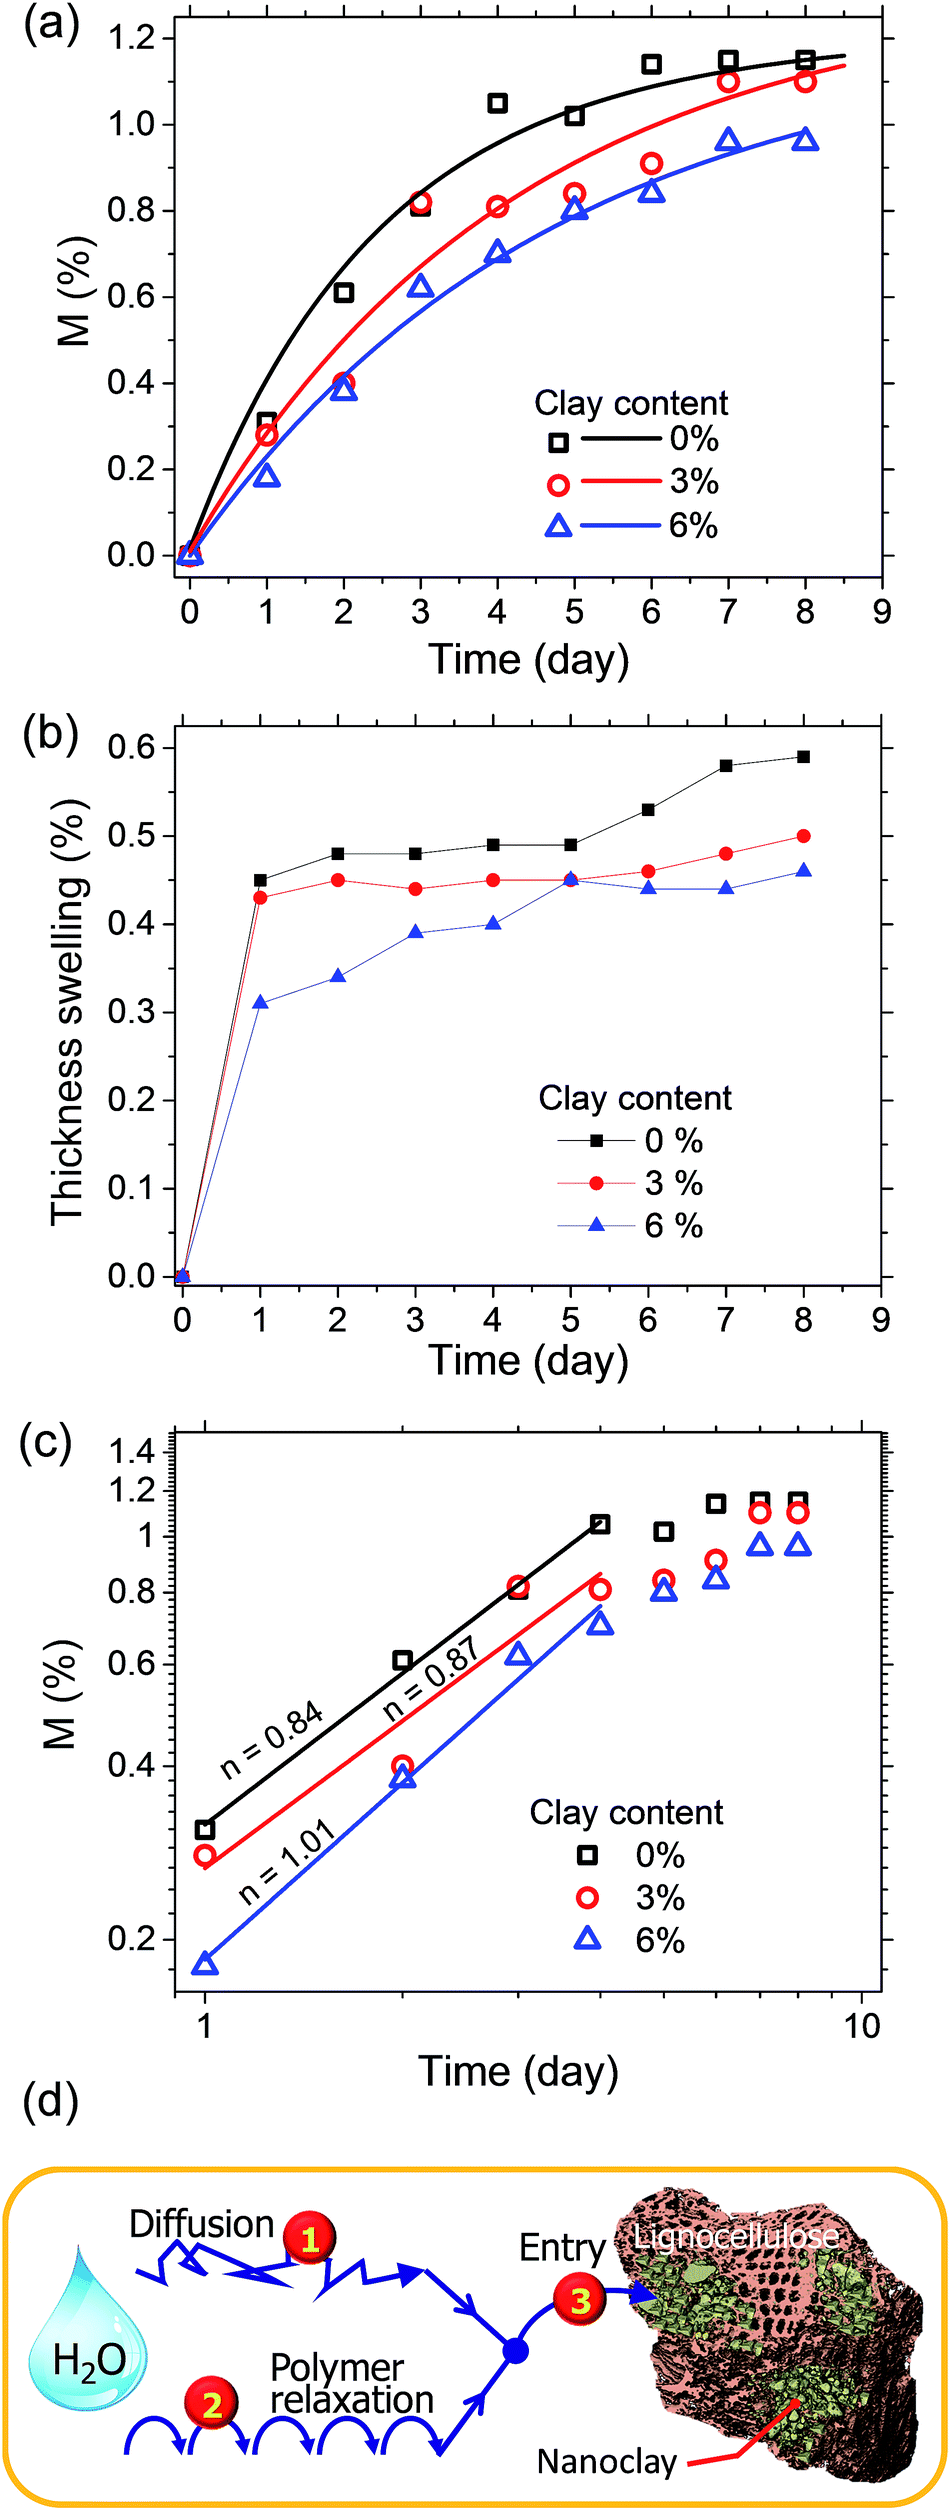 | ||
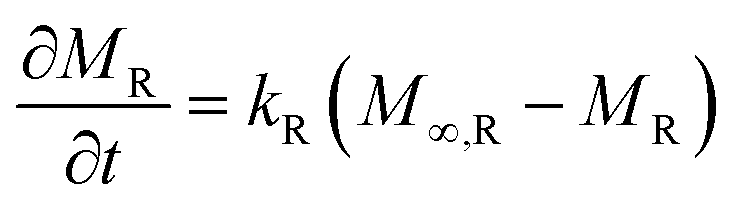
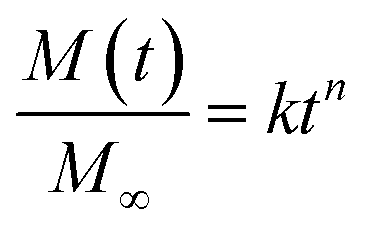
| Fig. 7 (a) Plots showing the normalized variation of water sorption in LCPB samples with clay content. (b) Dimensional stability of LCPBs of different clay content after soaked in water. (c) log–log plot of water sorption vs. time and evaluation of the index, n (slope in the initial regime), for identifying the type of sorption mechanism. (d) Schematic representation of water sorption by 3 pathways in LCPB samples. The experimental data and theoretical model in (a, c) are shown by scattered data points and solid lines, respectively. | ||
3.5. Water sorption; role of nanoclay
Sorption of penetrants (e.g., H2O) by polymeric materials generally occurs by: (i) diffusion of penetrants and/or (ii) polymer relaxation.31–35 The diffusion-controlled penetrant sorption is governed by Fick's second law, and the solution of the rate equation is given by eqn (3).32 Here, MF is the mass of water (per unit area) absorbed at time t, d is the thickness, D is the diffusion coefficient, and M∞,F is the equilibrium mass of water absorbed.
 | (3) |
Additionally, the absorbed penetrant mass (per unit area) by the polymer relaxation mechanism, MR, obeys eqn (4a), whose solution is given by eqn (4b). Here, kR and M∞,R are the coefficient of polymer relaxation and absorbed mass at equilibrium, respectively.
 | (4a) |
| MR = M∞,R(1 − exp(kRt)) | (4b) |
In certain cases, the rate of penetrant sorption is controlled by diffusion as well as polymer relaxation, and this case is termed as “anomalous diffusion” or “non-Fickian diffusion”.32,33 The total mass of absorbed penetrant in case of non-Fickian diffusion is given by M(t) = MF + MR. The mode of penetrant sorption is identified from the initial slope in log–log plot of M versus t that follows a simple power law as given by eqn (5), where M∞ is the total mass of absorbed penetrant at equilibrium (i.e., given by M∞ = M∞,F + M∞,R). When n ≤ 0.5, penetrant sorption
 | (5) |
Here, for evaluating the mode of penetrant sorption, we consider the percentage weight gain of LCPBs due to sorption, which is equivalent to M(t), as they are directly proportional to each other. In the present work, n is found to be 0.84 and 0.87 for 0 and 3% clay-added samples, respectively as obtained from the slope of log–log plot shown in Fig. 7c. Hence, the water sorption in these two cases follows anomalous or non-Fickian diffusion, where the polymer relaxation dominates over diffusion. For the 6% clay-added LCPB, n is found as 1.01. Therefore, contribution of diffusion to water sorption for 6% clay content sample is negligible at the time scale of our experiments and water sorption can be modelled by polymer relaxation only.
On the other hand, to estimate M∞,F and M∞,R in 0 and 3% clay-added LCPBs due to anomalous diffusion, we fit M(t) (i.e., percent change in mass) using sum of eqn (3) and (4). The diffusion coefficients for fitting M(t) are obtained by eqn (6), which is the simplified form of Fick's solution in the initial regime.32 Here, the value of  is the initial slope of M(t) vs. t/d, which is linear per Fick's second law general solution.
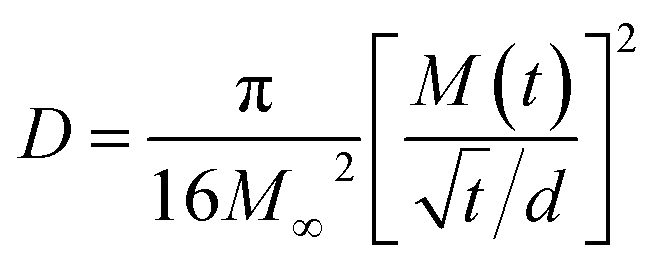 | (6) |
Table 2 shows the decrease of diffusion coefficient with the clay content revalidating the well-established role of clay in impeding water's diffusion in the polymer matrix. Here, although the diffusion coefficient is not zero for 6% clay-added LCPBs, it is low enough to neglect diffusion, because n ≥ 1. Accordingly, the experimental data for 6% clay sample in Fig. 7a is fitted to the model of polymer relaxation only. On the other hand, for 0 and 3% clay-added LCPBs, the theoretical fits for M(t) in Fig. 7a incorporate the theoretical mechanisms of both diffusion and polymer relaxation. The fraction of water intake by diffusion at equilibrium, M∞,F/M∞, also decreases with clay content as tabulated in Table 2.
| Water soaking | Clay content (%) | |||
|---|---|---|---|---|
| 0 | 3 | 6 | ||
| Mass of water absorbed (%) | 1 day | 0.31 | 0.28 | 0.18 |
| 8 day | 1.15 | 1.1 | 0.96 | |
| Thickness swelling (%) | 1 day | 0.45 | 0.43 | 0.31 |
| 8 day | 0.59 | 0.5 | 0.46 | |
| Index (n) | 0.8 | 0.8 | 1.01 | |
| Diffusion coefficient (mm2 per day) | 0.019 | 0.007 | 0.004 | |
| Fraction of water intake by diffusion M∞,F/M∞ | 0.267 | 0.04 | ≈0 | |
| Fraction of water intake by diffusion M∞,R/M∞ | 0.733 | 0.96 | ≈1 | |
| Polymer relaxation coefficient kR (per day) | 0.42 | 0.24 | 0.21 | |
Another instrumental parameter, which is predicted by fitting MR(t) to eqn (4b), is the polymer relaxation coefficient, kR. As seen from Table 2, kR decreases with the clay content up to 2-fold. At first, this trend may be perceived as contradictory, because dispersion of nanoclay in polymer should enhance kR as a result of the plasticizing effect. Therefore, one would expect increasing nanoclay content leads to either increase or no remarkable change in kR. On the other hand, a plausible explanation for the observed reduction of kR may be associated with the unique arrangement of smeared nanoclay layers between lignocellulose and polymer. This arrangement is anticipated to reinforce the blend structure and restrict the relaxation of polymer chains during swelling that is consistent with the reduction of kR. Yet, this explanation is not fully satisfactory, because the binding between the polymer and clay is weak as we show with both FTIR and mechanical testing.
Accordingly, we conjecture that the trend above, that is, decrease of kR with clay content, arises from a third mechanism, which is not incorporated to our model (i.e., a mechanism other than diffusion and polymer relaxation). As illustrated in Fig. 7d, this third mechanism, being in series with diffusion and polymer relaxation, is the entry of water into the lignocellulose particles. Because the polymer matrix is hydrophobic, the majority of the absorbed water is present inside the hydrophilic lignocellulose particles. The wood biomass particles have a high tendency to hold water due to capillary forces (surface tension) as well as undergo volumetric expansion (swelling), an effect known as imbibition. However, the imbibition of water in submillimeter wood particles, as in the present work, is expected to be complete in minutes or hours in liquid water and not rate limit the water sorption kinetics observed here. On the other hand, in the blends studied here, the lignocellulose particles receive water from the surrounding polymer matrix, where water is dispersed at the molecular level (i.e., in the free volume). Hence, rate of entry of water to lignocellulose particles scales with the interface area. Therefore, the presence of a clay layer at the polymer/lignocellulose interface sealing the wood particles will impede and rate limit the entry of water. Nevertheless, it is the polymer matrix, which rate limits the transport of water to the lignocellulose particles by diffusion and polymer relaxation, as we have discussed so far. Therefore, how does the third mechanism, entry of water to lignocellulose domains, influence the polymer relaxation?
We further explain the above trend of kR with clay content as follows. Unlike diffusion, penetrant front in polymer relaxation moves due to rearrangement of polymer chains in response to the osmotic pressure, which is created between the swollen and unswollen regions due to the gradient of penetrant concentration.33 In the absence of nanoclay, the transport of water to the lignocellulose domains occurs through free volume network in the polymer, which is self-organizing under osmotic pressure (i.e., relaxation). In this case, the interconnected free volume network serves as a pipeline to the lignocellulose particles, where water accumulates. Water is insistently imbibed by the wood particles from the polymer matrix. This transport process also relieves the stress in the polymer matrix. In other words, the ability of water to be displaced/transported through this pipeline facilitates polymer structure relax with reduced constraints. Therefore, the presence of lignocellulose particles enhances water transport channel by polymer relaxation. On the other hand, in clay-added LCPBs, the nanoclay at the polymer/lignocellulose interface impedes the entry of water into hygroscopic wood particles. As a result, water remains trapped inside the polymer matrix that results in restriction of polymer chain motion. Initially, polymer chain mobility in all LCPB samples (i.e., 0, 3 and 6%) is anticipated to have weak dependence on the clay content. However, upon the initiation of water intake, the increasing amount of highly immobilized water in the polymer matrix, increases the restriction in the polymer chain mobility.
To summarize the above discussion, nanoclay blocks water's entry to the lignocellulose particles and hence restricts its motion along the free volume network of the polymer. Hence, the polymer chains, in tendency to relax, experience difficulty in displacing water. As a result, the chains end up with reduced mobility accounting for the observed decrease in kR. In our opinion, this is an important inference, by which the kinetics data corroborate the sealing role of nanoclay in enhancing water-sorption resistance, and it corroborates implication of the same by μ-CT and FTIR characterizations. Interestingly, the restriction of the polymer relaxation implies higher swelling stresses to develop. Indeed, formation of higher swelling stresses with clay content is validated by roughness measurements. The increase in the surface roughness after 8 day water soaking is 49.7, 73.2, and 100.9% for 0, 3, and 6% clay content, respectively. As explained in the literature, the increased roughness is indicative of increased swelling stresses.36,37
4. Conclusions
The present work reveals a novel role of nanoclay in enhancing water-sorption resistance in LCPBs. This unique action of nanoclay is different from its improving water-sorption resistance by creation of torturous diffusion paths. Instead, it involves sealing of hygroscopic lignocellulose particles that is corroborated by μ-CT, FTIR and water-sorption kinetics. By μ-CT, we disclose the following insights: (i) clay nanoplatelets are smeared over the lignocellulose particles at significant coverage; (ii) nanoclay inside HDPE matrix is mainly aggregated and majority of clay nanoplatelets are anticipated to be at the polymer/lignocellulose interfaces; and (iii) strong adhesion of HDPE onto the MAPE grafted lignocellulose surface (as established by different characterization tools in the past). Additionally, μ-CT indicates a higher degree of disintegration of wood cellular structure in clay-added LCPBs during extrusion. Using FTIR spectroscopy, we explicate the dispersion of nanoclay is facilitated by organocation migration from clay stacks into lignocellulose. This organocation migration not only modifies lignocellulose surface to cationic, but also weakens the binding between nanoplatelets. Hence, it mediates anionic nanoclay smear over wood particles during LCPB fabrication. This organocation migration also results in the cleavage of H-bonds between cellulose chains that leads to partial disintegration of wood particles during LCPB fabrication. The water-sorption kinetics indicate that water intake in LCPBs follow anomalous or non-Fickian diffusion of water at 3% clay content. Whereas, at 6% nanoclay, diffusion becomes negligible and water sorption is governed completely by polymer relaxation. Based on the water-sorption kinetics, we conclude the sealing action of nanoclay impacts the water-sorption resistance indirectly through slowing down the polymer relaxation as follows. Nanoclay impedes water's entry to the wood particles. Therefore, it becomes more difficult to displace water in the polymer free volume network while the polymer chains have to reconfigure during the relaxation process. As a result, the chain mobility is restrained and water's transport by polymer relaxation is impeded.Acknowledgements
We acknowledge the funding by Oklahoma State University (OSU) Technology and Business Development Program under Grant number 2014-12. We thank Ç. Özge Topal for her assistance in tensile tests. The authors also acknowledge the Undergraduate Teaching Laboratory of OSU Chemistry Department for FTIR acquisitions. We also thank Masoud Moradian of School of Civil and Environmental Engineering, OSU for his assistance in μ-CT data acquisitions.References
- A. A. Klyosov, Wood-Plastic Composites, John Wiley & Sons, Inc., Hoboken, New Jersey, 2007 Search PubMed.
- C. Clemons, For. Prod. J., 2002, 52, 10–18 Search PubMed.
- A. Ashori, Bioresour. Technol., 2008, 99, 4661–4667 CrossRef CAS PubMed.
- J. S. Fabiyi, A. G. McDonald, M. P. Wolcott and P. R. Griffiths, Polym. Degrad. Stab., 2008, 93, 1405–1414 CrossRef CAS.
- J. S. Fabiyi, A. G. McDonald and D. McIlroy, J. Polym. Environ., 2009, 17, 34–48 CrossRef CAS.
- J. J. Morrell, N. M. Stark, D. E. Pendleton and A. G. McDonald, Wood Design Focus, 2006, 16, 7–10 Search PubMed.
- P. Morris and P. Cooper, For. Prod. J., 1998, 48, 86 Search PubMed.
- J. F. Rabek, Polymer photodegradation mechanisms and experimental methods, Chapman and Hill, London, 1995 Search PubMed.
- C. Lu and Y.-W. Mai, Phys. Rev. Lett., 2005, 95, 088303 CrossRef PubMed.
- S. Pavlidou and C. D. Papaspyrides, Prog. Polym. Sci., 2008, 33, 1119–1198 CrossRef CAS.
- J. Tollefson, Nature, 2013, 498, 13–14 CAS.
- E. Heymann and G. Rabinov, J. Phys. Chem., 1941, 45, 1152–1166 CrossRef CAS.
- K. Sanderson, Nature, 2011, 474, S12–S14 CrossRef CAS PubMed.
- M. E. Himmel, S.-Y. Ding, D. K. Johnson, W. S. Adney, M. R. Nimlos, J. W. Brady and T. D. Foust, Science, 2007, 315, 804–807 CrossRef CAS PubMed.
- R. P. Adams, Biomass, 1987, 12, 129–139 CrossRef CAS.
- T. G. Bidwell, D. Engle, M. E. Moselay and R. E. Masters, Invasion of Oklahoma rangeland and forests by eastern redcedar and ashei juniper, Oklahoma Cooperative Extension Service, Oklahoma State University, 2003 Search PubMed.
- S. Karumuri, S. Hiziroglu and A. K. Kalkan, ACS Appl. Mater. Interfaces, 2015, 7, 6596–6604 CAS.
- S. Hiziroglu, Materials, 2009, 2, 926 CrossRef CAS.
- S. Hiziroglu, R. B. Holcomb and Q. L. Wu, For. Prod. J., 2002, 52, 72–76 Search PubMed.
- S. Hiziroglu, For. Prod. J., 1996, 46, 67 Search PubMed.
- M. Mirmehdi, X. Xie and J. Suri, Handbook of texture analysis, Imperial College Press, 2009 Search PubMed.
- A. Brandt, J. Grasvik, J. P. Hallett and T. Welton, Green Chem., 2013, 15, 550–583 RSC.
- A. M. da Costa Lopes, K. G. João, A. R. C. Morais, E. Bogel-Łukasik and R. Bogel-Łukasik, Sustainable Chem. Processes, 2013, 1, 3 CrossRef.
- K. K. Pandey, J. Appl. Polym. Sci., 1999, 71, 1969–1975 CrossRef CAS.
- K. K. Pandey and K. S. Theagarajan, Holz Roh- Werkst., 1997, 55, 383–390 CrossRef CAS.
- O. Faix and J. H. Bottcher, Holz Roh- Werkst., 1992, 50, 221–226 CrossRef CAS.
- S. Krimm, C. Liang and G. Sutherland, J. Chem. Phys., 1956, 25, 549–562 CrossRef CAS.
- J. Joseph and E. D. Jemmis, J. Am. Chem. Soc., 2007, 129, 4620–4632 CrossRef CAS PubMed.
- O. Faruk and L. M. Matuana, Compos. Sci. Technol., 2008, 68, 2073–2077 CrossRef CAS.
- J. T. Benthien and M. Ohlmeyer, Eur. J. Wood Wood Prod., 2013, 71, 437–442 CrossRef CAS.
- S. Tamrakar and R. A. Lopez-Anido, Construct. Build. Mater., 2011, 25, 3977–3988 CrossRef.
- J. Crank and G. S. Park, Diffusion in Polymers, Academic Press, New York, 1968 Search PubMed.
- D. A. Bond and P. A. Smith, Appl. Mech. Rev., 2006, 59, 249–268 CrossRef.
- A. R. Berens and H. B. Hopfenberg, J. Polym. Sci., Part B: Polym. Phys., 1979, 17, 1757–1770 CrossRef CAS.
- A. R. Berens and H. B. Hopfenberg, Polymer, 1978, 19, 489–496 CrossRef CAS.
- N. L. Thomas and A. H. Windle, Polymer, 1980, 21, 613–619 CrossRef CAS.
- N. L. Thomas and A. H. Windle, Polymer, 1982, 23, 529–542 CrossRef CAS.
| This journal is © The Royal Society of Chemistry 2017 |